Weekly Update: Striking the Balance

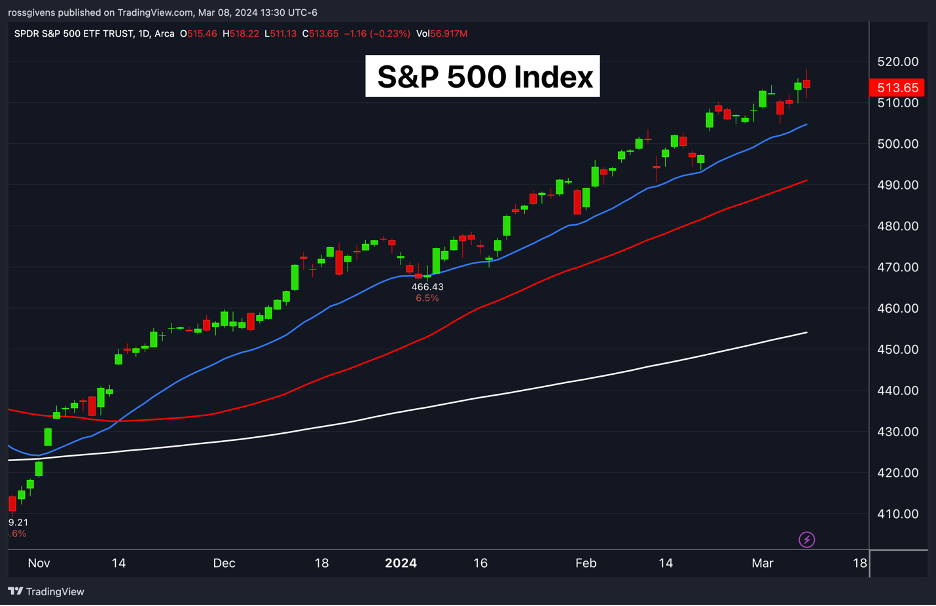
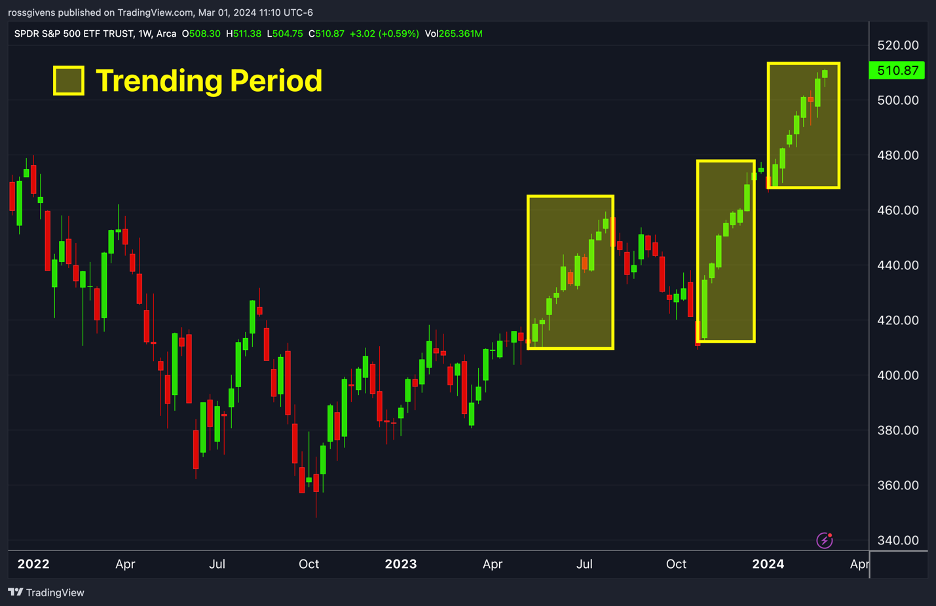
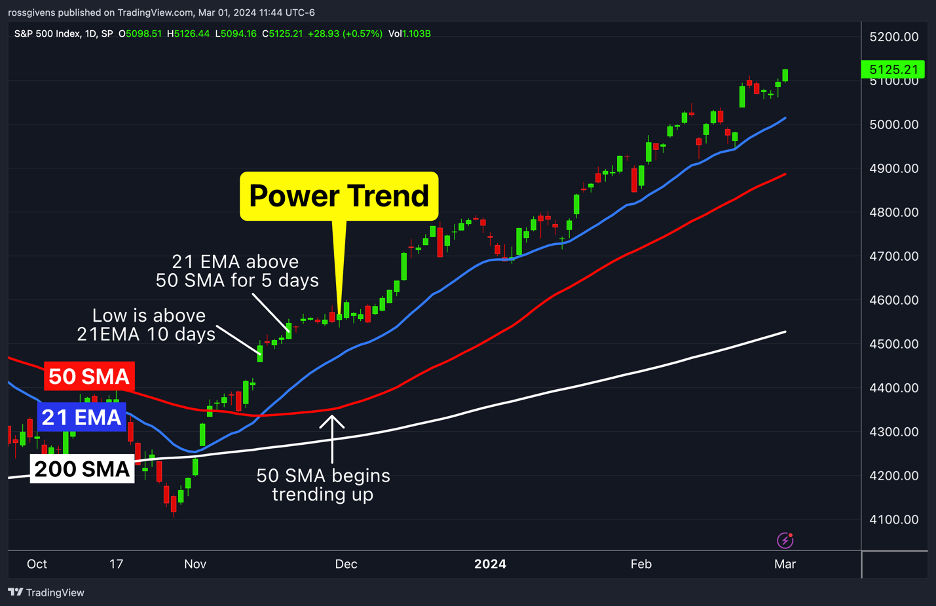
As of 11:30 AM ET on Friday, the S&P 500 is up about 1.7% for the week while the Nasdaq is up by 1.2%. Yesterday, they closed at new record highs.

The pullback I think is overdue doesn’t look like it’s going to happen within the next few days (although the market has a tendency to surprise you).

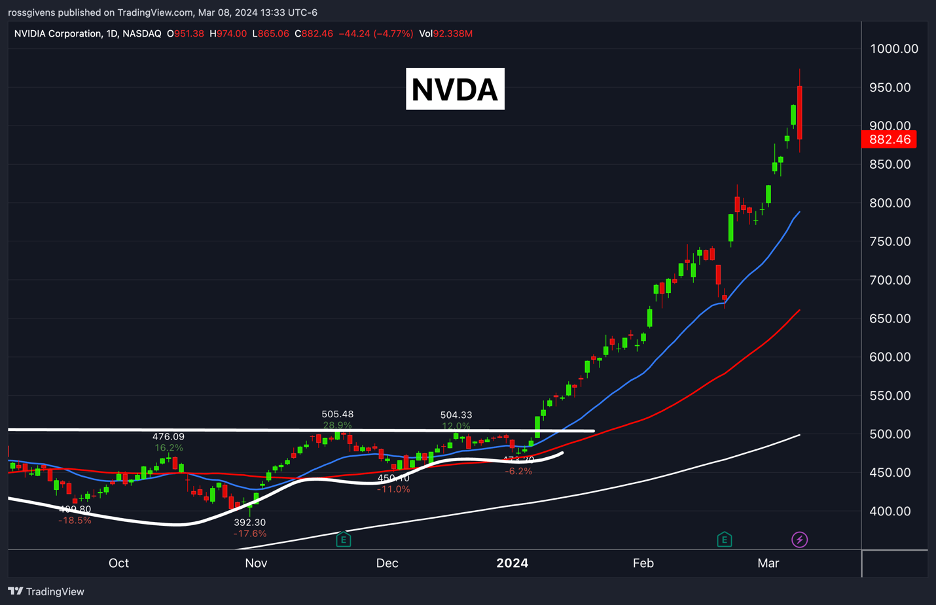
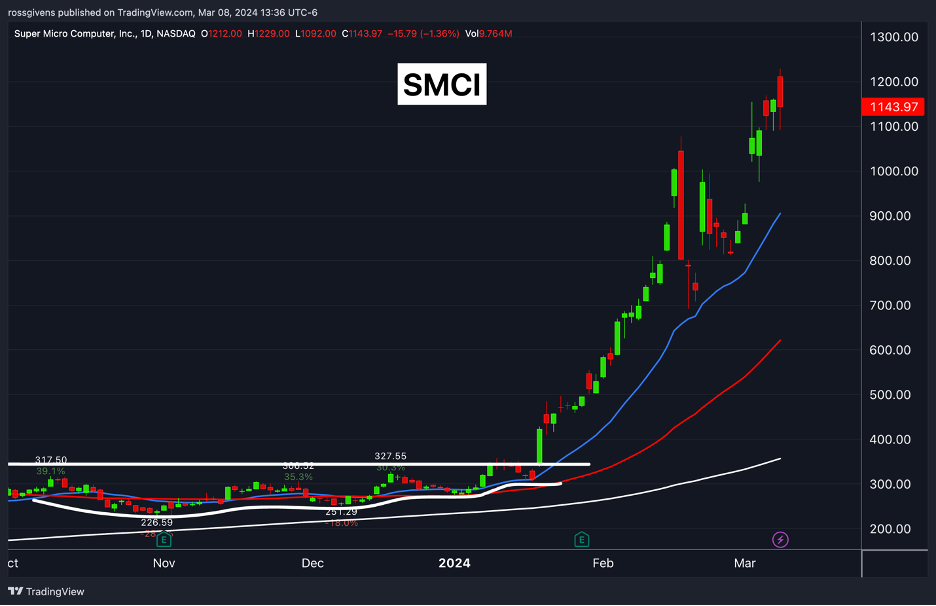
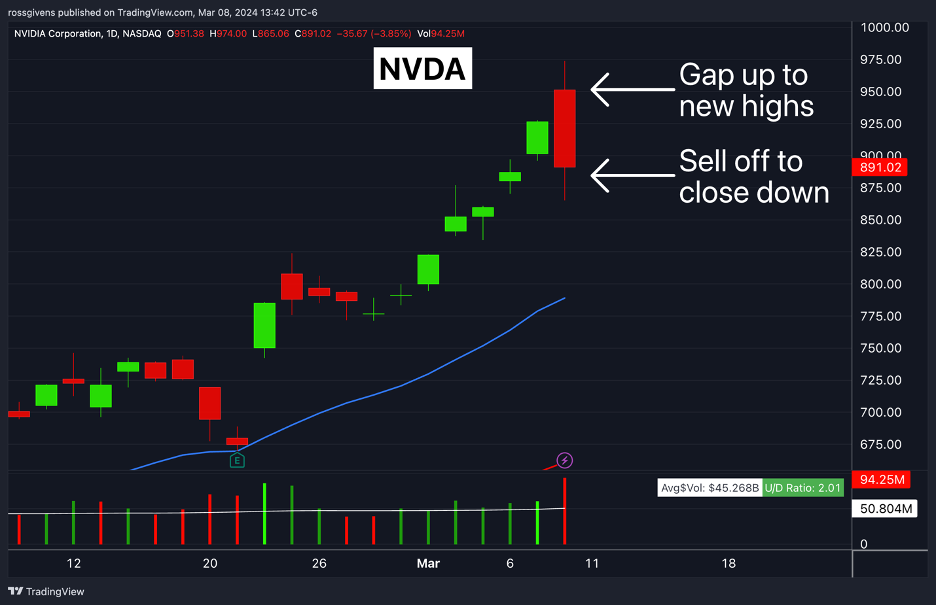
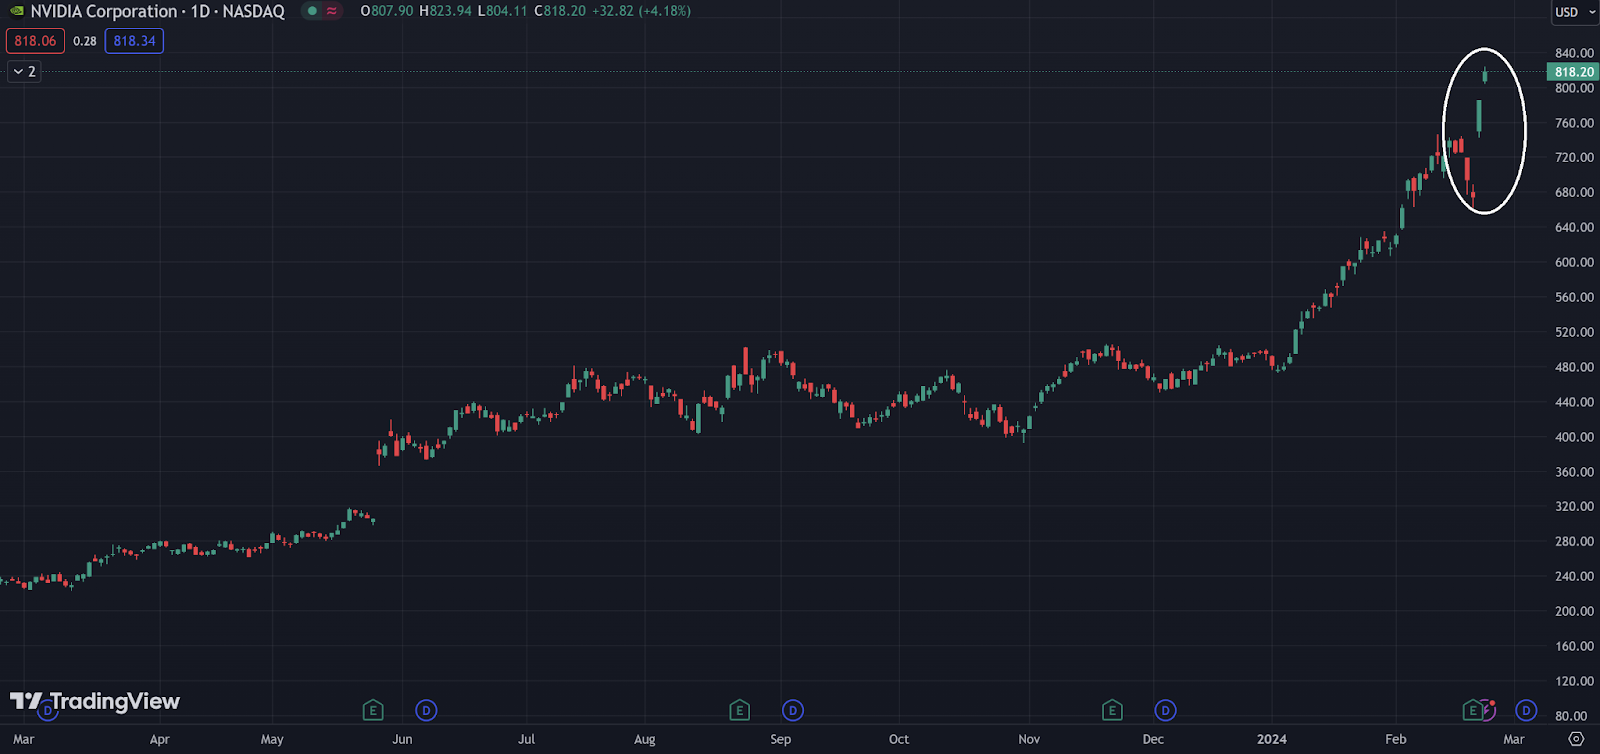
One big reason for that is undoubtedly Nvidia, whose fourth-quarter earnings release late Wednesday blew the already high expectations out of the water – sending its stock surging by 16% in a single day (and the stock gapped up today as well).

Nvidia’s blockbuster earnings lifted the sentiment of the entire market, delaying a pullback that had only just begun.

But make no mistake, I still firmly believe the market will enter a real pullback soon.

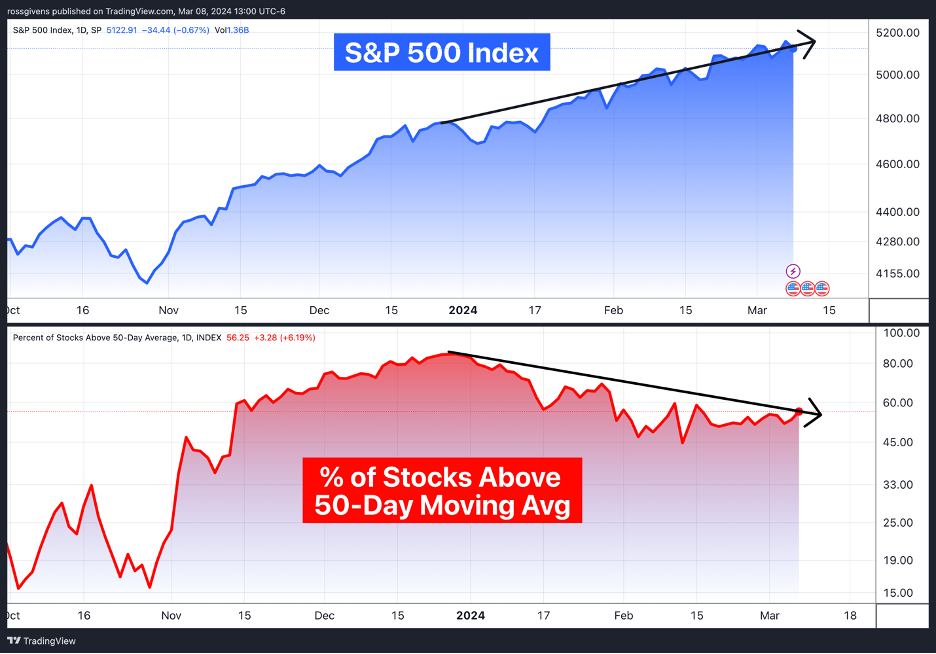
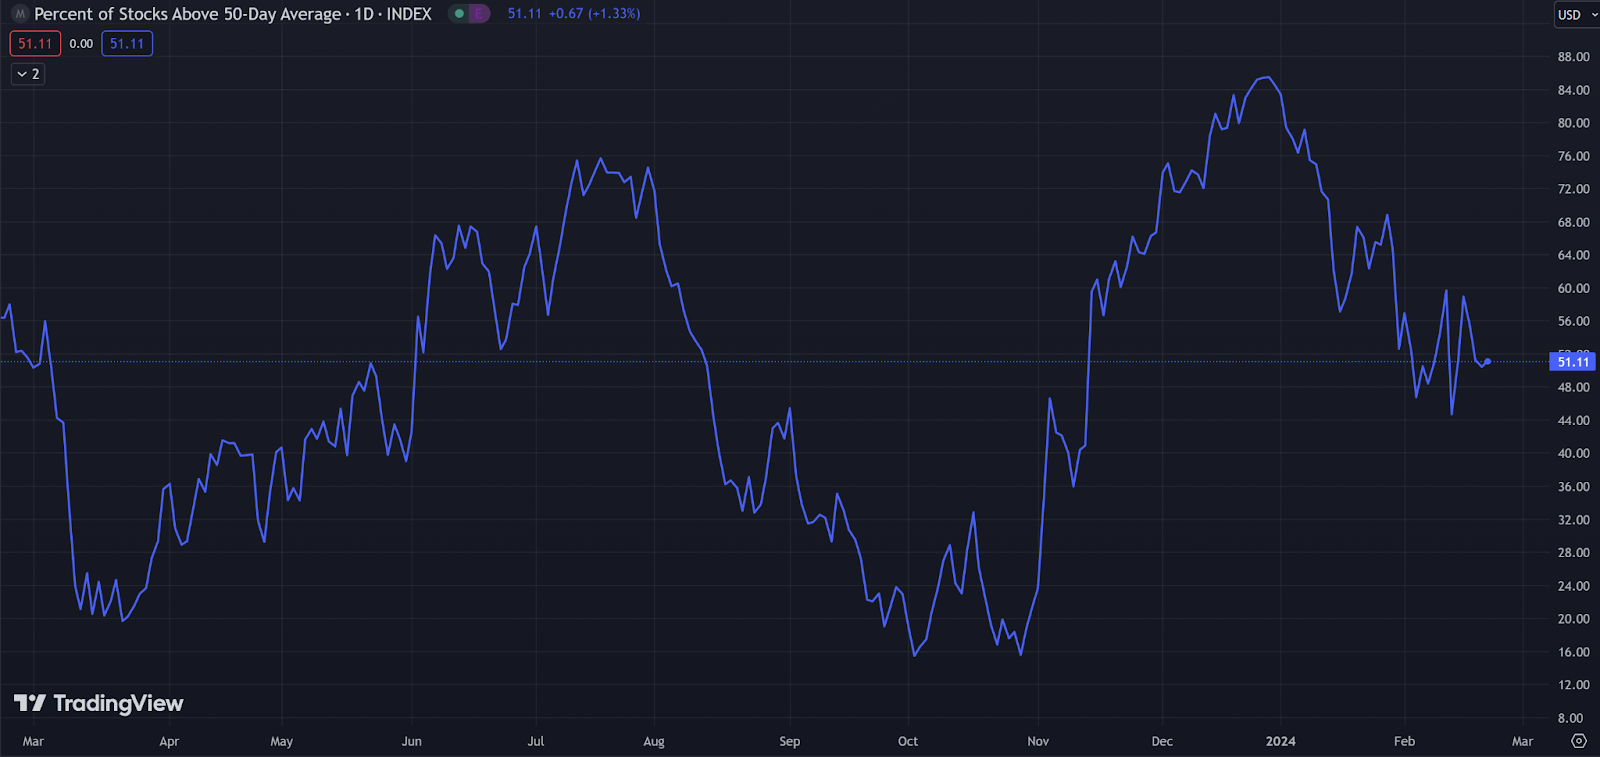
The divergence between market performance and market breadth I’ve been highlighting is still there.

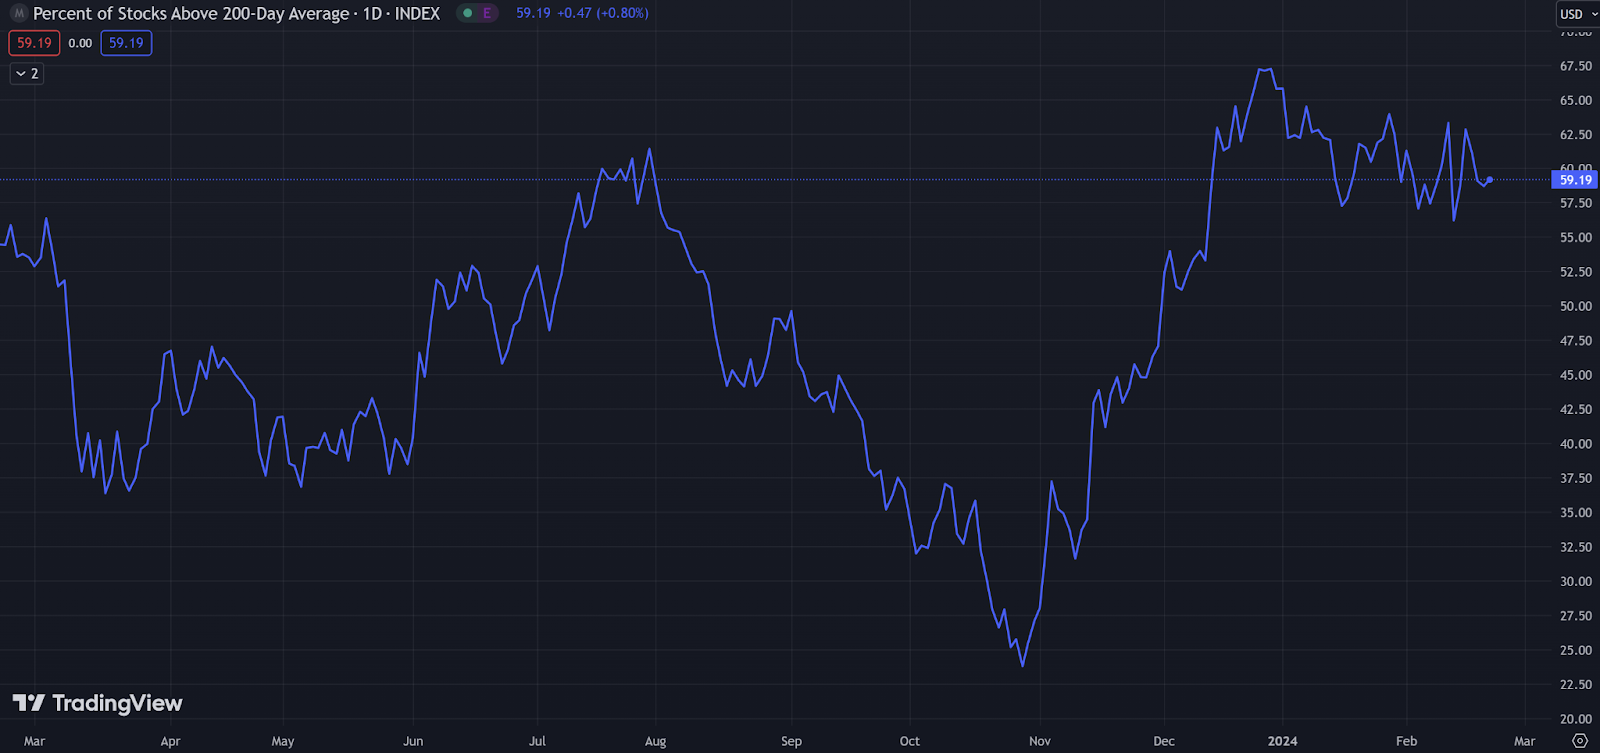
Only 51% of stocks above their 50-day moving average, and only 59% of stocks are above their 200-day moving average. Those figures have fallen significantly since late December – and yet the major indexes are at new record highs.

For the rally to be sustainable, we’ll need to see much stronger participation than this.

The question is – when the pullback comes, how long and how painful will it be? That is something no one can predict (and if they tell you they can, they’re lying).

Same thing with when the pullback will actually hit – no one can tell. 

But as famed trader Walter Deemer says, the most bullish thing the market can do is keep going up. And that may very well happen.

That’s why the theme of this update is Striking the Balance. What’s the balance between expecting a pullback – and participating in a rally that just won’t quit?

Before I answer that, let me get clear that I firmly believe that the coming pullback  will be a healthy one (even if it probably won’t seem so when you’re in it).

Let’s quickly go over the reasons why.

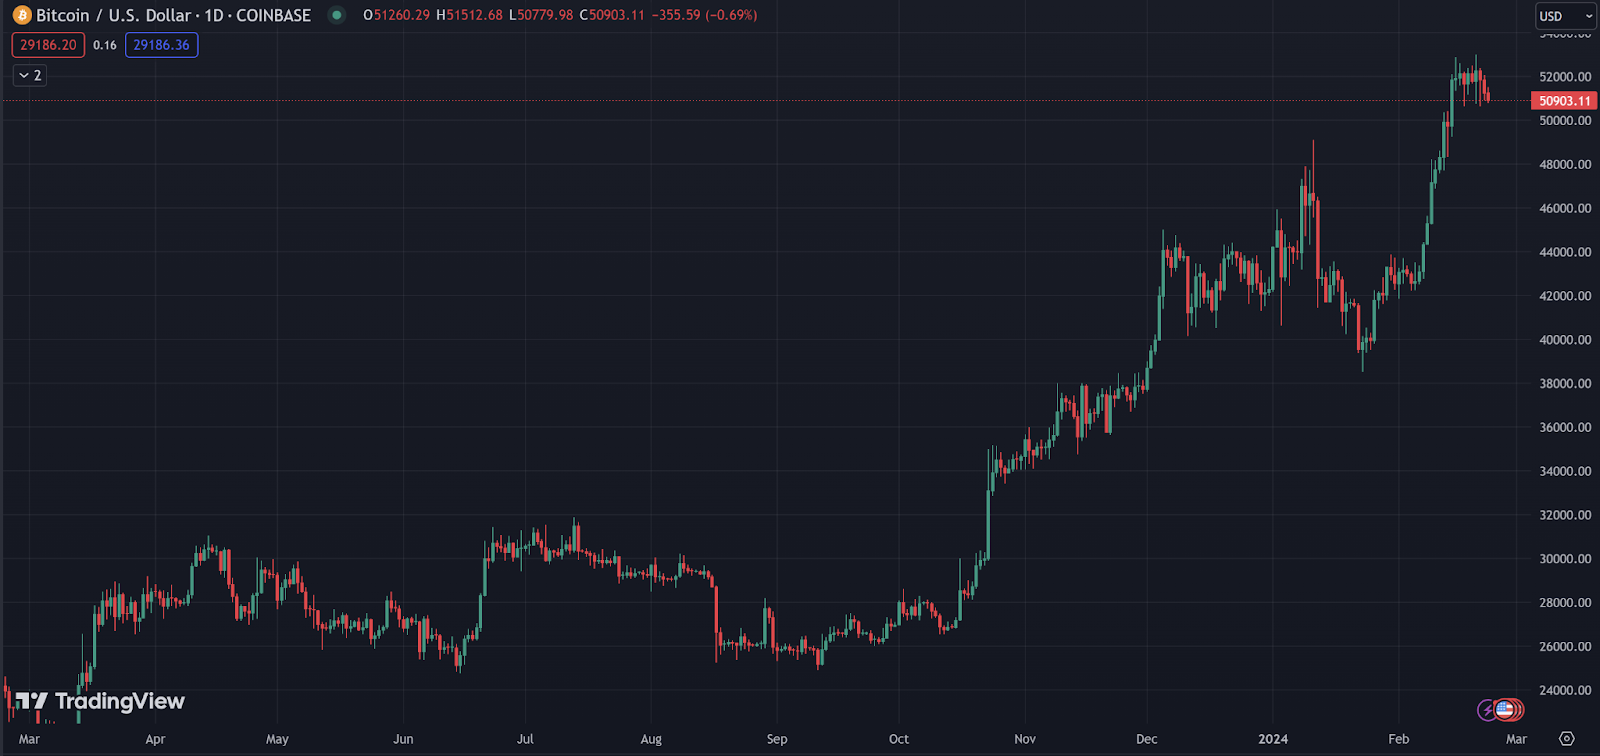
First, the market mood is still very much “risk on”. And to gauge that, we can look at the performance of Bitcoin, one of the most speculative asset classes there is.

Second is the AI factor. Nvidia has shown that it’s much more than just hype – but something that’s being backed up by actual dollars. And we’re still in the early days.

Third is the coming Fed rate cuts. Yes, it’s true that many traders have overestimated how quickly these rate cuts are likely to occur – especially in light of the latest inflation data (in fact, this overestimation is one of the reasons the market will likely pull back soon).

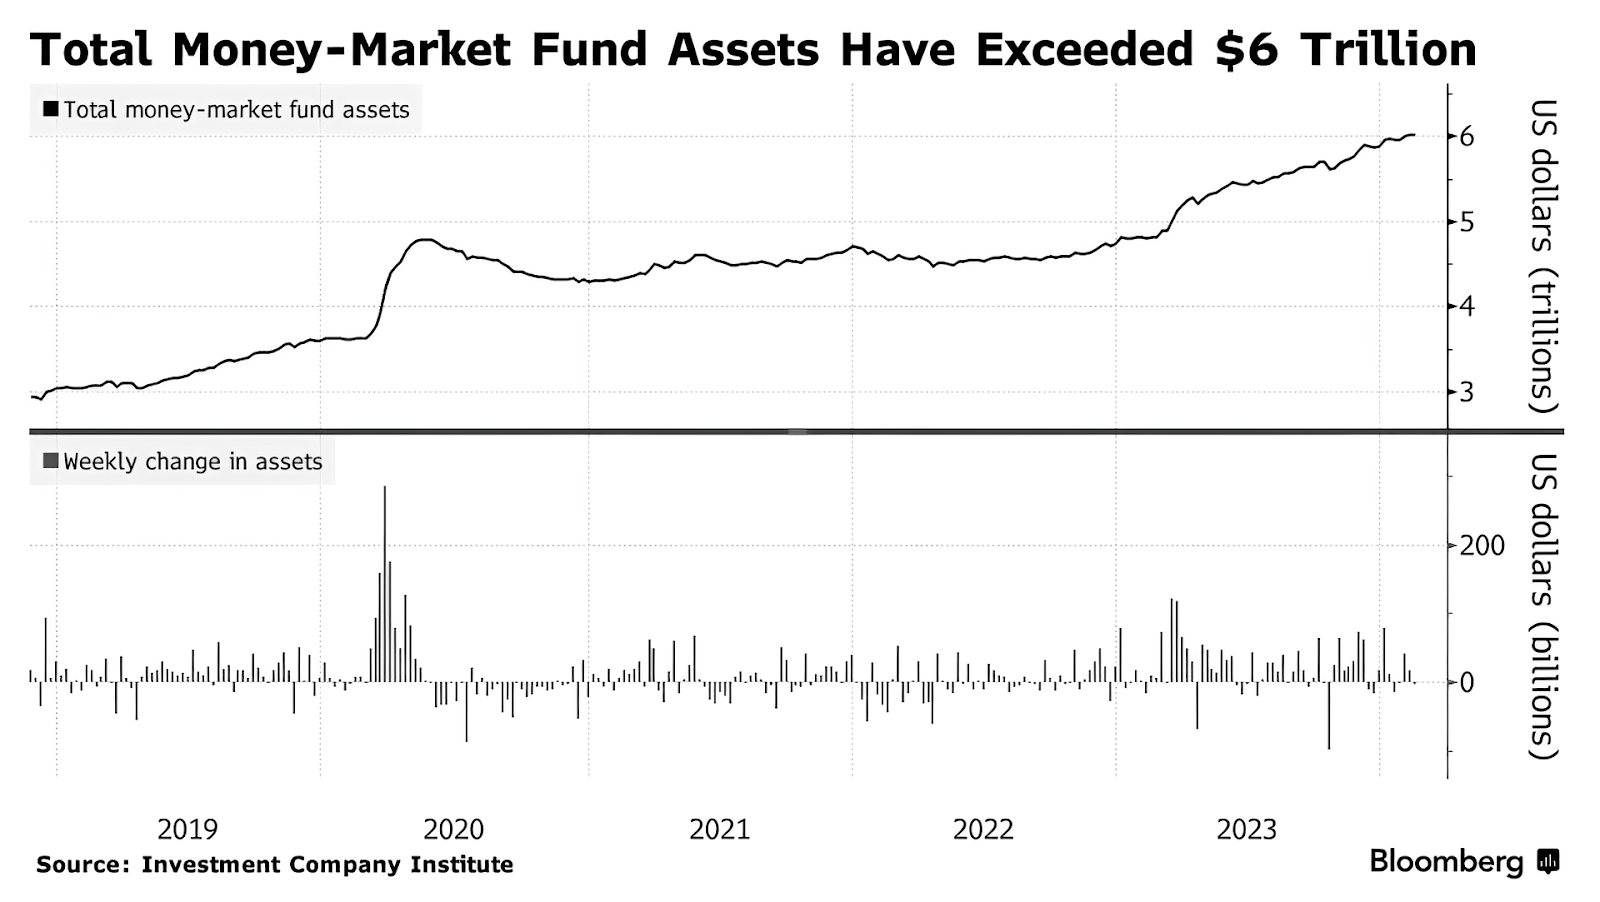
And fourth is the fact that there is still over $6 trillion parked in money market funds – money sitting on the sidelines that can easily fuel the next big leg up.

So, coming back to the question of striking the balance between expecting a pullback and participating in the rally…

The important thing to remember here is that individual stocks – and even individual sectors – are not the market. The market is just a composite of them all.

Navigating this balance means going beyond the surface and searching for specific areas of strength – regardless of what the broader market is doing.

These areas of strength are where you’ll find the market leaders – the stocks that are likely to break out ahead of the market.

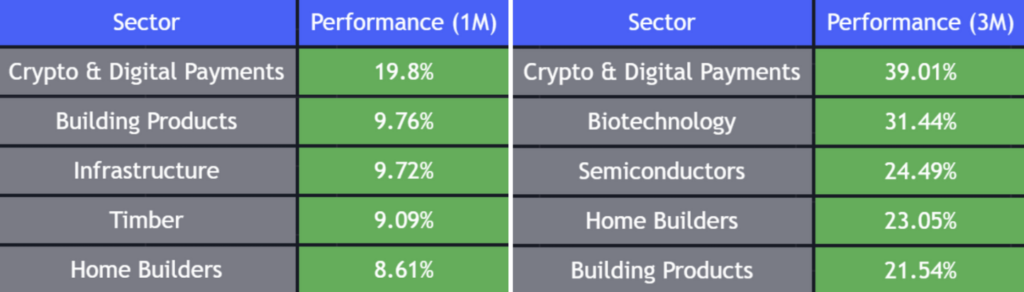
As for where to find these areas of strength, well, that’s one of the reasons I built our Industry Strength Gauge.

As you can see, crypto and digital payment companies are still leading the pack.

So that’s where I’ll be focusing a lot of my research in the coming weeks. I’ll be scanning for my trusted setups – looking for signs of institutional buying that signal high-percentage breakouts.

I’ll keep you informed. Have a good weekend ahead.

Best wishes for your trading,

Ross Givens

Weekly Update: The Crucial Role of Volume

Good evening, and welcome to this week’s edition of Stealth Trades!

In last week’s email, we talked about buying stocks on pullbacks. I outlined two methods of buying stocks on temporary weakness from low risk buy points.

If you missed it, check your inbox for a January 26 email titled “Weekly Update: How to Buy Stocks on Pullbacks.”

Today I want to add to that discussion by adding another element to the equation – volume.

Volume is one of the most overlooked indicators for traders. Learn to interpret it, and you can decipher what is really happening beneath the surface.

Remember that institutions are what moves prices. Multi-billion-dollar hedge funds, mutual funds, ETFs, pension funds and other large players are the ones whose buying and selling actions push stocks up and down.

So, when a stock is rallying on above-average volume, it usually means big players are behind the rally. And they don’t buy for a day or two. It usually takes them weeks or months to build their positions.

The same is true on the downside…

Let’s say a stock fell 10% last week. If this took place on huge volume, the big boys are getting out and you should probably do the same. If the same 10% decline occurred on BELOW average volume, however, this is likely retail selling or normal fund rebalancing.

All things being equal, a stock pulling back on the lightest volume is the one you want to buy.

Take a look at this chart…

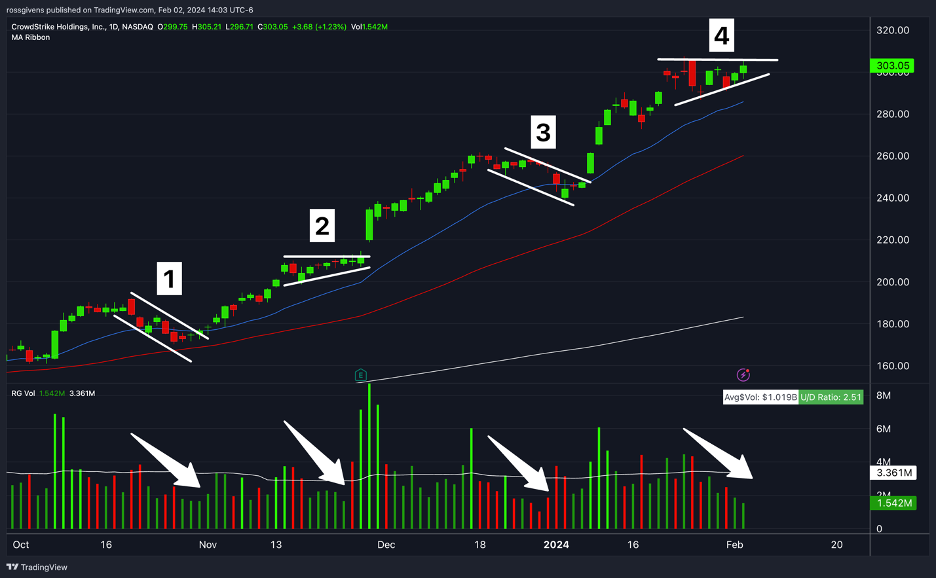
This is CrowdStrike Holdings (CRWD) stock from October through today. I have marked up the pullbacks and consolidation periods.

At Point 1, the stock pulled back 11% over a two-week period. But look at the volume graph below where I have drawn an arrow…

Notice how the decline took place on below-average volume. If you are looking for a place to buy or add on to an existing position, this is the place to do it – right between the 21 and 50-day moving averages after a low volume retracement.

The stock quickly rebounded and climbed 20% over the next two weeks.

Point 2 is more of a consolidation than a pullback. This is an area where price action compresses, the range becomes tight, and again we see volume well below its average level.

Profit taking is minimal. No one is selling and the stock is becoming harder to buy. Once CRWD broke out, it quickly rallied another 22%.

Point 3 is similar to the pullback at Point 1 – a shallow 8% decline over 2-3 weeks on very minimal volume. The stock dipped to the 21-day EMA, found buyers, then tacked on another 26% move to the upside.

That brings us to today…

Here, at Point 4, we see very similar action to what we saw at Point 2 back in November – tightening price action, a narrow range, and volume drying up.

And while nothing is guaranteed, this stock looks poised for another leg higher.

Volume is a crucial component of my stock analysis. If the price chart looks good but the volume graph doesn’t confirm, I have learned it is best not to take the trade.

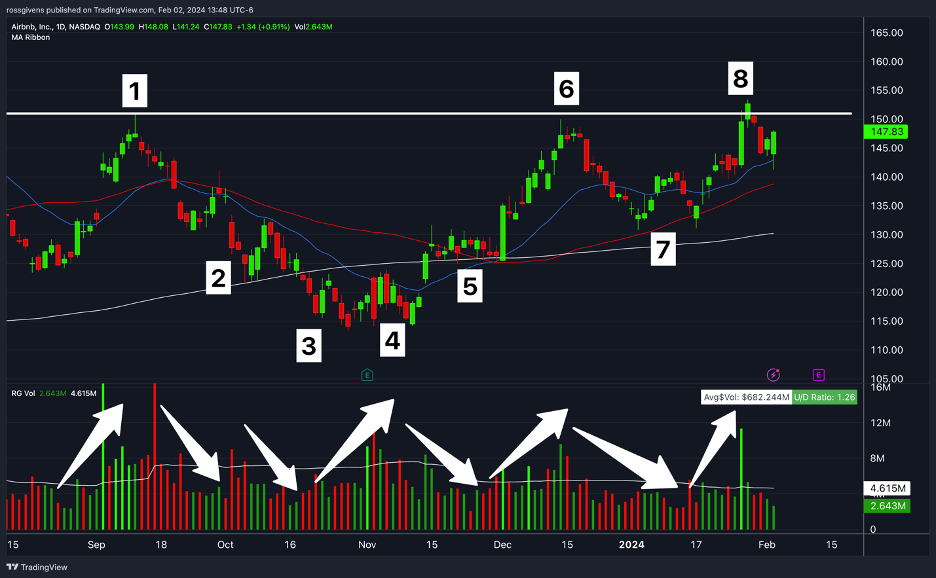
I analyze breakout trades the same way. Here is a chart of Airbnb (ABNB) stock over the last six months:

We can see the shallowing action as the stock tightens up from left to right. This is textbook pre-breakout action. And volume confirms the story…

The initial rally into Point 1 took place on high volume. The pullbacks at Points 2 and 3 occurred on lighter action. Then volume picked up at Point 4 as the stock formed a bottom – a sign that buyers are stepping in and supporting the stock.

This was followed by a low-volume consolidation (Point 5), a high-volume rally (Point 6), and so on.

Volume can also signal the start of new trends.

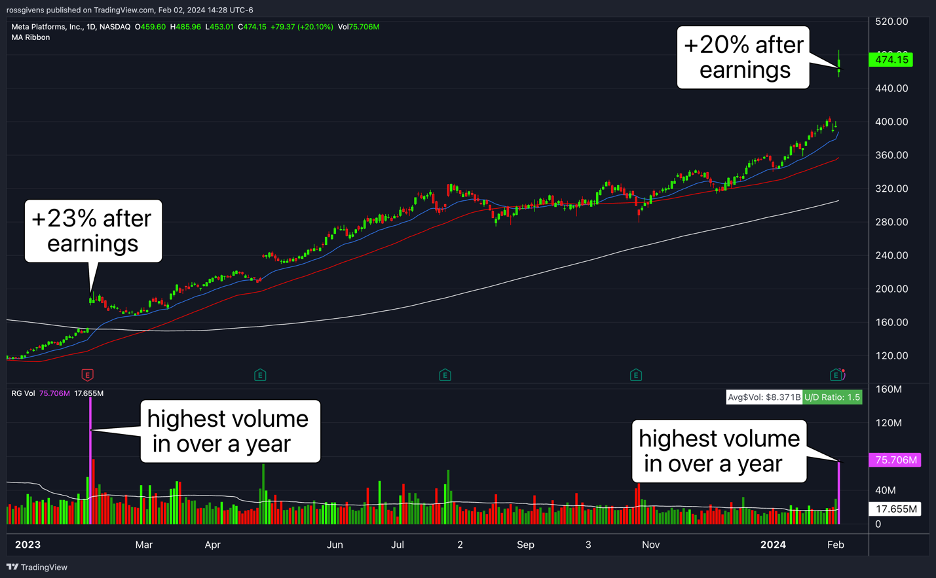
In fact, we may have just seen one such occurrence today in Meta Platforms (META).

The social media giant announced better-than-expected earnings and revenue, along with its first-ever dividend and a $50 billion stock buyback program. Shares surged 20% on the news.

The last time this happened?

One year ago to the day… and it triggered a 150% move.

A 20% post-earnings move on the highest daily trading volume in a year… looks kind of familiar, huh?

Trading does not need to be overly complicated. I’ve known traders with so many indicators on their charts you couldn’t even tell what the price was.

Keep things simple – price, volume, and a couple of moving averages to serve as guideposts. There’s no magic indicator. But volume is probably the closest thing to it.

Best wishes for your trading,

Weekly Update: How to Buy Stocks on Pullbacks

Good evening, and welcome to this week’s edition of Stealth Trades!

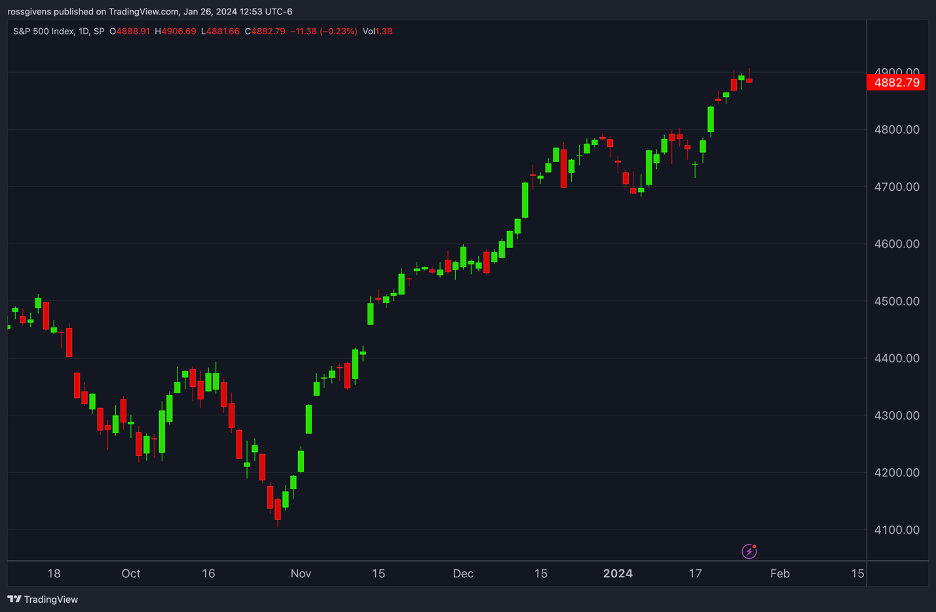
The bull market rages on. The Dow, Nasdaq and S&P 500 indexes made new all-time highs for the second week in a row.

We have been preparing members for this move for months. If you followed our advice, you are fully invested and enjoying the fruits of your diligence.

But if you still have cash waiting to be deployed, the best way to do so is to buy on pullbacks. And in this week’s newsletter, I want to give you a crash course on how to do that.

Pullback buying is different from buying a breakout. What you want to find is a key level that is likely to support prices where buyers are prone to step in.

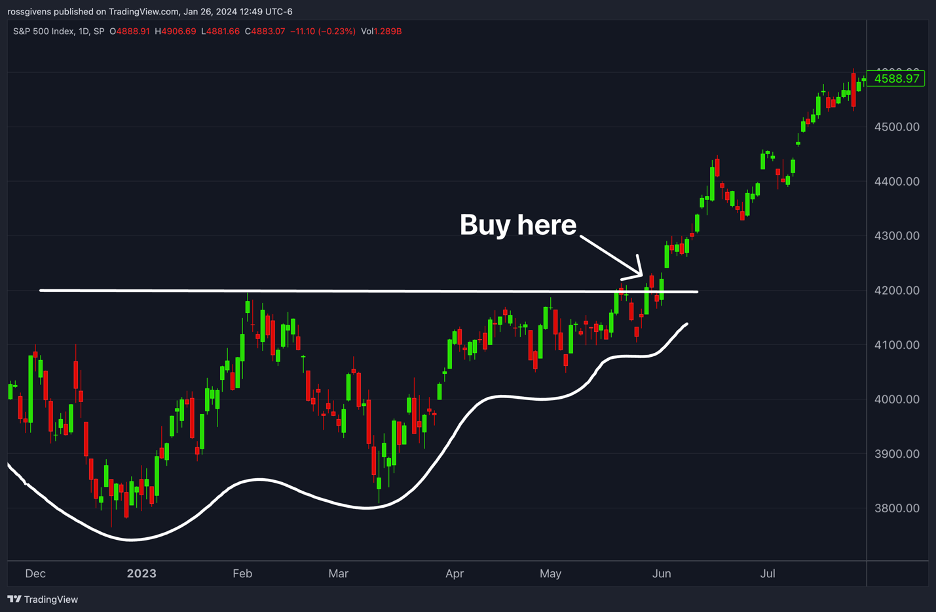
When the S&P 500 set up in a breakout pattern last year, it was actually less risky to buy a new high since this meant the consolidation was over (see chart below).

But today stocks are making new highs. So, you’ll want to take a different approach.

There are two places to buy pullbacks – moving averages and support levels. Let’s start with moving averages since this is the simplest method.

Stocks that trend well, especially large cap stocks, tend to find support at one of their key moving averages on the way up.

The two I watch are the 21-day exponential and 50-day simple moving average.

For very strong stocks – those rising 15-20% per month – I like to buy on pullbacks to the 21-day. Below is a daily chart of Zscaler (ZS), a leading cloud-based cybersecurity stock.

Notice how the 21-day EMA (blue line on chart) “supports” the stock price on the way up. Any touch of this line is typically a good place to buy during a strong trend.

We saw the same thing with CrowdStrike (CRWD) – another leading software stock.

For slower-moving stocks – those going up 5-10% per month – I like to watch for pullbacks to the 50-day moving average.

This is a heavily defended level in Stage 2 uptrends where we typically see institutional buying.

This is Microsoft (MSFT) during the powerful run it made in the 2nd quarter last year:

Notice how support is found at the 50-day moving average (red line) each time it is hit.

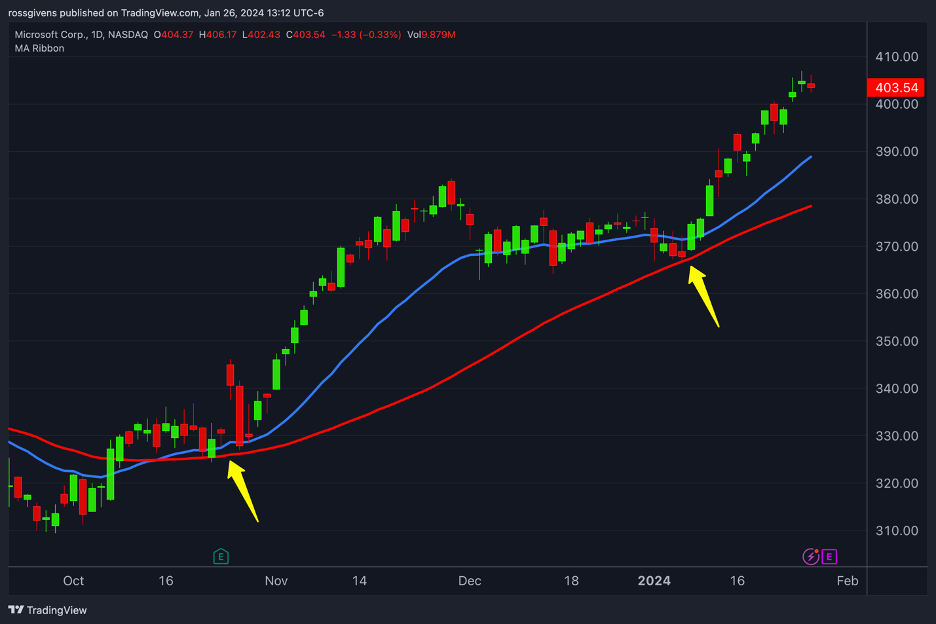
We can see the same thing in the current rally taking place in Microsoft (MSFT) today:

For large, blue-chip stocks, the 50-day moving average is by far my favorite place to buy during trends. If a stock cannot hold its 50-day, it is likely in trouble and not experiencing the kind of institutional buying that leads to large moves.

So that’s the quick and easy way. Look for leading stocks in strong trends and buy on pullbacks to the 21 or 50-day moving average depending on how rapidly the price is rising.

If you are unsure which to use, just split the difference and try to buy between the two. You don’t need to risk more than about 15%. When bought at proper support, the stock should reverse soon and resume its uptrend.

The other place to buy pullbacks is at previous support and resistance zones. This works on both individual stocks and indexes.

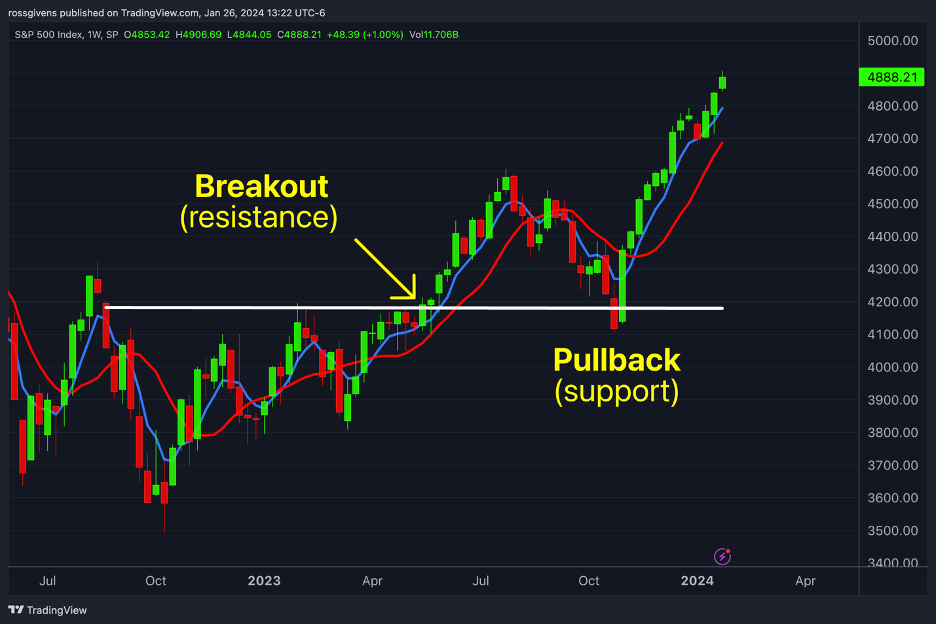
Below is a weekly chart of the S&P 500 index:

Notice the initial breakout in April of last year that we discussed earlier. This was a resistance level the market could not get above.

The rally that followed handed us big gains before running out steam and pulling back. Where it stopped, however, was not a coincidence.

What was resistance often becomes support, and this became a powerful support level where investors could buy the pullback. You may remember this setup when I pointed it out in October – the week before this huge rally began.

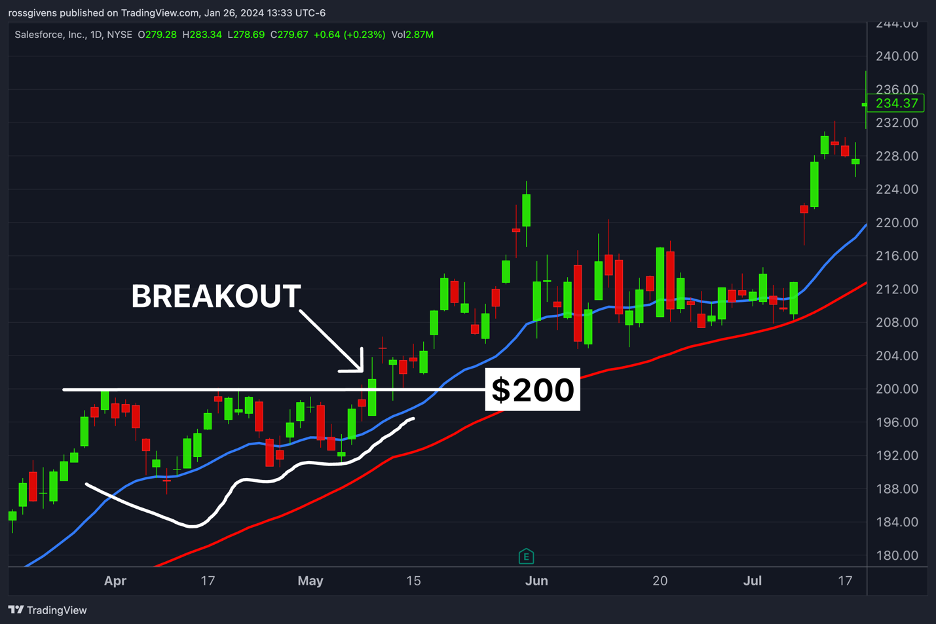
You will find this same approach useful for individual stocks. Let’s take Salesforce (CRM) for example…

Here you can see a clean breakout entry from May of last year at the $200 level.

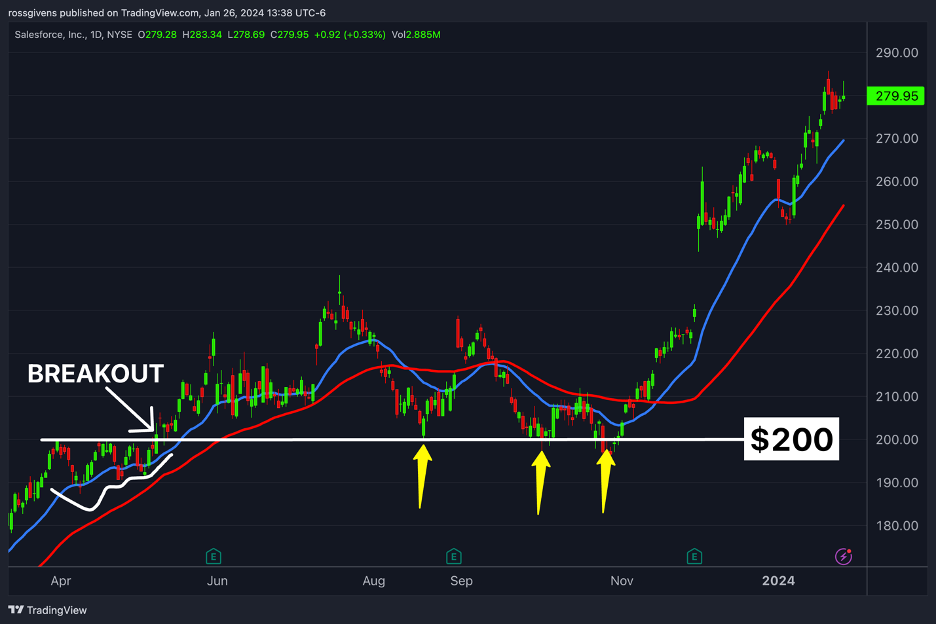
Now look what has happened since:

This $200 resistance level then served as support and created three great buying opportunities before the next rally higher.

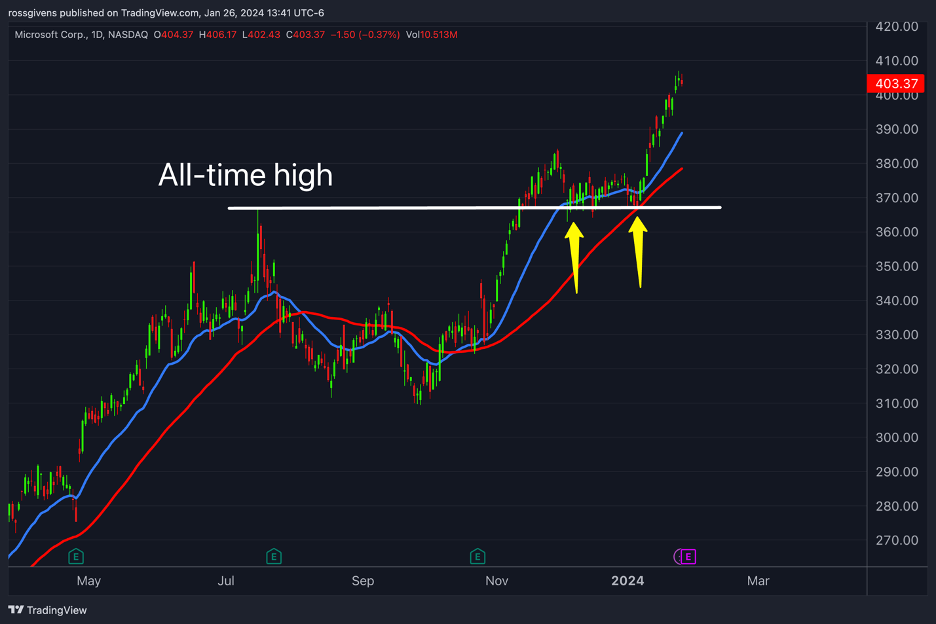
Previous highs or lows can also serve as future pullback buy areas. In the daily chart of Microsoft (MSFT) below, we see the all-time high it made back in July.

Six months later, after the stock had surpassed this level, it became a new area of support and a great place to buy on a pullback.

This time, it coincided with the 21 and 50-day moving averages.

Three levels of support at the same price on a market-leading stock during a bull market? That’s a buy signal all day long.

These simple techniques will help you buy pullbacks at areas with the least amount of risk and the greatest chance of a quick bounce higher.

There are other things to watch for to make this approach even more effective…

One trick is to buy low volume pullbacks after high-volume moves higher. This is another clue that selling is light and institutions are still in control.

But we can dive into that another day.

Best wishes for your trading,

Weekly Update: The Markets are Stalling at the Highs

The markets are stalling at the highs.

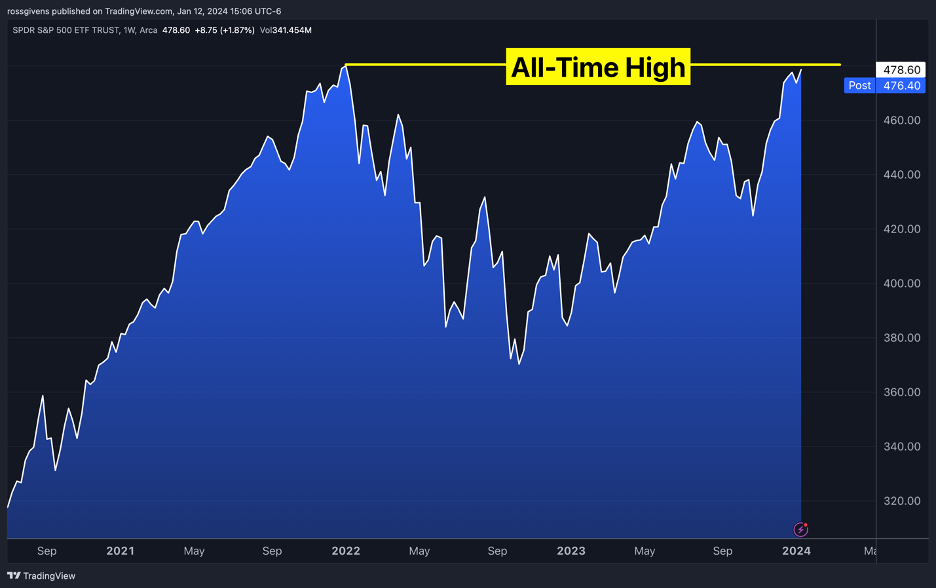
Stocks advanced this week, erasing last week’s losses and sending the major indexes back to all-time highs.

This is about what we were expecting. Markets have now been range bound for four weeks which, as I have discussed previously, is healthy price action.

The November/December rally was one of the strongest on record. A move like that must be absorbed to flush out the sellers, allow for natural profit-taking, and set up the next advance higher.

The S&P 500 and Nasdaq indexes are both sitting at their all-time highs from late 2021 – a natural place where we would expect to see a pause.

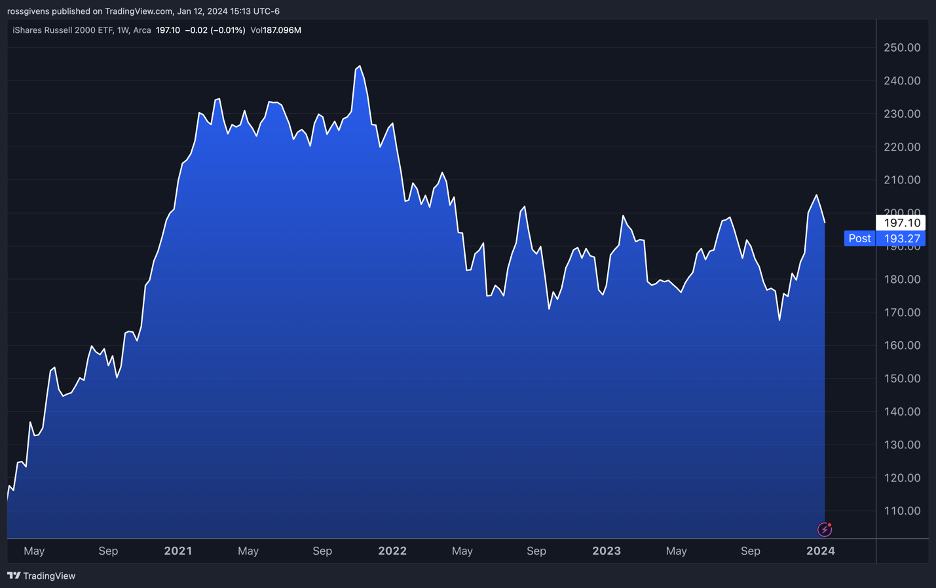
The Russell 2000 small cap index shown below has the most ground to make up before reaching new high ground.

I still expect small caps to outperform in 2024, and I have allocated my retirement accounts accordingly.

The homebuilding sector along with biotechs continue to show the most relative strength. But another group is again marching to the top of the pack…

Back in November, we highlighted the nuclear and uranium sector as a standout in terms of performance.

Based on this, we bought Cameco (CCJ) and enCore Energy (EU) – two leading nuclear stocks that were breaking out from consolidation patterns.

Both delivered stellar returns.

The sector pulled back in December, but we are again seeing these stocks advance higher. Both of the names I just mentioned made new highs on Friday.

I keep a Nuclear/Uranium stock watchlist in TradingView. There are 24 names on it.

If you want to create your own watchlist for this sector, here are the ticker symbols: CCJ, UUUU, DNN, LEU, UEC, URG, BOE, PDN, BMN, UROY, NXE, SMR, BHP, CVV, AMLI, LTBR, CEG, NRG, FCU, UCLE, MGA, ISO, BWXT, and BKY.

Most of these are US stocks, but a few trade on foreign exchanges. They also range from small to large in terms of market capitalization.

I did a quick scan of the charts and here are my favorites right now:

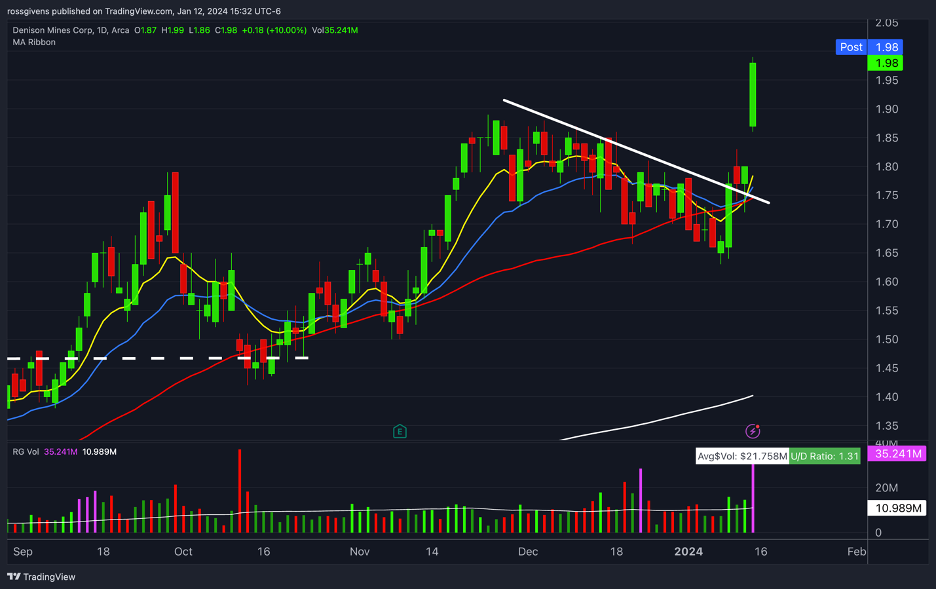
Denison Mines (DNN)

Dennison broke through its downtrend line with conviction on Friday. Shares finished up 10% on the day, closed at the high of the daily candle, and made a new 52-week high on the highest volume in over a year.

This is a clear sign of institutional buying.

The stock also pulled back quietly in December, giving up minimal ground and showing no signs of heavy liquidation.

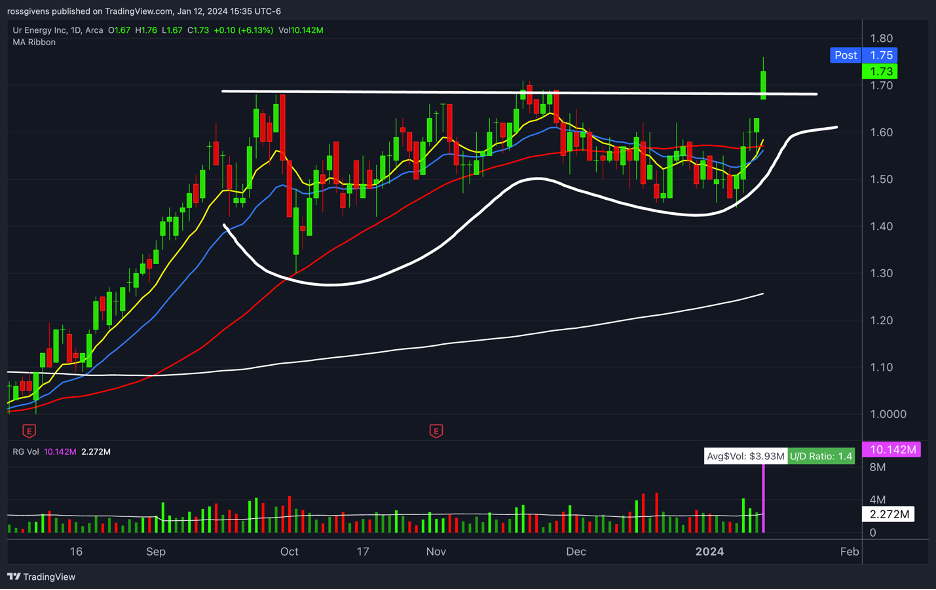
Ur Energy (URG)

URG also broke out on record volume Friday.

After a beautiful uptrend from July through September that saw shares advance 77% in as many days, the stock has been consolidating for the last three months.

Friday’s move to new highs could be the ignition URG has been needing to resume its rally.

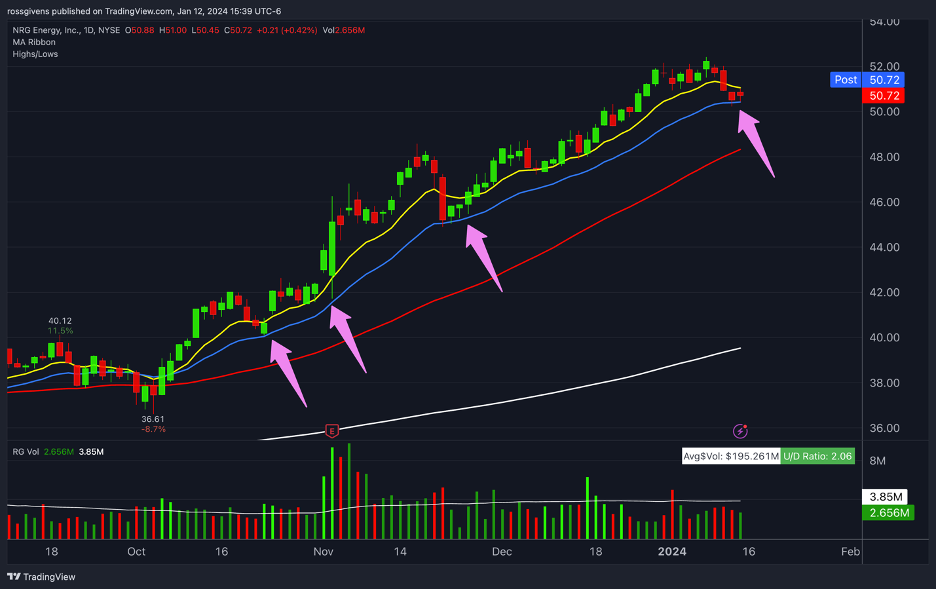
NRG Energy (NRG)

With a market cap of $11.4 billion, NRG is one of the larger stocks in the group. Because of that, it is much less volatile and has shown to trend more steadily.

As of today’s close, the stock is sitting on its 21-day moving average. This has been a support level for NRG throughout this move, making this an ideal buy point on the pullback.

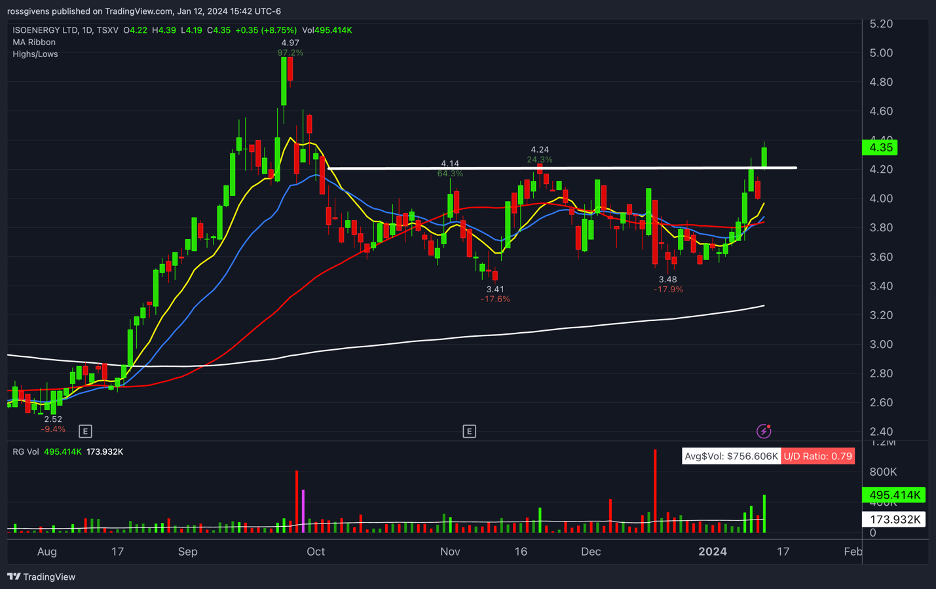
IsoEnergy (ISO)

ISO is a small-cap uranium mining company based in Saskatoon, Canada.

Like some of the other names in this group, the stock has been consolidating for the last few months. Friday’s high-volume move broke through the pivot level, signaling that the market has finally worked through supply.

If this uptrend in uranium stocks continues as expected, ISO could see a substantial move higher in a short amount of time.

Best wishes for your trading,

Weekly Update: The Market Pullback is a Good Thing

Good evening, and welcome to this week’s edition of Stealth Trades!

The market pulled back in the first trading week of the year.

That is a good thing.

We all love when stocks go up. But if they go straight up for too long, it is only a matter of time before prices correct harshly.

Stocks went up in 8 of the last 9 weeks. That is almost unheard of. The market needs time to digest this rally, absorb the sellers, and set up for the next move higher.

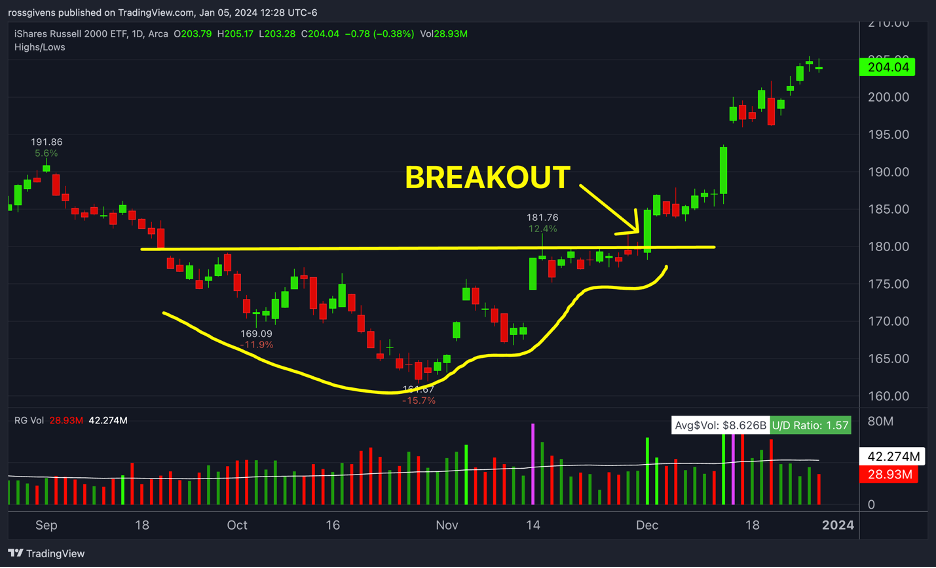
The best gains come from clean breakouts out of shallowing compression patterns. This is my go-to chart pattern when looking for institutional buying.

Here was the Russell 2000 index breaking out in December:

This led to huge gains for those who were holding the right stocks in the right sectors.

The process for finding high returns is simple:

  • 1. Strong market
  • 2. Strong group
  • 3. Strong stock

At the start of December, crypto and home construction were the strongest areas of the market. The ETFs representing these groups (BLOK for crypto and ITB for home builders) were up more than their peers.

So this is where we focused our efforts.

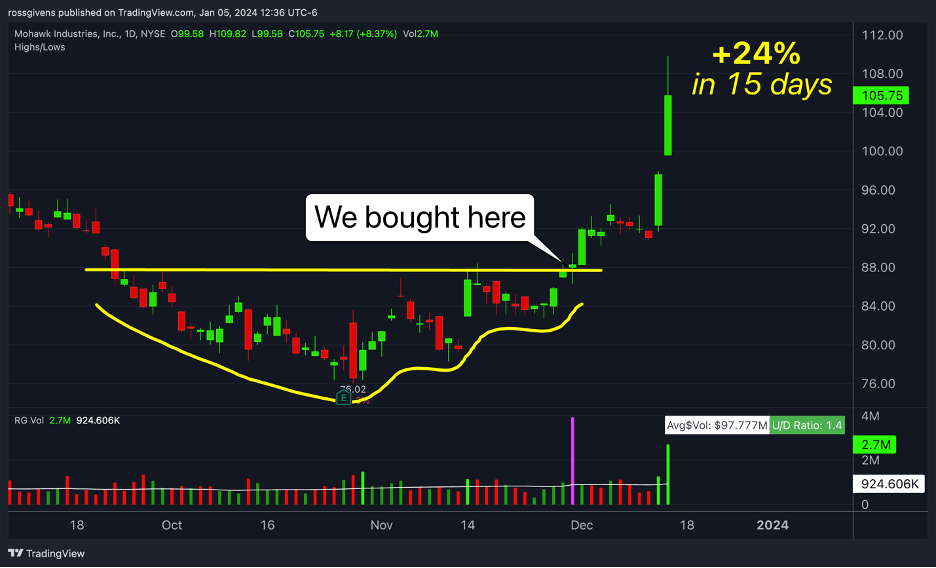
That’s how we knew to buy Mohawk Industries (MHK) – a residential flooring company that was breaking out around the same time:

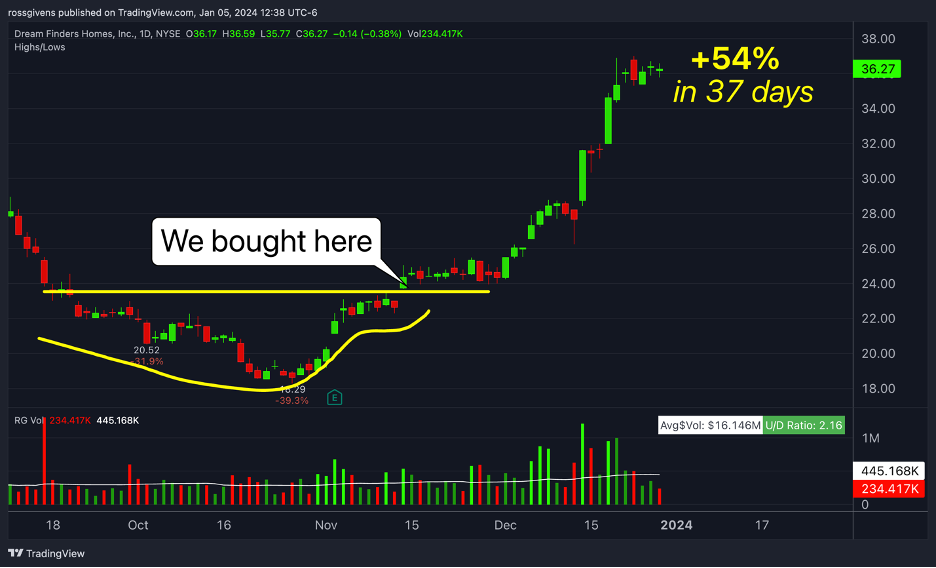
We bought Dream Finders Homes (DFH), a residential home builder, at the same time:

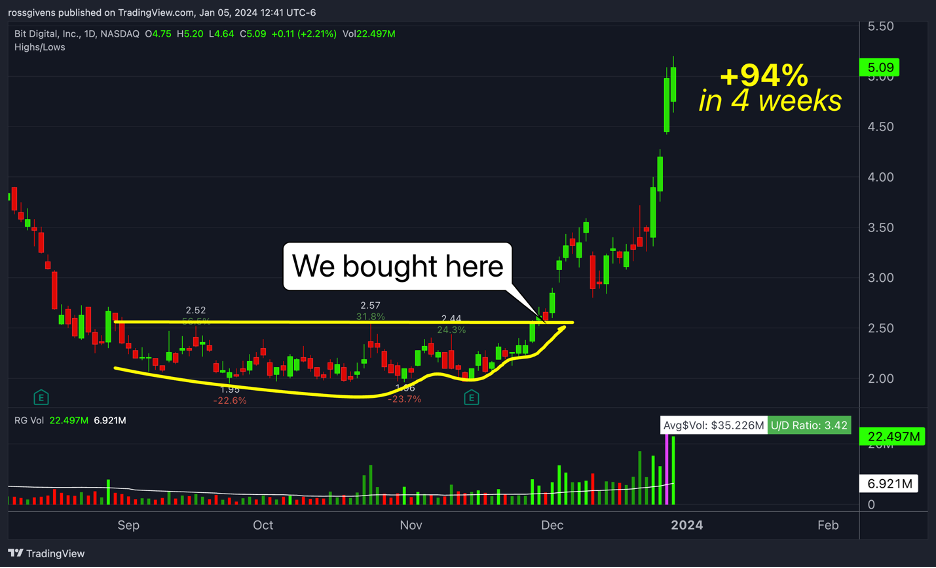
In the crypto sector, we bought Bit Digital (BTBT):

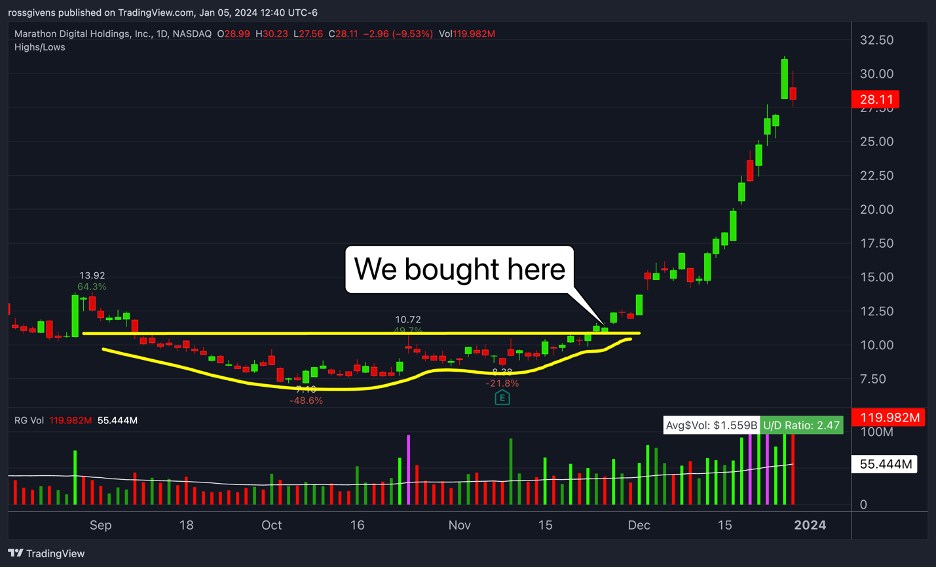
…and Marathon Holdings (MARA):

My process does not change. When the market gives a buy signal, we get aggressive. The top stocks in the top groups are your best bets.

When the market is weak or extended, we trade smaller – still focusing on leading stocks in the top-performing groups.

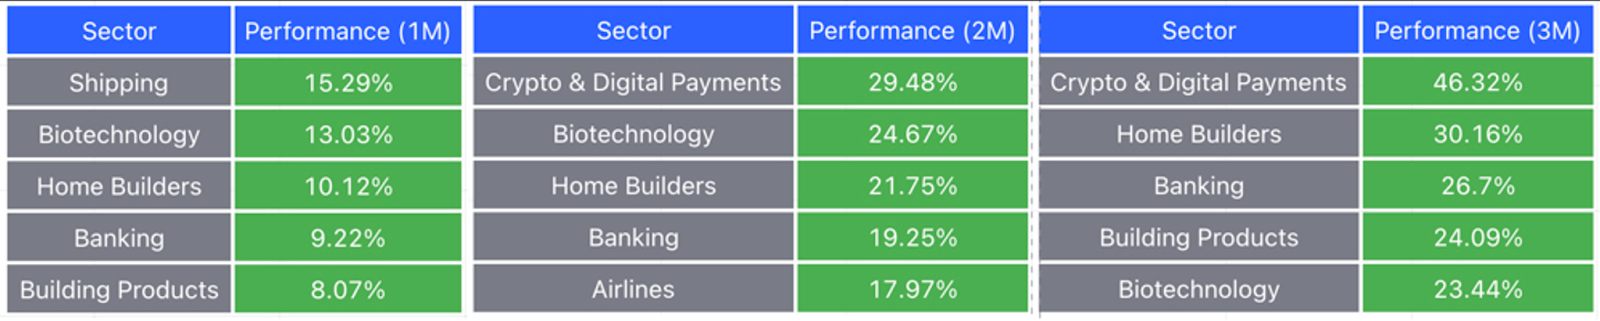
Below is a summary of the top 5 performing groups over the last 1, 2 and 3 months:

Home builders, biotech and banking are currently leading the way with shipping beginning to emerge as a strong performer.

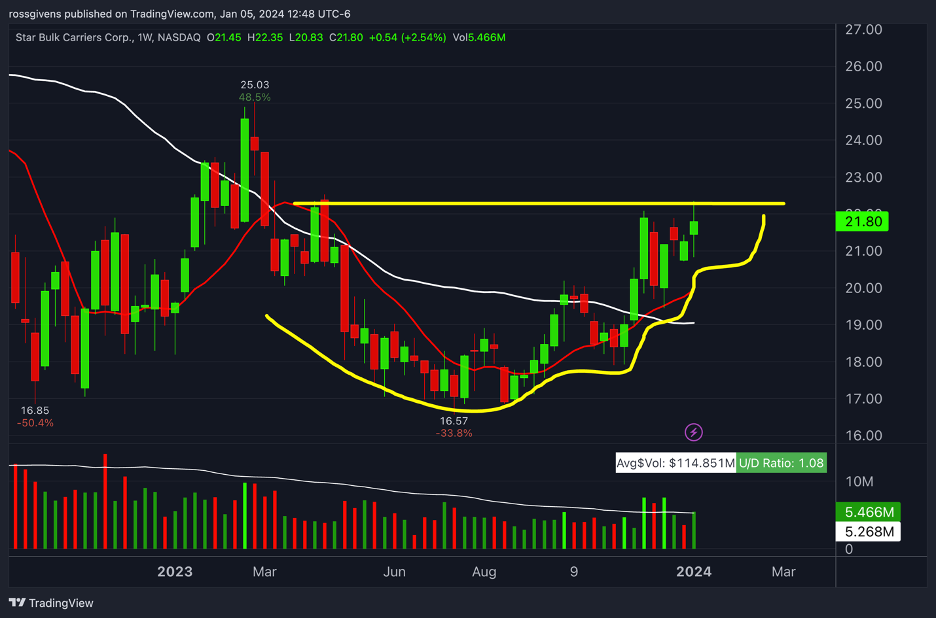
Star Bulk Carriers (SBLK), for example, is beginning to look strong on a weekly chart:

If shipping stocks are being accumulated by institutions, we will see this group continue to outperform and find similar setups in multiple stocks in the sector.

Many groups, like banking for example, are currently extended. We need to see prices consolidate and tighten up before they are ripe for new buys.

We are only one week into 2024. If the bull market we see shaping up plays out as expected, there will be plenty of opportunities to profit this year.

Stay patient. Focus on strength. And demand picture perfect setups before pulling the trigger.

Best wishes for your trading,

Weekly Update: An Interesting Year

It has been an interesting year… 

The Nasdaq Composite index finished 2023 up 43%. Hearing that figure, most would assume it was a raging bull market where investors all made a fortune.

But that was not the case.

Firstly, the indexes had varying performance. While the Nasdaq had its best year since 1999, the others gained far less.

The Dow Jones Industrial index, for example, climbed only 13%. The S&P 500 went up 24%, and the Russell 2000 gained a respectable 15%.

The Nasdaq’s outsized performance was due largely to a small handful of stocks now referred to as the ‘Magnificent Seven.’ Apple, Amazon, Alphabet, Microsoft, Nvidia, Tesla, and Meta all saw huge gains which were largely just recoveries from the 2022 bear market. Once stocks began showing progress, institutions piled into these highly liquid former winners and boosted their share prices off the lows.

But that picture is quickly changing.

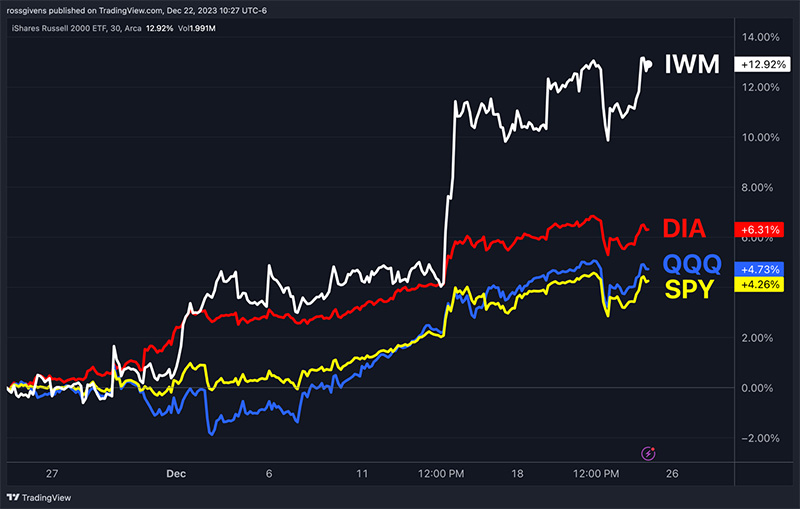
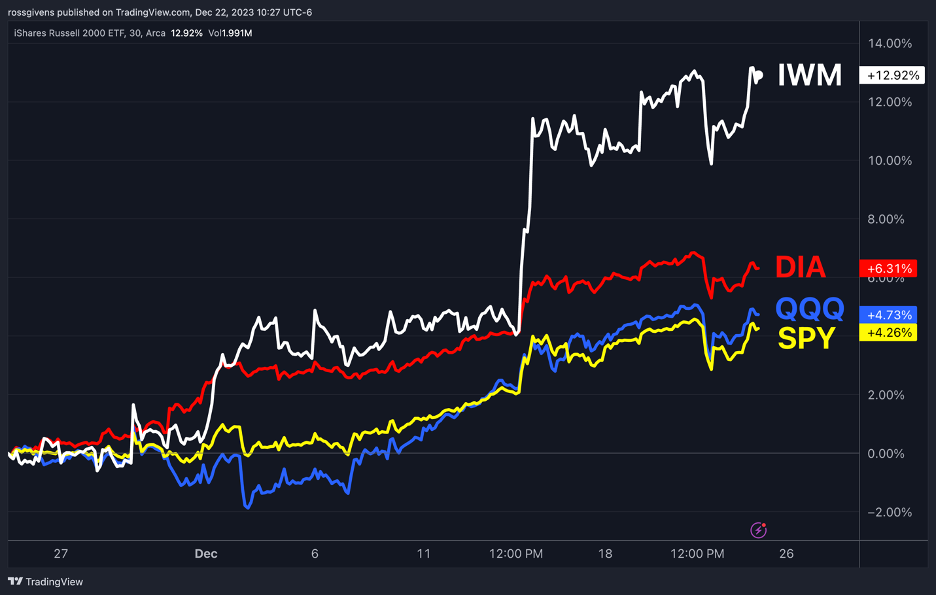
As I pointed out in last week’s update, small cap stocks are now leading the market. The Russell 2000 (IWM) outpaced its large-cap counterparts in December, and I expect this trend to continue.

So where is money flowing into 2024?

Right now, we are seeing four leadership groups emerge. These are the groups and sectors showing clear outperformance where I believe institutional money is flowing.

The first group is construction. I have covered this topic in recent webinars in greater depth, but I am forecasting a large housing boom taking place well into 2024. Price action in the markets is supporting that macro thesis. Homebuilders, building materials, and even basic materials like steel and lumber which are used in construction are all performing well.

The next leadership group is banking. Bank stocks have been surging in the final two months of 2023 and look like they will continue doing so. Rates are falling quickly, and an increase in mortgage demand will likely boost sales and profits as well. Unfortunately, most bank stocks are extremely extended after powerful runs to end the year. Many names in this group are up 30-50% in just the last sixty days. So, I would like to see a pullback or consolidation before most of these names offer clean entry points.

The same is true for the crypto space. The sector is up 55% in just three months leaving most stocks in this group too far extended to buy. Luckily, we bought MARA and BTBT in my Alpha Stocks service when the initial breakout occurred and have pocketed big gains on those trades. We will keep an eye on this space and wait for a good entry point if one is presented.

Finally, the biotech group is showing a lot of relative strength. It is the #2 sector in terms of performance over the last 30 days and in the top 5 over the last three months. There are more than 795 biotech stocks on the major exchanges, so there are going to be both dogs and gems in this group. We will focus on the latter.

Our goal is to be in the best stocks in leading groups and to buy from proper, low-risk setups. For that reason, I have focused recent stock scans on biotech and construction-related stocks. These are strong-performing areas that still have some stocks emerging from constructive basis and offer decent entry points.

Below are a few of the stocks I’m watching:

Biotechs: JANX, MLYS, IMTX, MRVI, PRME, TERN, ALLO, AUPH, BCRX

Housing/Construction: RDFN, MTH, GRBK. TOL, WSM, PLPC, CARR, DHI, MTH

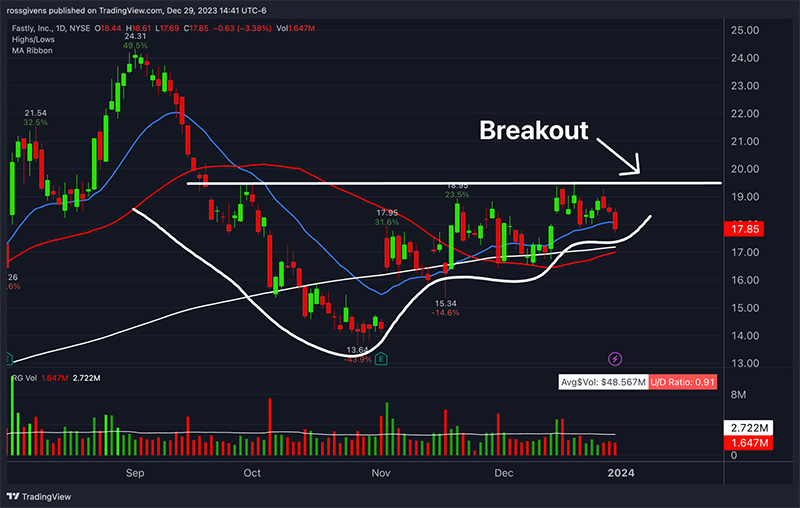
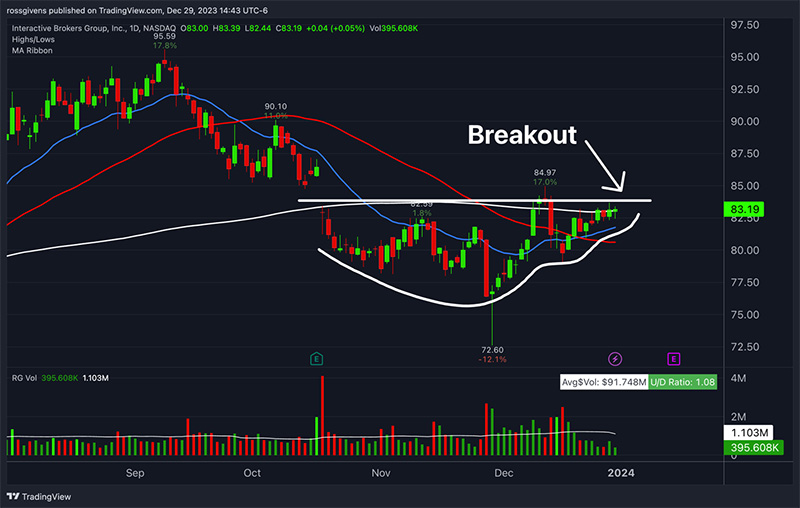
I am also waiting for potential breakouts in Fastly (FSLY):

And Interactive Brokers (IBKR):

2024 is setting up to be a strong year for stocks. And unlike 2023, I do not expect it to be limited to a small handful of mega-cap names.

We are seeing broad participation with 85% of all stocks trading above their 50-day moving averages. And if the Federal Reserve cuts rates as expected, investors could have one of their most profitable years yet.

Happy New Years.

Best wishes for your trading,
Weekly Update: The Bull Market Marches On

Good evening, and welcome to this week’s edition of Stealth Trades!

The bull market marches on.

Investors are having a very Merry Christmas. Stocks delivered another positive week with only the shortened post-Christmas trading week remaining in 2023.

As I have been pointing in the last few weekly updates, the Russell 2000 index continues to lead the market. It tacked on another 2.44% this week for a total gain of 12.93% over the last month – more than double the performance of the S&P and Nasdaq.

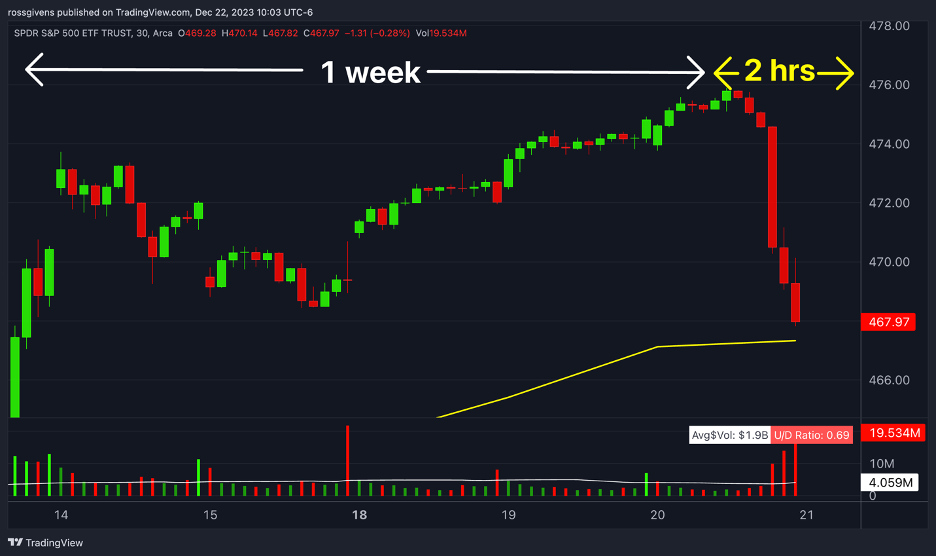
But the real story this week was the Wednesday afternoon selloff.

In the final two hours of the trading day, stocks sold off hard. The Nasdaq index lost 1.7% of its value in 120 minutes.

Some investors panicked. After all, the indexes have not had even a 1% down day in two months. We, on the other hand, did nothing.

And stocks quickly returned to their highs by Friday afternoon.

It is easy to be confident in a bull market when the internal metrics are so strong.

Unlike the rally in the first half of 2023 which was led by only a tiny handful of mega-cap stocks, this one has broad participation. The Russell 2000 small cap index outperforming larger names like Apple, Amazon and Google – traditional “safe haven” stocks where institutions sat for most of the year – is proof of that.

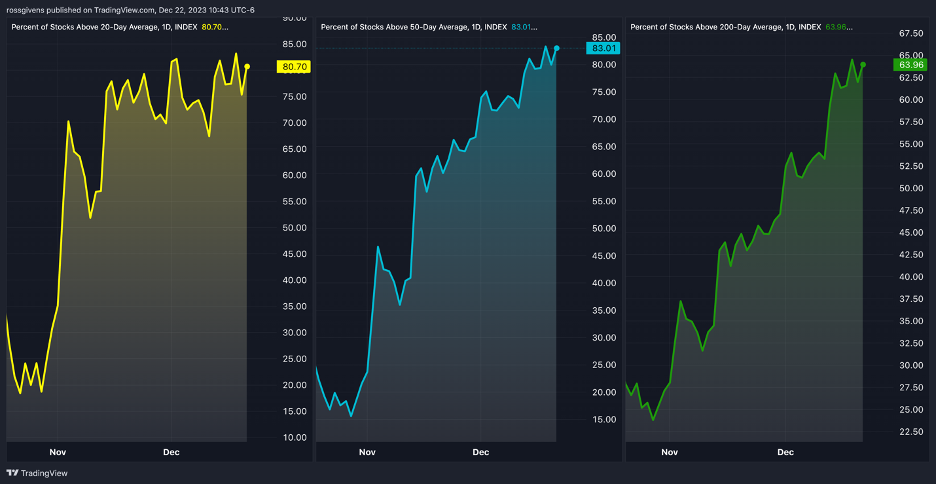
As of this afternoon, a whopping 83% of stocks are above their 50-day moving average. This is a key support level for up trending stocks.

And 80% of stocks are above their 20-day moving average. In other words, 4 out of 5 stocks are in strong up trends.

The chart below shows the percentage of stocks above their 20, 50, and 200-day moving averages respectively.

This is what a healthy bull market looks like. And this is why I want to buy on pullbacks, not sell.

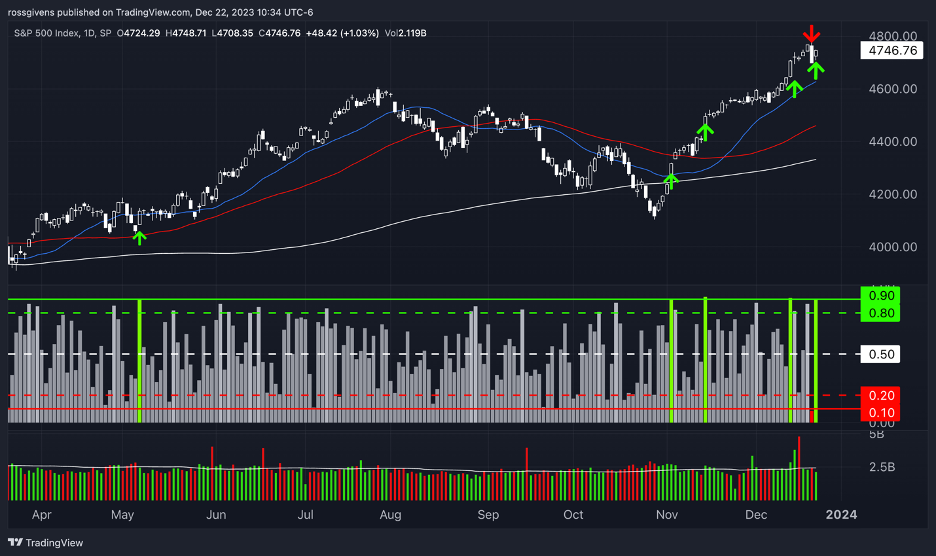
The Wednesday afternoon selloff caused a 90% down volume day. This is when more than 90% of the trading volume occurs on declining stocks. We saw several of these during the 2022 bear market. But Wednesday was the first one we have seen since March.

But markets responded immediately by putting in a 90% UP volume day on Thursday. This is a clear sign that investors are buying into these dips.

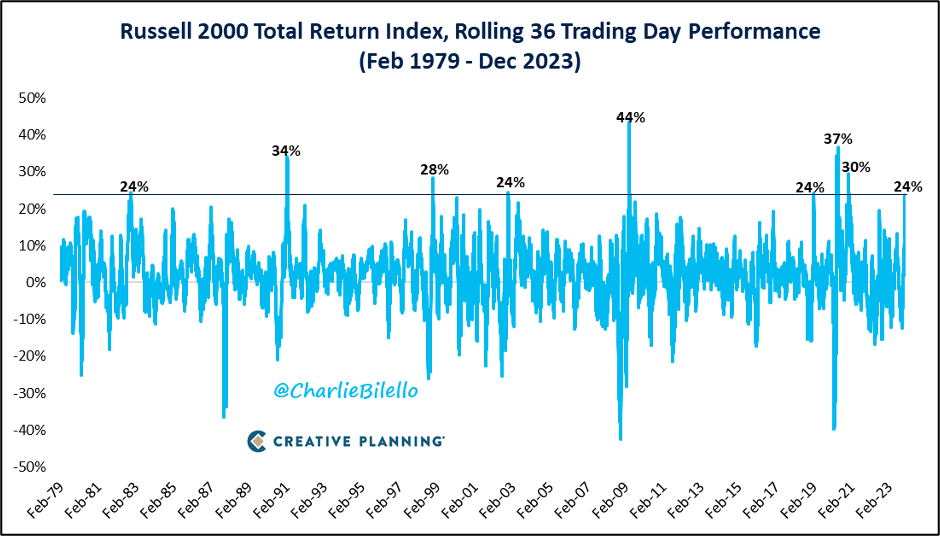
Historically, strong performance leads to more strong performance. Newton’s first law: an object in motion tends to stay in motion. And stocks are absolutely moving.

Over the last 36 trading days, the S&P 500 index is up over 16%.

Source: @charliebilello via X

This is one of the biggest short-term rallies in decades. Performance like this is in the 99th percentile historically.

And I would be shocked if the market weakened any time soon.

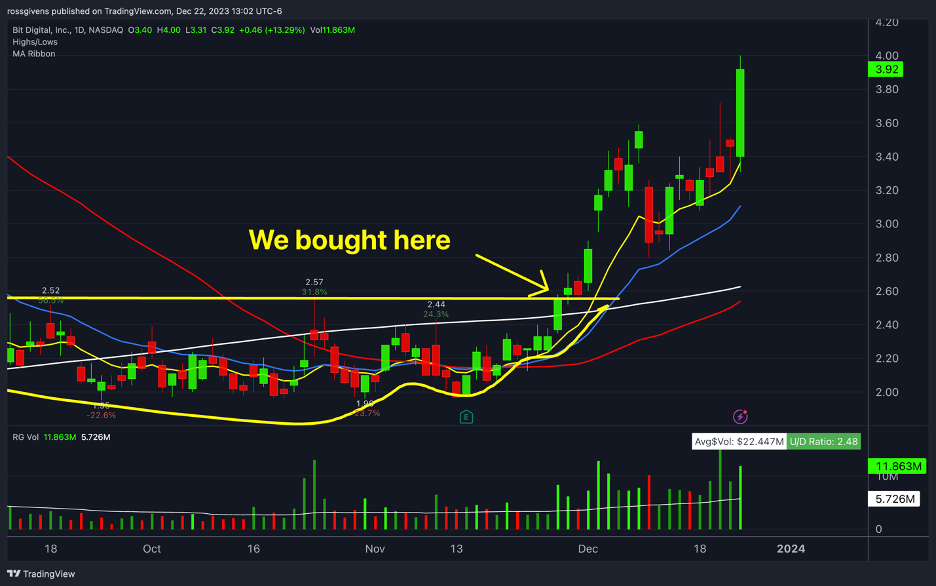
The areas we have been focusing on the last few months continue to be the best performers. Bitcoin and other cryptocurrencies are on a tear. We bought crypto mining stock Bit Digital (BTBT) three and a half weeks ago. It is already up 52%.

Homebuilders and building materials stocks also continue to outperform. I believe this will be a leading sector in 2024 and am patiently waiting for a pullback to buy more stocks in this group.

But for the next few days, forget about stocks. Forget about trading and profits and institutional consolidation patterns.

Spend time with your family and make this Christmas one they won’t forget.

Merry Christmas.

Best wishes for your trading,
Weekly Update: New Week, Same Story

Good evening, and welcome to this week’s edition of Stealth Trades!

New week, same story… small caps remain on top.

The headline of last week’s update was ‘Small Caps Lead the Way.’ In it, I discussed how smaller stocks were seeing better action, had further to go before reaching new highs, and would likely outperform mega-cap stocks like Alphabet, Microsoft and Meta going forward.

This week further proved that point.

The Russell 2000 index which represents small-cap stocks vastly outperformed the other indexes.

It gained nearly 6% this week with hundreds of stocks surging by double digits.

Homebuilders and other names tied to the construction sector soared as well. Dream Finders Homes (DFH) is a stock we own in my Alpha Stocks portfolio. It is up 21.5% in just the last two weeks.

We also own Eagle Materials (EXP) and are sitting on a 17% open gain in just a few weeks.

Momentum in this sector has accelerated thanks to this week’s meeting of the Federal Reserve Board. Not only did the Fed keep rates at their current level, notes also revealed their plan to cut interest rates at least three times in 2024.

After more than tripling from 1.3% to 5% in two years bond yields are aggressively falling on this news.

Rates are 110 basis points off their October highs which is prompting an uptick in mortgage applications and will likely lead to an increase in new construction starts.

With the exception of crypto, the best-performing areas of the market right now are all tied to construction – steel, home builders, building products and banking.

With the Russell 2000 up 22% in the last eight weeks, don’t be surprised if we stall here or even pull back slightly.

The index is currently butting up against a level that has acted as resistance since 2022.

Will we get through it? Yes. But don’t be surprised if it takes a few weeks to digest the supply up here.

After such a powerful rally, the market needs to digest this move and prepare for the next leg higher. The ideal situation would be to see a couple weeks of tight trading to finish out the year. This could set up a strong first quarter rally to start 2024 out strong.

We took profits in several of our positions this week. We believe in selling into strength and nailing down gains when they come quickly.

But the bull market is likely just beginning. After two years of chop, the market is poised for a powerful bull market – the likes of which I feel few are prepared for. And small-cap stocks are favored to be the biggest winners.

Best wishes for your trading,
Weekly Update: Crypto and Small-Caps Lead the Way

Good evening, and welcome to this week’s edition of Stealth Trades!

In last week’s update, we looked at the four major indexes to see where each stood. We pointed out that while the S&P was within 5% of its all-time highs, the Russell 2000 – which represents small-cap stocks – was a full 34% below its best mark.

Not only do small caps have further to run before hitting resistance, but they have also outperformed larger stocks in the Q4 rally.

In my opinion, mega-cap stocks like the “Magnificent 7” (Google, Nvidia, Apple, etc.) will not be the leaders next year. Small to medium-sized stocks will be the ones demonstrating the largest gains.

In fact, the 10 best-performing stocks in November were all in this group.

Biggest stock gains in November:

  • Roku: +75%
  • Coinbase: +62%
  • Opendoor: +58%
  • Block: +58%
  • Shopify: +54%
  • Datadog: +43%
  • Snap: +38%
  • Cloudflare: +36%
  • Palantir: +35%
  • Crowdstrike: +34%

With the exception of Palantir, all of these names are still trending beautifully and would be great stocks to buy on a pullback.

The other big development is happening in the crypto space.

Bitcoin broke out from a textbook consolidation pattern last week:

Bitcoin tends to trend well from proper buy points.

After a strong move higher, notice how the chart compresses during the month of November. Pullbacks become shallower as the chart moves from left to right – a clear sign of accumulation.

A close look at the volume bars at the bottom of the chart reveals another clue. Volume tends to be higher as Bitcoin moves up and lower when it moves down. This is exactly what you want to see. The volume chart should mimic what you see in the candles above.

We saw the same pattern before the breakout in October:

Here is a closer look at the price action:

I have drawn a line showing the progressive “shallowing” of the candles as the pullbacks compressed.

You can also see pockets of low volume each time BTC pulled back. The selling is taking place on lighter volume than the buying. This was a big clue.

The high-volume spikes all took place on days when Bitcoin was surging higher. And the breakout day saw the highest volume in over a month.

Trading is not about guessing. Traders who see the most success do not have any unique insight or forecasting ability. Instead, they are masters of INTERPRETING what they see on the chart.

I don’t care about being right. You shouldn’t either. It doesn’t matter how valuable a stock or cryptocurrency may be. The only thing that matters is if it is in demand… if large investors are buying it at a pace higher than it is being sold.

Plenty of stocks that are now delisted and worthless saw gains of several thousand percent at one point in the past. At that time, they were “hot stocks” that benefited from high investor demand.

In hindsight, it is easy to see that investors were wrong, and their bullish forecasts never came to fruition. But I am not Warren Buffett looking for stocks to hold for 40 years. Where the price is at some date years in the future is not my concern.

I want to make gains now. I want to be in stocks being actively bought by institutional investors that can deliver big profits in weeks and months, not years and decades.

If you bought Bitcoin at the October buy point, you would be up 54% in eight weeks.

That’s a heck of a gain. Professional money managers would be ecstatic to see a move like that in a year.

We bought two crypto stocks in my Alpha Stocks service when the Bitcoin breakout began.

We are up 36% on Bit Digital (BTBT) stock in ten days:

We also bought Marathon Digital (MARA) – a bitcoin mining company that was coming out of a similar breakout pattern at the same time.

Look what it has done…

If your goal is to find stocks that will produce a steady 15% for the next 10 years, I won’t be much help to you.

But if you want to nail down quick profits in the shortest possible time, this is the way to do it. Learn to read the charts and interpret what you see. That is the formula for market-crushing results.

Best wishes for your trading,
Weekly Update: What a Run

Good evening, and welcome to this week’s edition of Stealth Trades!
What a run.

The S&P 500 just saw its second-best November performance since 1980. The index posted a gain of 8.92% for the month.

In fact, the whole market performed well. The Nasdaq rose 10.7%, the Russell 2000 jumped 9.2%, and the Dow tacked on 8.77%.

The rally we predicted in the October 27 edition of this weekly update played out beautifully, and members who listened are up big over the last month.

But for the last week or so, stocks have been quiet. We have seen nice gains in a few pockets of the market. My Alpha stocks service owns a couple crypto stocks (MARA & BTBT) that both soared today and some nuclear stocks with over 20%+ open gains (CCJ & EU). But the general indexes have made minimal progress.

The S&P 500 is now sitting within spitting distance of its high of the year.

While I believe we will push through and make new all-time highs in 2024, it is worth comparing the other indexes to see which has more ground to make up and potentially more opportunity.

Below is a chart of the three major stock indexes from the March 2020 COVID lows through today:

I have noted on the chart the distance of each to their respective all-time highs.

The S&P 500, made up of the largest 500 publicly traded stocks, is just 5% away.

The Nasdaq Composite index, which represents more than 2,500 stocks listed on the tech-focused Nasdaq exchange, is 13% from new highs.

And the Russell 2000 index, representing small-cap US stocks, has a full 34% to go before reaching new high ground.

Small caps have severely underperformed this year against large cap stocks. And I believe this is setting up to be a big opportunity for investors.

Small cap stocks have not done poorly because they are overvalued and therefore less attractive investments. In fact, the opposite is true.

But 2023 has been a strange year…

Coming off the tail of a bear market, we experienced above-average inflation, the fastest interest rate hike in modern history, and two taxpayer-funded wars in the Middle East (on top of the usual nonsense). To say times are uncertain would be an understatement.

Historically, institutions would turn to gold or bonds in times like this. But with rates skyrocketing, bond values are falling off a cliff. And gold has been replaced by bitcoin as a risk asset (BTC is up 134% year to date).
At the same time, stocks rallied hard to start the year, leaving many funds looking like idiots with minimal exposure. So, they piled into the only names they could get in quickly that had ample liquidity – mega cap stocks like Apple, Amazon, Nvidia and Tesla.
This fueled the fire and led to big gains in this small handful of names.

Meanwhile, small cap stocks got no love. They were overlooked by fearful investors who flocked to the household names which did well in the last bull market.

So, the Russell 2000 went nowhere…

This leaves a lot of ground to be made up. And I am already beginning to see a shift toward small and medium-sized stocks.

Over the last five trading days, the S&P 500 and Nasdaq are up 0.7% and 0.03% respectively.

The Russell 2000 index, however, is up 3.1% on above-average volume. And I believe we will continue to see this shift toward smaller market capitalizations.

You see, the stocks that lead one bull market almost never lead the next.

Meta, Amazon, Apple, Tesla, Nvidia, Microsoft and Alphabet have been leading the charge for a decade. The odds they will continue this streak of outperformance at such robust size is highly unlikely.

All seven of the stocks I just listed are approaching or exceeding $1 trillion in value. ONE TRILLION DOLLARS!

It is a lot harder to double the value of a trillion-dollar company than it is a billion-dollar one. The stocks that outperform in the new bull market emerging now will likely be names most have never heard of. They will be the next Tesla, the next Apple, and the next Microsoft.

Do not make the mistake of only following the leaders of the past. Keep an eye out for new stocks showing rapid growth with exciting new products or services.

And do not be scared if they are already up several hundred percent. The true leaders will multiply many more times before topping.

Best wishes for your trading,