Weekly Update: Are We Nearing the Top?
Good evening, and welcome to this week’s edition of Stealth Trades!
The market is beginning to feel “toppy.”
Stocks have pushed higher since November in one of the strongest rallies we have witnessed in years.
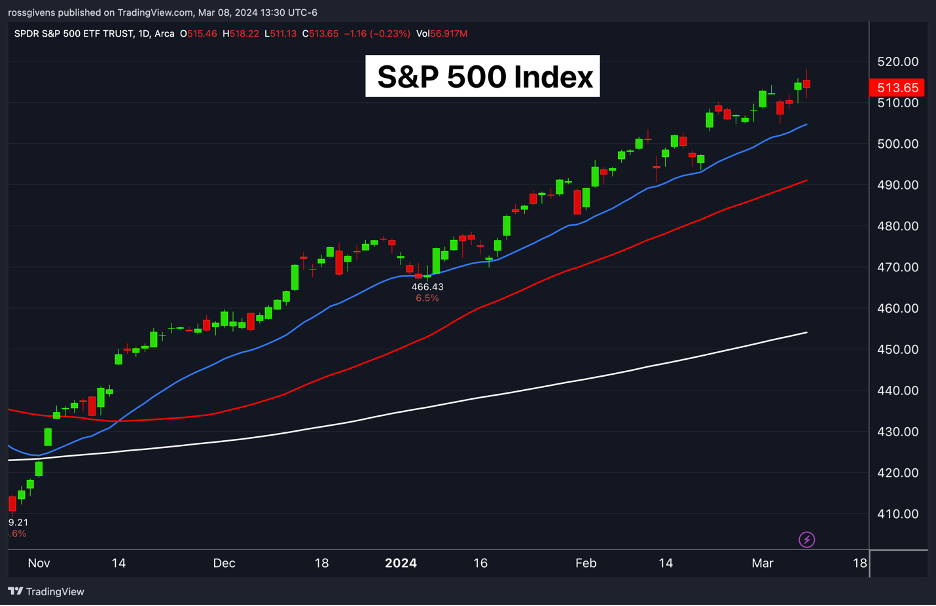
Four months of higher highs and higher lows without so much as a 3% dip. It is almost unheard of.
I have been passionately bullish since the October lows. But even I did not expect a move this pretty.
During this period, several stocks have made parabolic moves.
Nvidia, the mega-cap semiconductor stock and clear market leader, more than doubled in two months. It came out of a textbook base pattern and quickly rocketed to nearly $1,000/share.
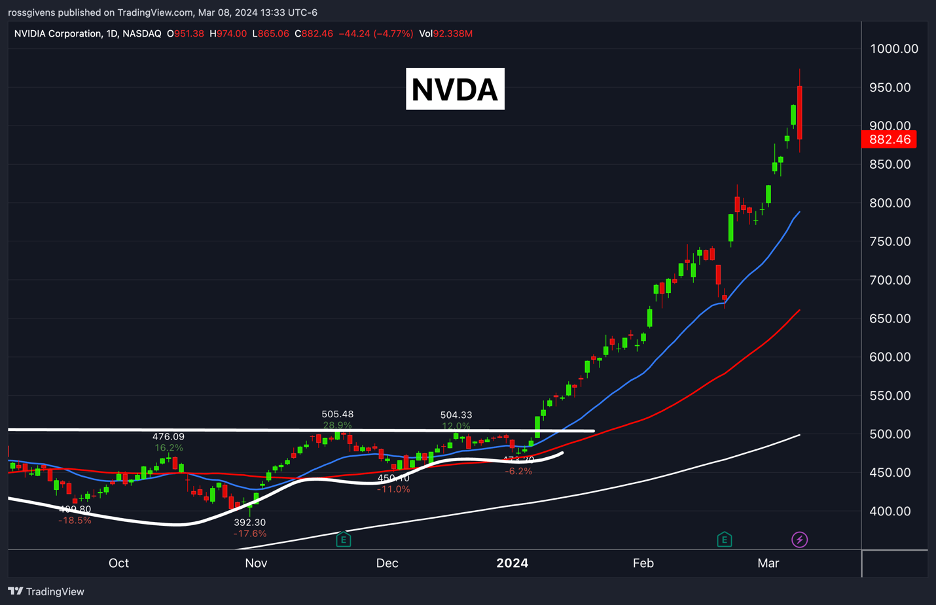
This stock added a TRILLION dollars to its value in 60 days.
Super Micro Computer did even better…
SMCI shares surged from $300 to $1200 in 50 days.
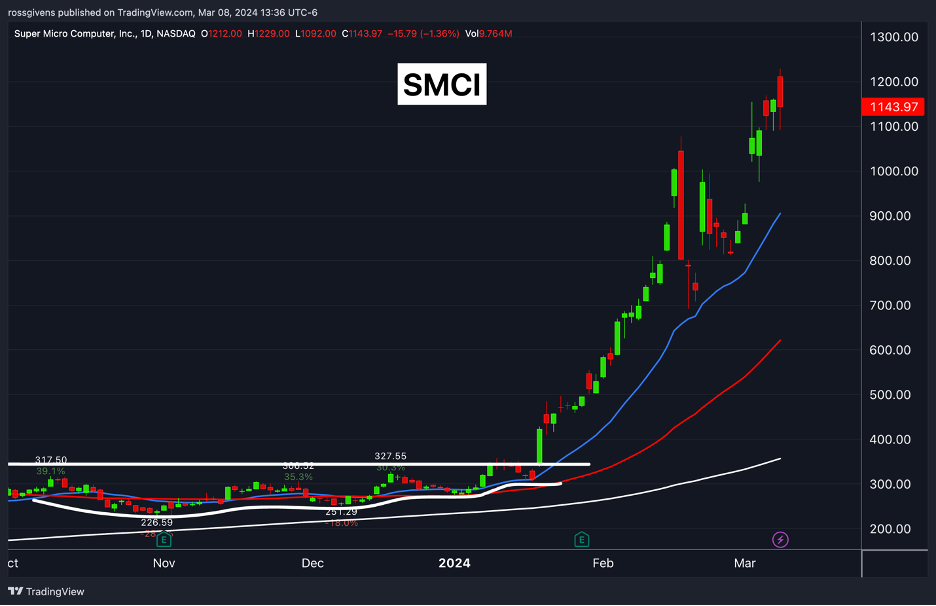
It QUADRUPLED in 7 weeks!
Eventually, both of these stocks will crash. The AI hype will wear off, sales and earnings will slow down, and investors will see a decline of 50-80% in these holdings.
But when?
While I do not think the bull market is over (in fact, far from it), I do think we could be seeing a short-term top.
Every bull market has a theme. And within that theme you will find the market leaders.
The leaders of this rally are obvious: Nvidia (NVDA), Super Micro (SMCI), Meta Platforms (META), Microsoft (MSFT), Palantir (PLTR), and maybe a few others.
These are the stocks you want to keep an eye on. When they begin to fail, the rest of the market is usually not far behind.
Today, NVDA showed clear weakness. After gapping up to new all-time highs in the morning, the stock sold off, falling 10% intraday on heavy volume.
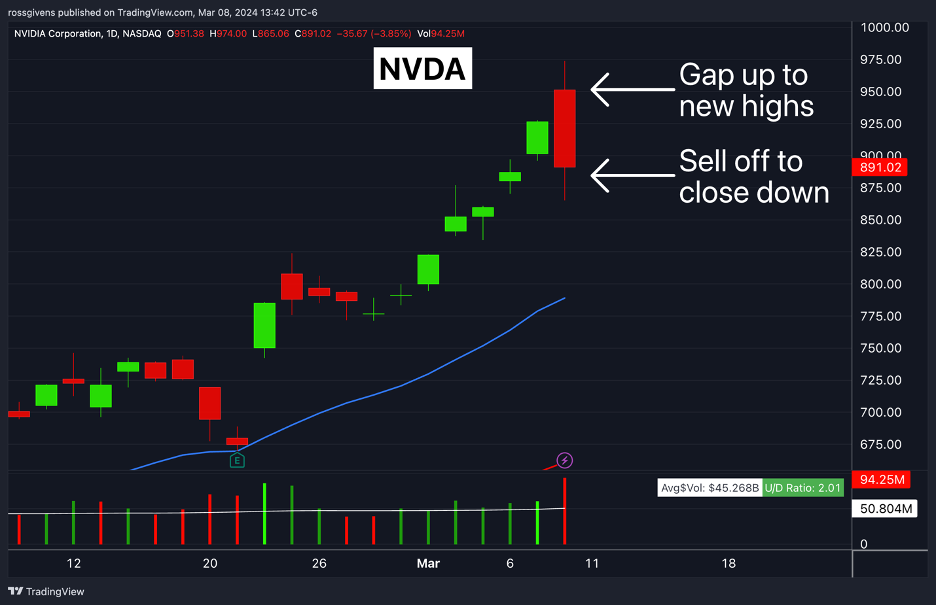
This is something known as a “downside reversal.” A stock makes a new high, then reverses to close down on the day. When you see this, especially on above-average volume, it could be a sign that the top is in.
As of the time of this writing – 1 hour before the Friday closing bell – the Nasdaq and S&P 500 indexes are also showing a downside reversal pattern. So is AMD, META, and SMCI.
Another data point beginning to worry me is the narrow market breadth.
Breadth refers to market participation. When the indexes are rallying, we want to see the majority of stocks rallying along with it.
Right now, that is not the case.
The chart below shows the S&P 500 index on top and the percentage of stocks above their respective 50-day moving average beneath.
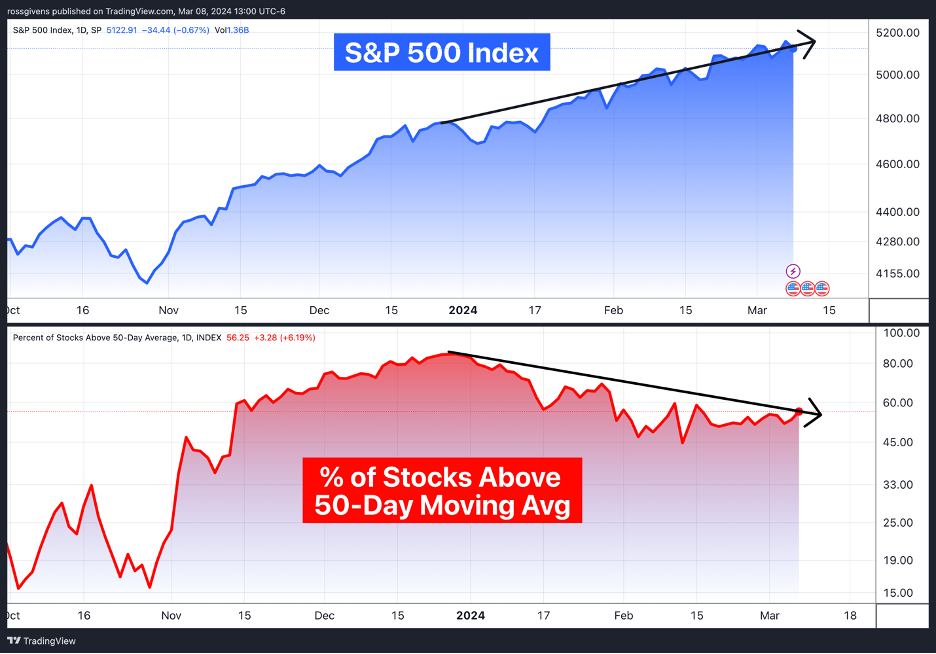
The divergence is hard to miss.
While the index has gained nearly 10% this year, participation has fallen from 85% to 55%. In other words, almost half the stocks on the major exchanges are in short-term downtrends.
How is this possible?
The indexes are market-cap weighted. Larger stocks like Microsoft, Nvidia and Amazon have significantly more impact than smaller names.
In fact, a whopping 55% of the S&P 500’s 2024 return comes from just four stocks – NVDA, META, MSFT and AMZN.
This trend could reverse. It is possible we see a rotation out of mega-cap tech names and into a broader group of stocks.
But if institutions sell what have been this year’s high-flying stocks, it will likely trigger a short-term correction in the market.
I want to be clear – I am NOT saying the bull market is over. But a lot of stocks feel extended right now.
This move needs to be digested. Weak hands need to be flushed out. Traders who are over-leveraged and chasing parabolic moves need to be stopped out.
Every so often, the market must knock the froth off. Otherwise, it sets itself up for a major correction like the 1999 Tech Bubble.
This afternoon, I put on a hedge. I sold short QQQ – an exchange traded fund representing the Nasdaq – at around 440. My stop loss is just above the high of the day at 449.
This represents a 2% risk.
I hope the trade does not work out. I am happy to take a small 2% loss if stocks continue higher.
Another way to hedge one’s portfolio is with a put option.
The QQQ Apr19 $435 put trades for about $7 ($700/contract). Each contract represents 100 shares of stock. So, for $700 you could hedge a $43k stock portfolio for the next 6 weeks.
That comes out to an “insurance” cost of roughly 1.5%.
And while I would not recommend maintaining an option hedge year-round since it would eat up a lot of your gains, it seems prudent here after such a profitable 4 months.
Best wishes for your trading,