Weekly Update: My Favorite Buy Trigger
Good evening, and welcome to this week’s edition of Stealth Trades!
As an active trader, I go to great lengths to keep the pulse of the market.
I track the major indexes for signs of accumulation and distributions. I track performance by sector and group to see where the money is flowing. I watch the top-performing stocks to stay abreast of market themes. I follow market breadth indicators like the number of net new highs.
I even chart the percentage of stocks above key moving averages and compare that to index trends in order to identify divergences beneath the surface.
It is a lot of work.
A lot of people have no interest in doing it. They want a simpler approach… one that can still deliver market-beating returns.
And for those folks, the answer is stage analysis.
Stage analysis, at least the way I use it, is based on the work of Richard Wyckoff. His books, published almost 90 years ago, are as relevant today as they were then.
Wyckoff laid out the 4 Stages of the Stock Cycle, and it is the backbone of my entire investment philosophy.
I teach this every Monday at 4pm ET in our Live Stealth Trades sessions. If you have not yet attended, I encourage you to do so. They’re free, and I have nothing to sell you.
All growth stocks go through 4 distinct stages. The length and severity of each will vary, but the playbook is the same.
I issued a new trade alert for Advance Auto Parts (AAP) on Friday morning for this very reason. Below is a weekly chart of that stock with the 4 Stages of the Stock Cycle overlaid.
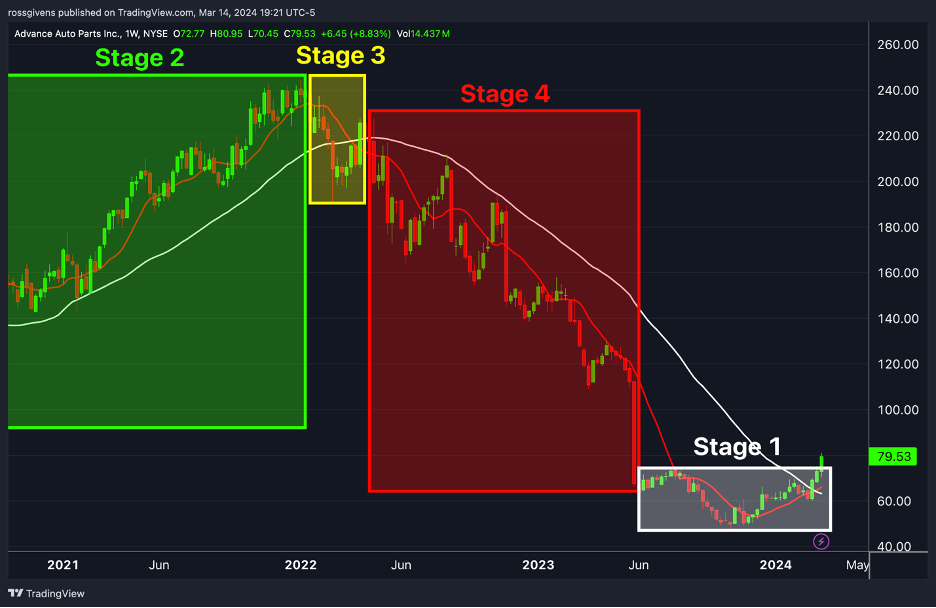
Stage 1 is the Accumulation Stage. This is where institutional investors begin building positions in a stock they believe to be undervalued based on future expectations.
Stage 1 typically lasts between 6 and 24 months. During this time, the stock does nothing. It bounces around in a range near the lows of the last several years finding a bottom after a significant price decline.
You will often hear these stocks referred to as “value stocks” or “laggards.”
Stage 1 is like watching paint dry. Nothing exciting happens here. But when the stock eventually emerges from this consolidation area and breaks the Stage 1 high, things start to get interesting.
Stage 2 is known as the Markup Stage, and this is where 90% of your gains as an investor will come from.
When a stock emerges from its Stage 1 base, it usually means something exciting is happening with the company. Maybe it has a hot new product or service. Maybe sales and earnings are growing at a high rate. Maybe the company hired a new CEO who is turning the company around (this was the case for Advance Auto Parts). Or maybe the stock is simply in the right place at the right time (AI, crypto, semiconductors, etc.).
Whatever the reason, the stock is now in demand. It has gone from a dud to a stud, and institutions are actively buying it up.
When large institutional investors like Warren Buffett buy a stock, it takes some time. There is not enough liquidity for them to buy it all at once. It typically takes several months to build up a full position.
For this reason, stocks tend to trend well in Stage 2. The constant buying pressure guides the stock higher. Every dip is bought, and the stock typically finds support along its 50-day moving average.
Below is a weekly chart of Mohawk Industries (MHK) during its Stage 2 rally in 2017:
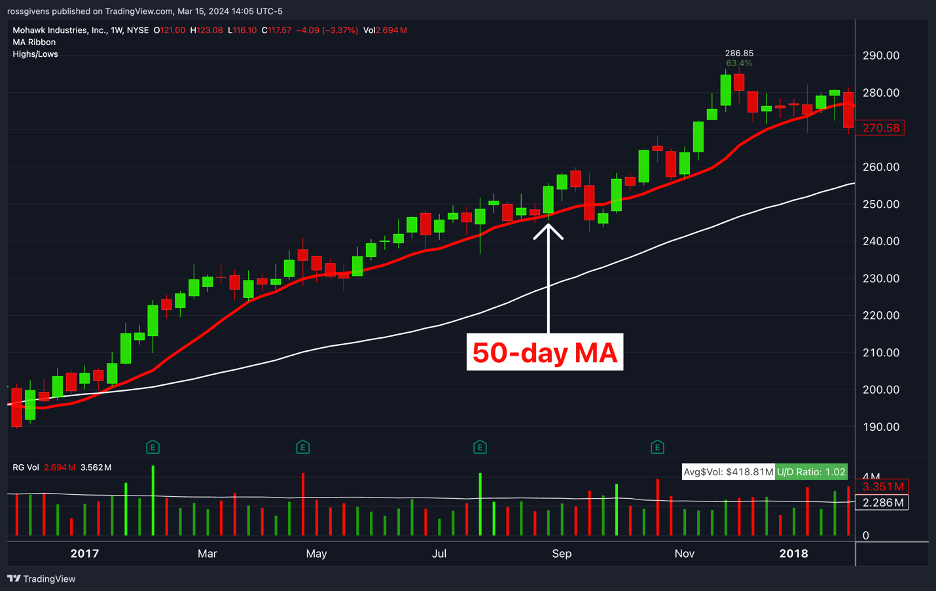
Note how the stock is trending almost perfectly along its 50-day moving average (red line).
But eventually, the party comes to an end. Institutions have to sell to collect their profits. This might happen when the stock has reached what they believe to be fair value. Or the company could begin showing weakness and posting earnings below expectations.
Whatever the reason, the big guys sell with far less grace than they buy. When they want out, they dump it – quickly.
This triggers Stage 3 –Distribution.
Stage 3 is where I see most retail traders get in trouble. They watched the stock soar several hundred percent, all the while scared to buy at the top. Then finally… a pullback!
The stock drops 30% in a few weeks and they jump in.
But this is a mistake. With the large institutional investors no longer buying, the stock has lost its support. The move is over. This is the beginning of the end, not a buying opportunity.
The easiest way to spot Stage 3 is by watching the volume on the dip.
Look at the weekly chart of Crocs (CROX) below:
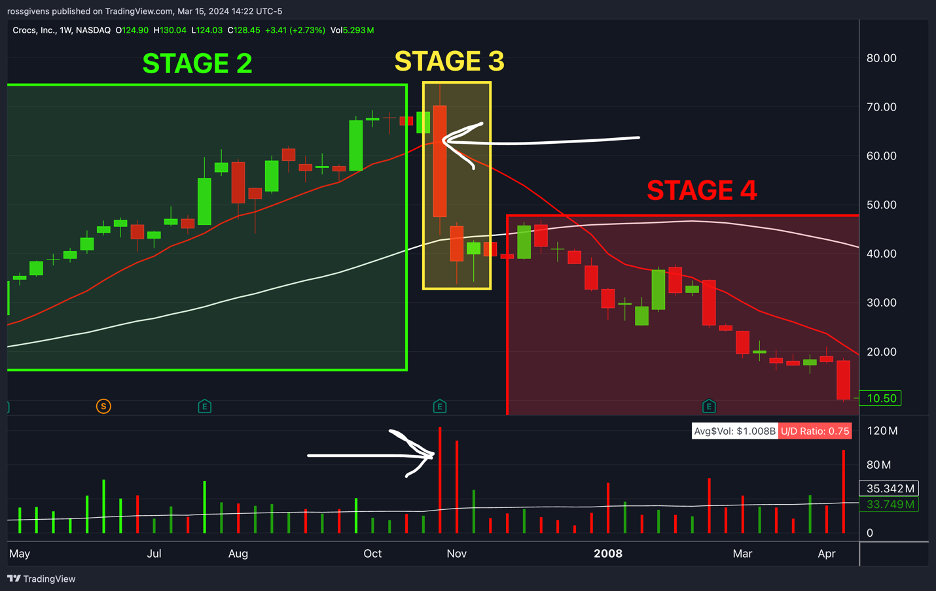
After climbing over 300% in Stage 2, the stock fell 31% in a week. That should be enough to tell you the party is over. But note the volume at the bottom of the chart…
This decline came on huge volume – the highest since the stock began trading. And if that wasn’t enough, CROX fell another 19% the following week, again on record volume.
The market is telling you very clearly that the easy money stage is over. Wall Street is dumping the stock, and it will fall further in Stage 4.
Stage 4 is the Markdown Stage. Any remaining institutional investors will dump the stock. Retail traders will foolishly buy the dips and suffer large losses as the stock continues to decline.
Most Stage 4 declines see stocks fall 50-80%. In CROX’s case, the stock fell 98% to a low of 79 cents.
If you are a short seller, this is your window. If not, stay away from stocks in Stage 4. You have everything going against you.
Wait for the stock to bottom, put in a new Stage 1, and emerge into another Stage 2 rally.
These are the 4 Stages of the Stock Cycle. And every major growth stock goes through them, over and over and over again throughout the life of the stock.
Some Stage 2 rallies may only last 6 months. Others several years. As I said earlier, the severity of each stage will differ from stock to stock and year to year. But the cycle remains the same.
Buying stocks at the beginning of a new Stage 2 rally is, in my opinion, the gold standard for longer-term investors. Watch a weekly chart and with a 30 or 40-week simple moving average (150 or 200-day). Wait until the stock is at least 30% above its 52-week low (some will be 100% or more) and breaking above the highs of its Stage 1 base.
Ideally, you want to see the stock breaking out on above-average volume. This is a look at the daily chart of Advance Auto Parts (AAP) – the one we recommended buying this morning – currently breaking out of Stage 1.
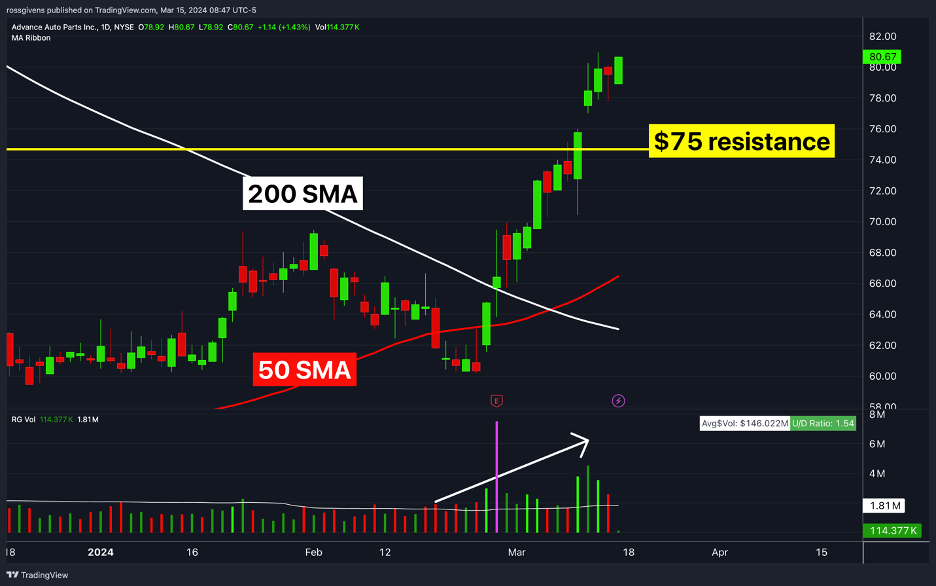
Note the significant increase in volume (white arrow) as AAP surges through the $75 level. This was the high of Stage 1.
As far as when to sell, there are a few schools of thought.
Shorter-term swing traders like me look for a multiple of risk. So, if I risk 20% on the trade, I want to make at least 40%.
Trend traders who want to catch the bulk of the move can use a simpler exit like a weekly close below the 75-day moving average. You won’t get out at the highs, but you will catch the bulk of the move whether that be 50% or 500%.
Regardless of your approach, early Stage 2 breakouts are, in my opinion, the best place to buy stocks.
Best wishes for your trading,