Weekly Update: This is the Time to Buy

Good evening, and welcome to this week’s edition of Stealth Trades!

As we have been saying since the October bottom, this is the time to buy.

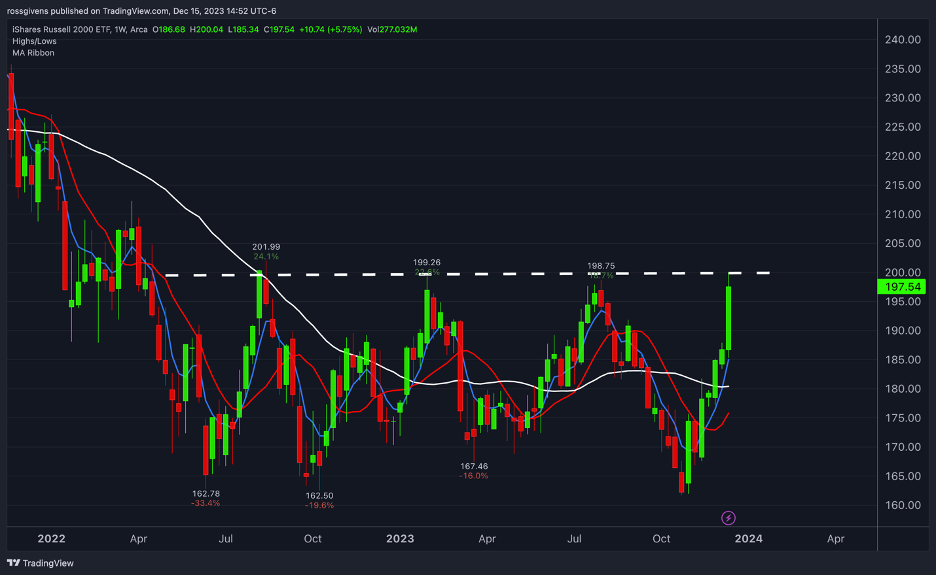
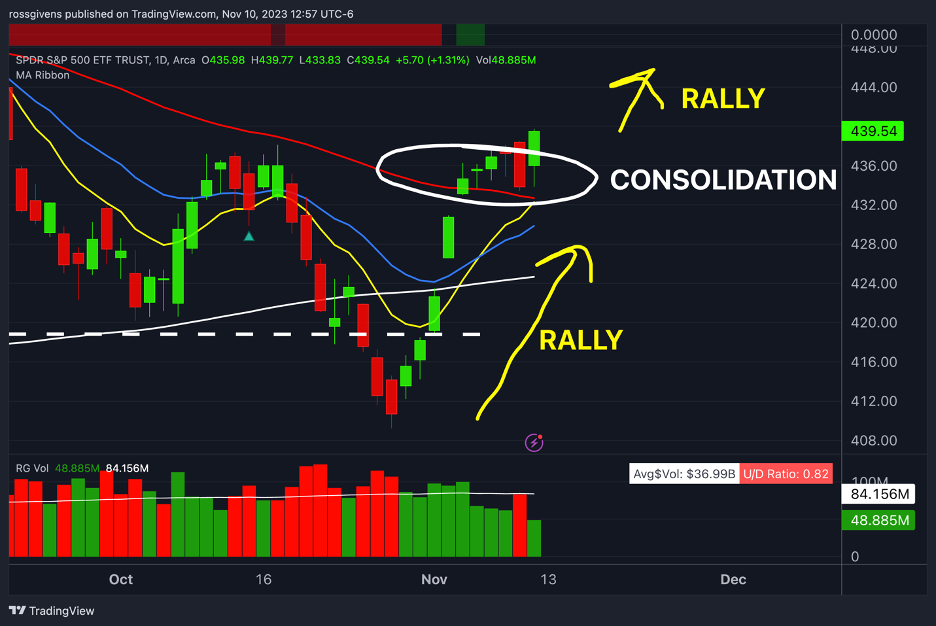
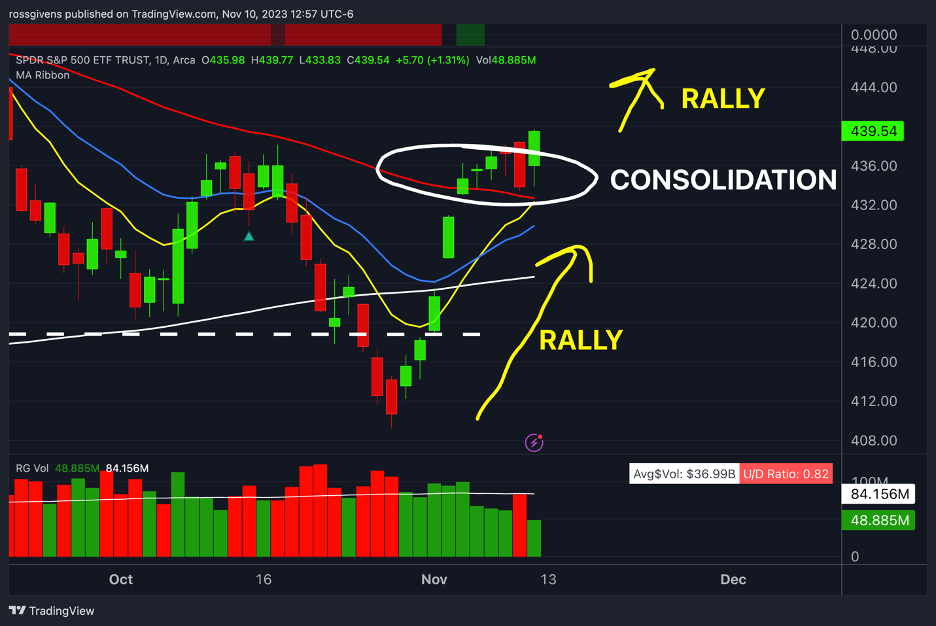
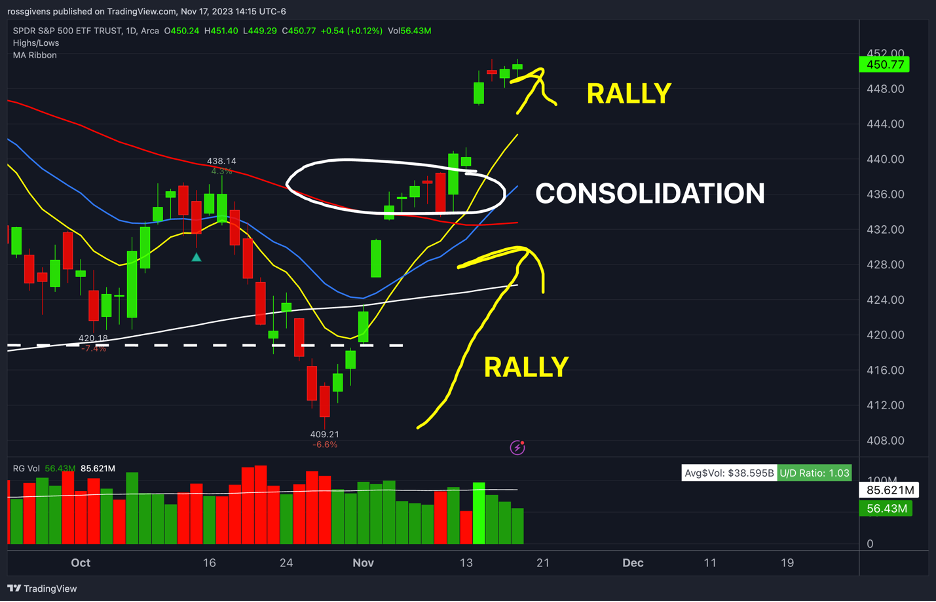
In last Friday’s update, I showed you this chart highlighting the consolidation we saw the week prior and the expected follow-through rally.

After such a hard and fast move higher, the market needed to digest the move before continuing higher.

As expected, it did just that. Here’s the updated chart…

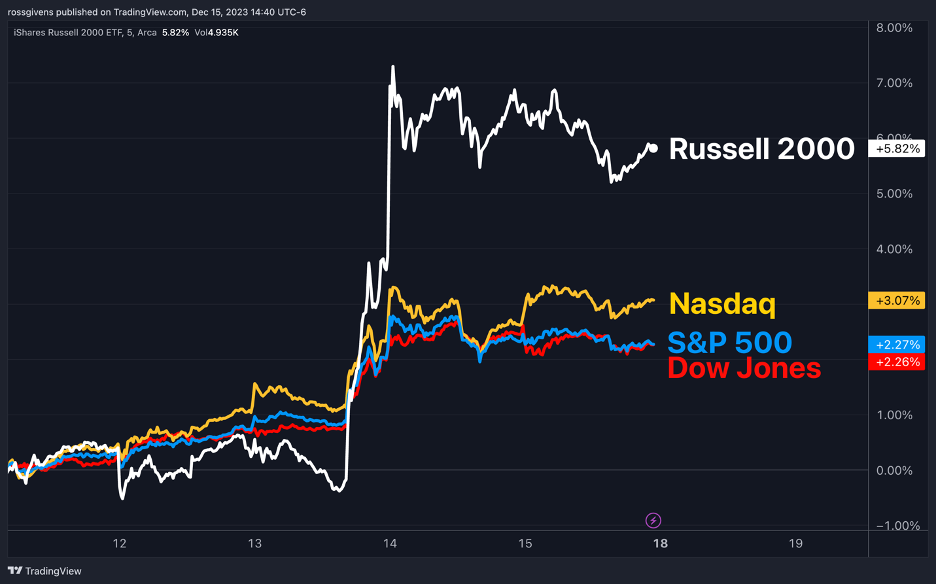
Stocks rallied again this week like clockwork. The S&P (+2.3%), Nasdaq (+2.1%) and Dow (+1.88%) all booked strong gains.

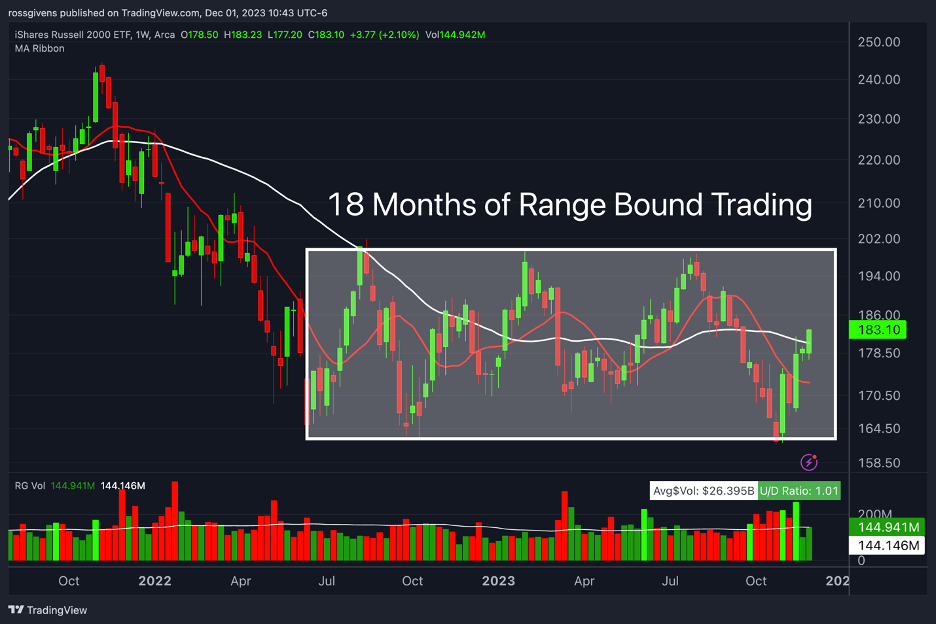
But small-cap stocks, tracked by the Russell 2000 index, were the clear standout. The Russell soared 5.4% this week in its best performance in more than a year.

Even the equal-weighted index, RSP, notched a 3.3% gain.

These are all good signs. Unlike some of the previous rallies we have seen lately, this run was not led by a small handful of mega-cap stocks.

When RSP outperforms SPY, it means there is broad participation. And market internals are confirming the validity of this move.

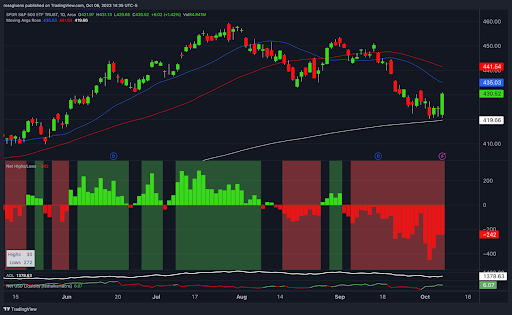
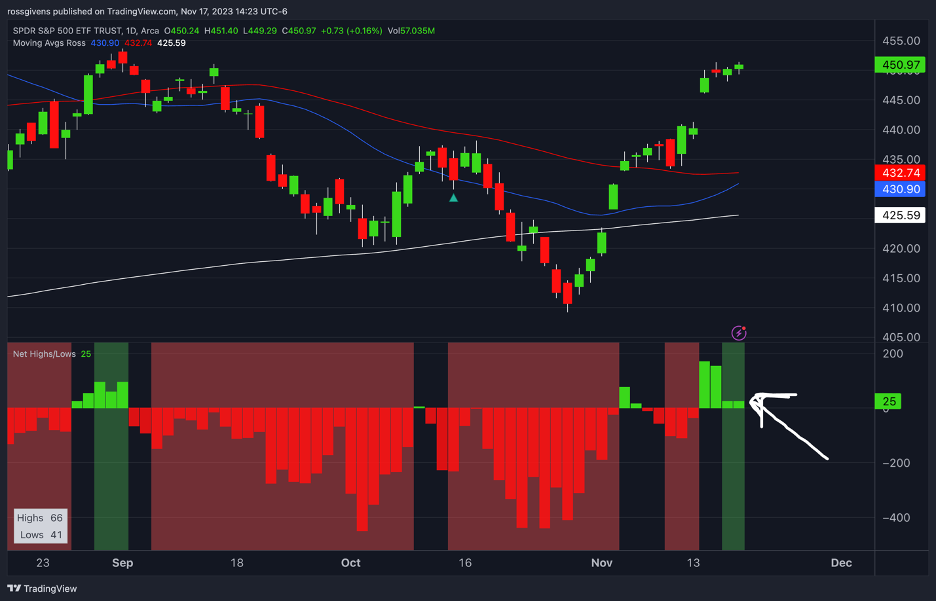
The net new highs indicator is again painting green. For the first time since August, we have seen more stocks making new 52-week highs than lows three days in a row.

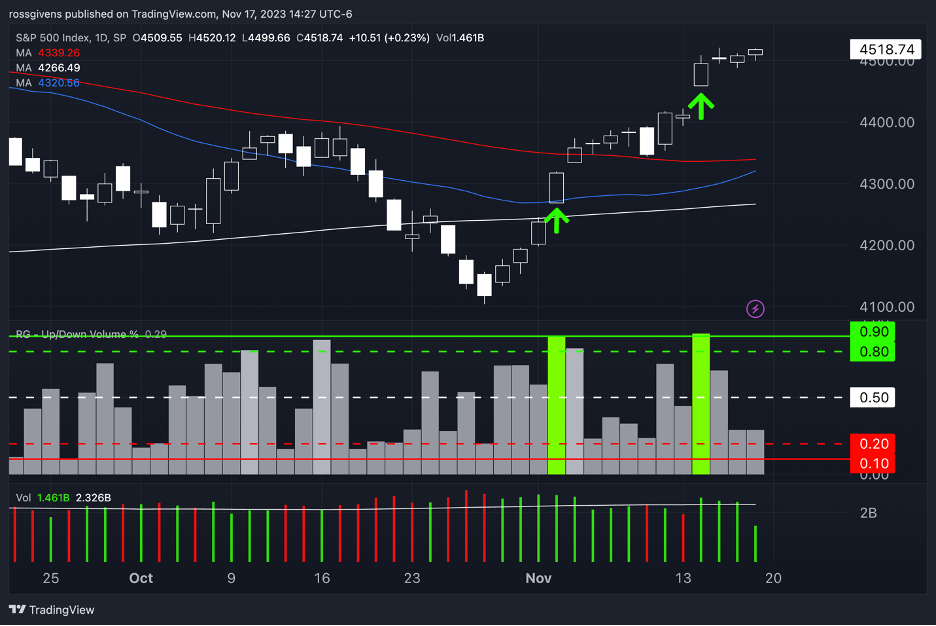
The last time we saw a day of more than 90% upside volume was in early May.

We have already seen two such occasions in November…

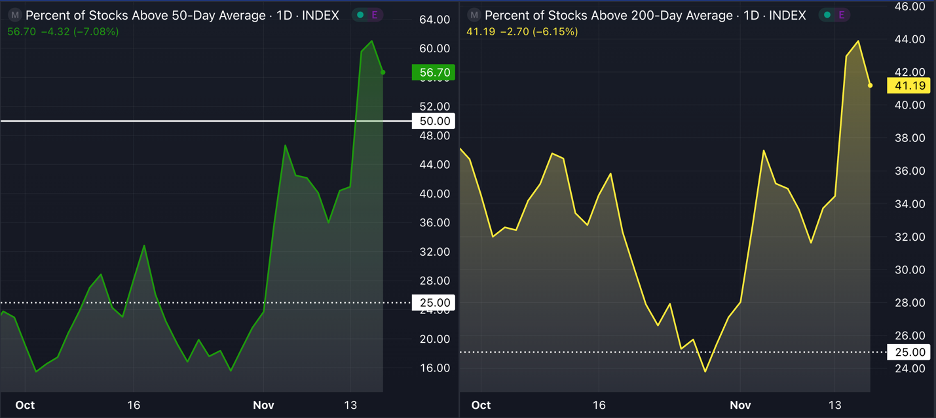
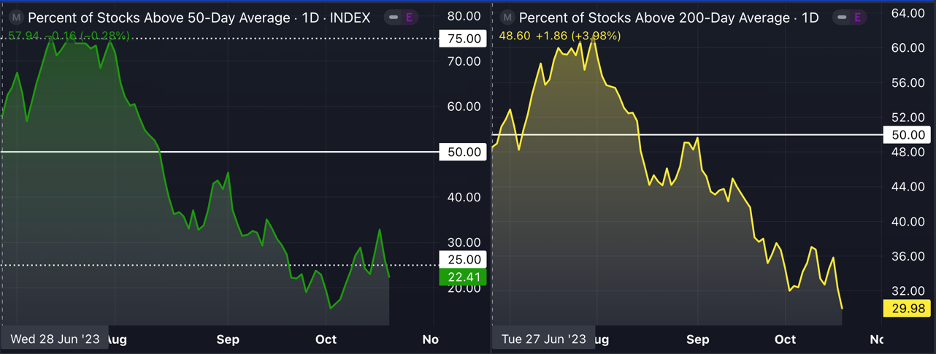
The percentage of stocks above their 50 and 200-day moving averages continue to rise as well. 56% of stocks are now in short-term uptrends and 41% are in long-term uptrends.

I expect to see these figures trend higher as fear leaves the market and FOMO pulls money off the sidelines and back into stocks.

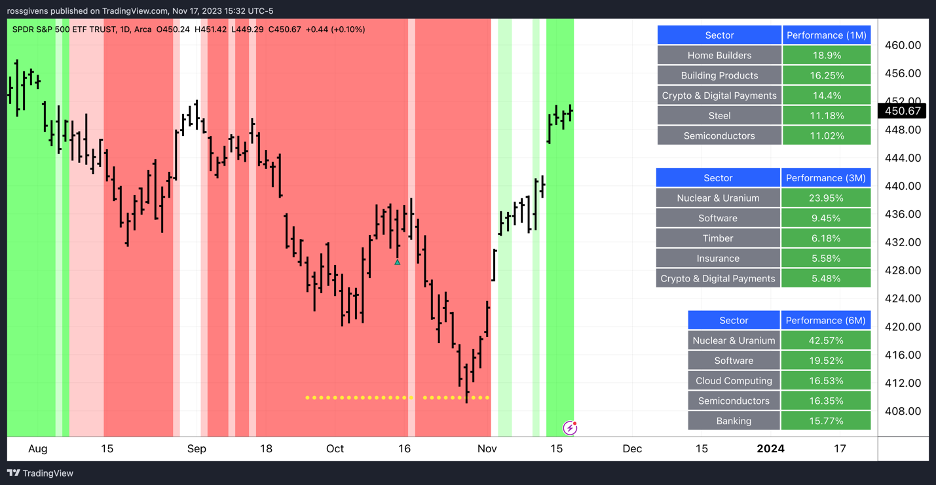
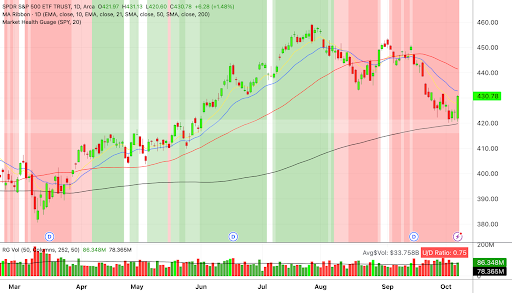
Our Traders Agency Market Health Gauge is bright green signaling a very bullish environment, and the put/call ratio buy signal we pointed out at the end of October has panned out beautifully. 

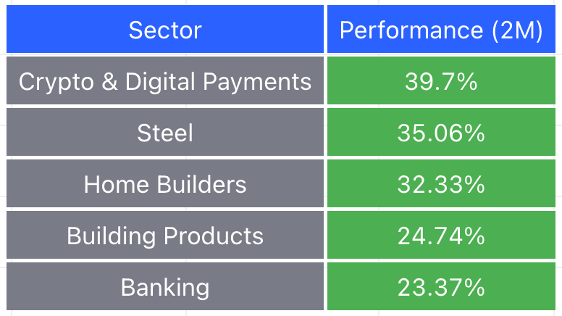
One major theme we are seeing play out right now is a flight to homebuilding stocks. Over the last 30 days, the top performing sectors have been home builders and building products.

The logic makes perfect sense…

The Fed has stopped raising rates. Wall Street believes the period of aggressive hikes is over. And this week’s CPI report showed inflation of 3.2% compared to the same time last year. This was below analyst expectations and a sign the Fed’s actions are working, and additional rate hikes will likely not be necessary.

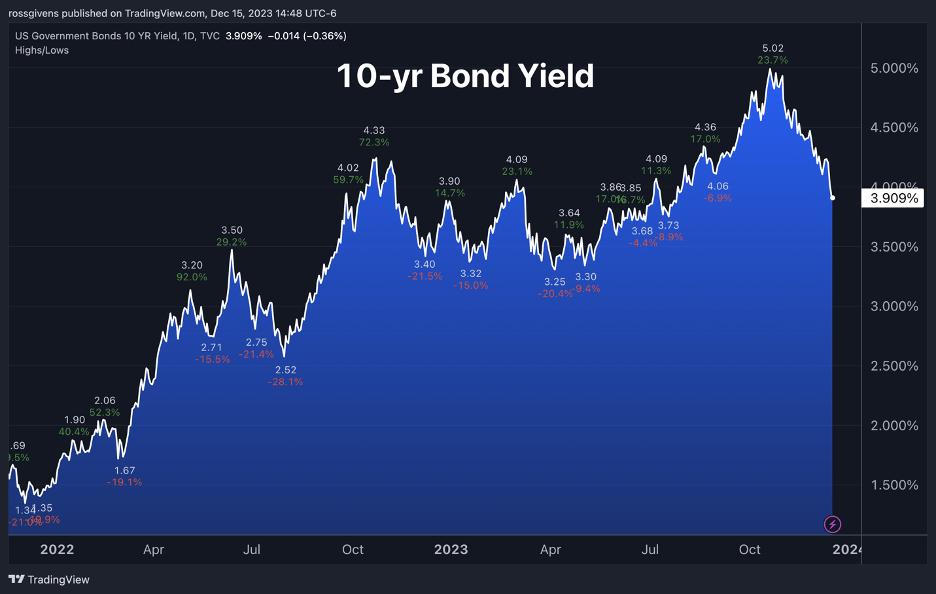
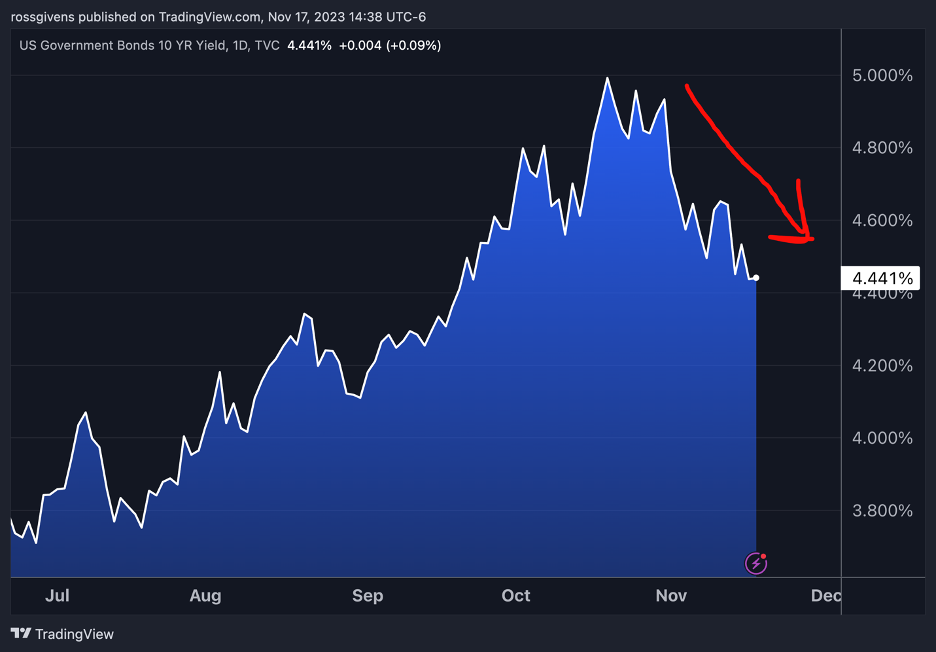
Further evidence of this can be seen in the 10-year bond yield.

Rates have fallen from 5% to 4.4% in the last 30 days, and many banks expect to see cuts in the first half of 2024.

Falling interest rates are good for stocks, but especially homebuilders. With limited housing supply, new construction has been the only game in town. But record high mortgage rates have caused many would-be buyers to pump the brakes.

If rates continue to fall as forecasted, this will fuel the already hot housing boom and send these stocks much higher.

In fact, this could very well be a leading theme of the new bull market.

I sent a short video update to you about this via SMS on Wednesday. Here’s the link in case you missed it.

I am keeping a close eye on the stocks in this group – both homebuilders like Dream Finder Homes (DFH), D.R. Horton (DHI), and Toll Brothers (TOL) as well as construction materials names like Builders FirstSource (BLDR), Eagle Materials (EXP), and Installed Building Products (IBP).

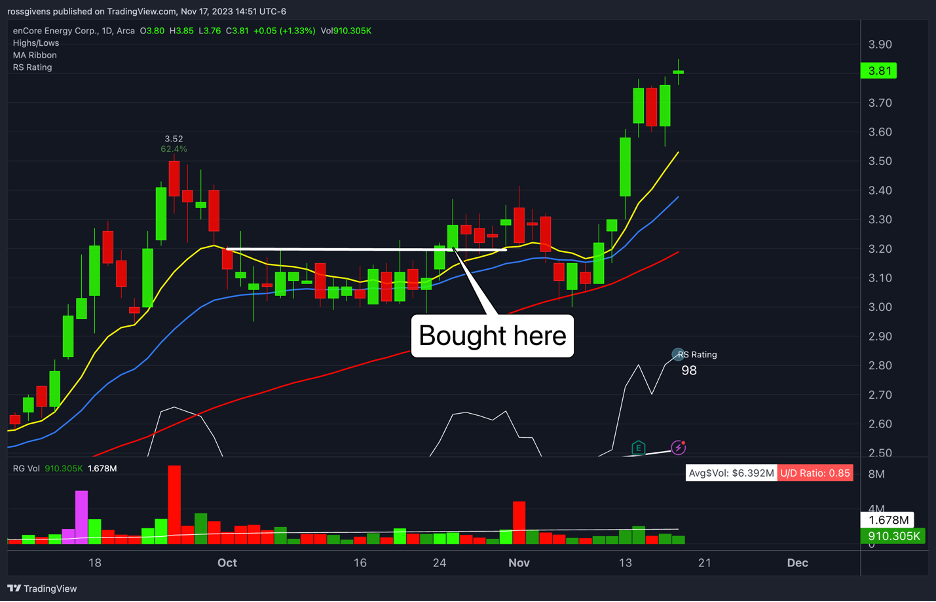
We added a few of these in my Alpha Stocks service this week. We also continue to hold the nuclear stocks I mentioned in weeks prior.

Encore Energy (shown below) just made a new 52-week high.

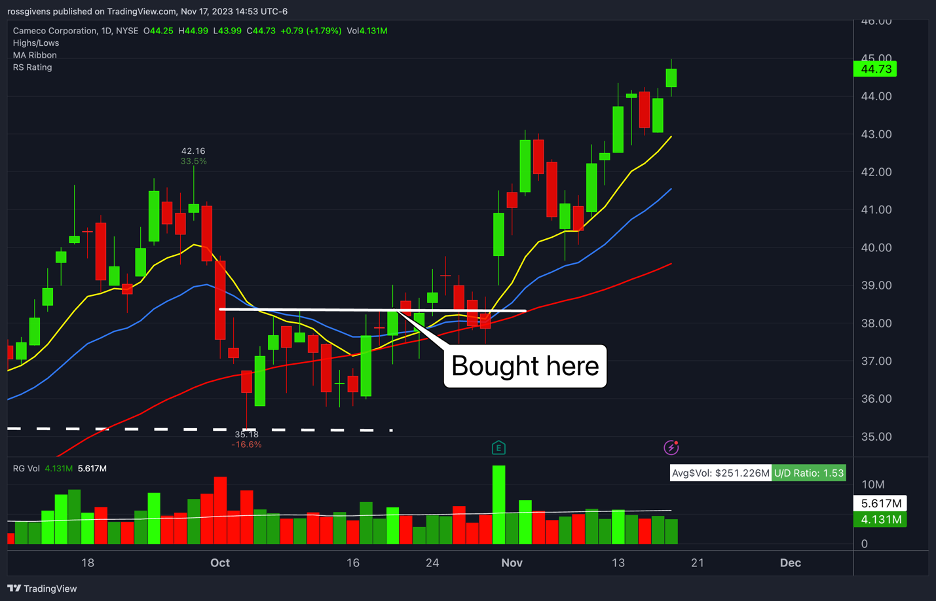
Cameco (CCJ), another nuclear name we own, is also advancing nicely.

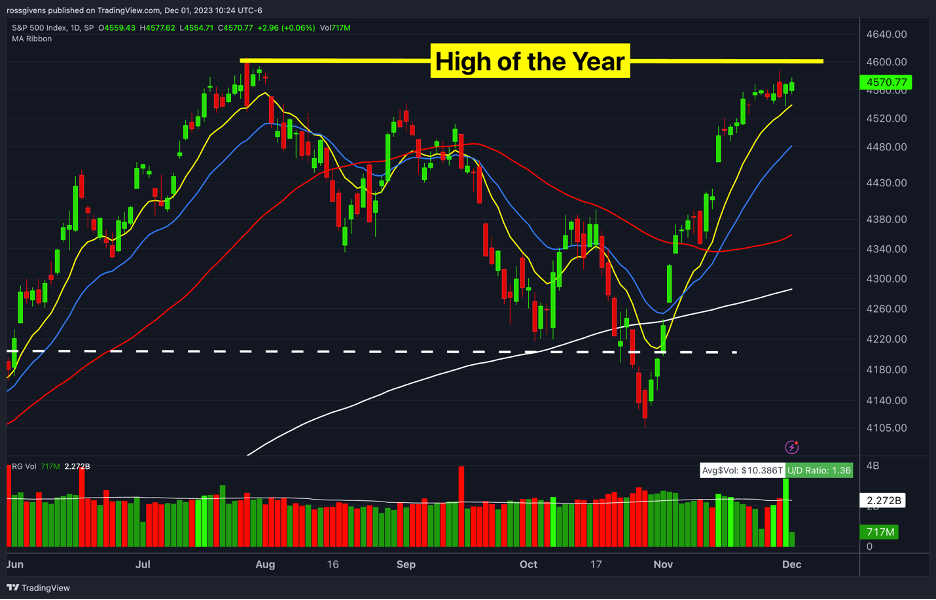
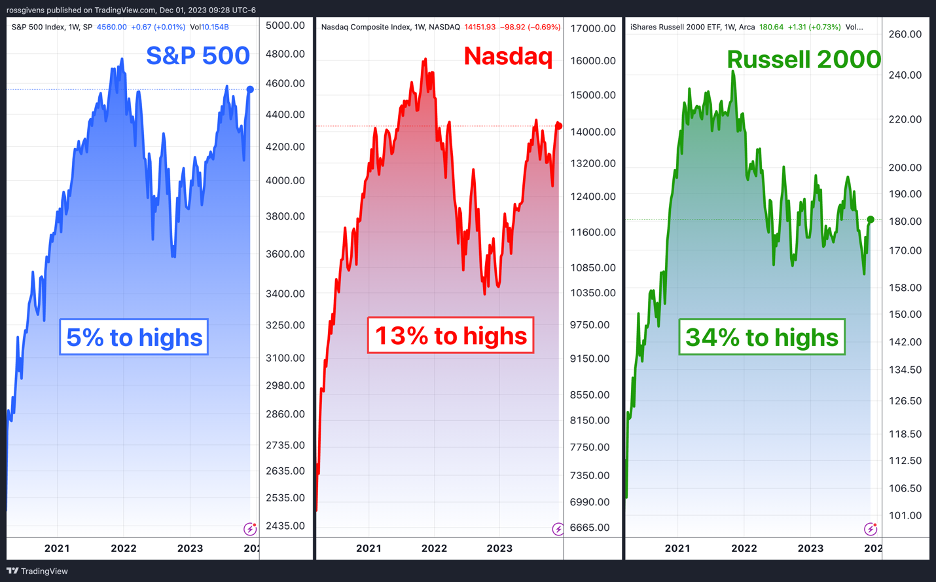
For next week, don’t be surprised if stocks take a breath here. The Nasdaq is sitting at its highs of the year and the S&P is less than 2% away.

It is not unusual for the market to stall at a previous high before continuing its advance.

If stocks pullback, I expect it to be shallow and temporary. Use the opportunity to buy leading stocks in top-performing groups in anticipation of the next wave higher.

Best wishes for your trading,

Weekly Update: The Rally Continues

Good evening, and welcome to this week’s edition of Stealth Trades!

The rally continues!

After a few days of consolidation to start the week, stocks surged higher on Friday to finish at the highest levels since September.

The only thing better than seeing the market rally is watching the bears lose money as their pessimism proves unfounded.

Investors must learn to detach the economy from the stock market. They are not the same. In fact, the stock market leads the economy – not the other way around.

Those who wait until things are all sunshine and roses will miss out on the lion’s share of market gains. As the famed technical analyst Walter Deemer used to say, “When it’s time to buy… you won’t want to.”

Yes, rates are high. Yes, debt is out of control. Yes, there are two wars in the Middle East and above-average inflation. But guess what?

That is when markets bottom… when things are at their worst and slowly begin to improve.

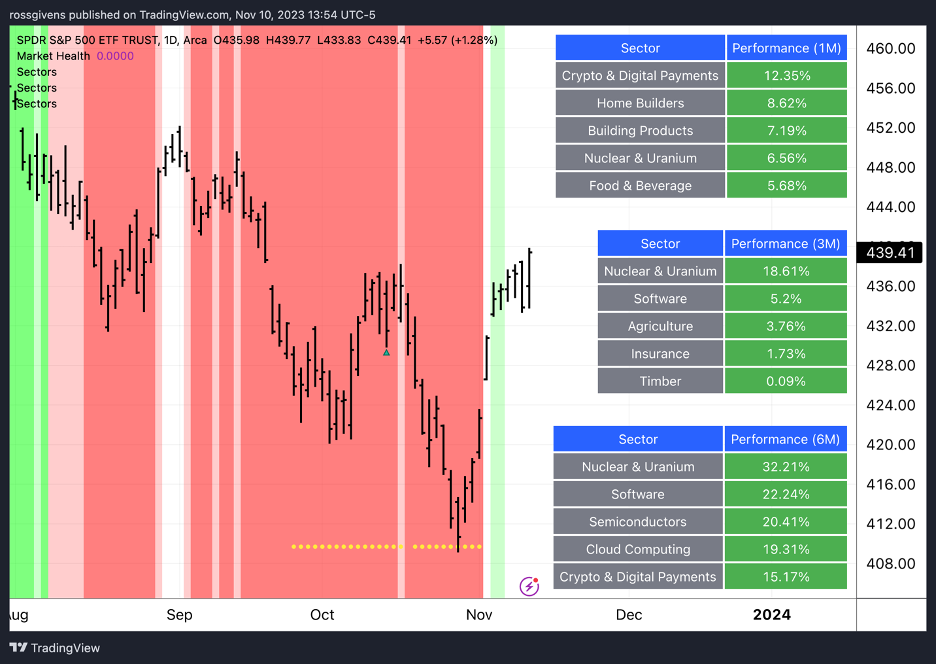
Our market health model remains bullish:

The sectors showing the most strength over the last two quarters are nuclear and software, although nuclear is beginning to weaken a bit.

On the software side, I’m seeing a lot of former market leaders set up in what could be great buying opportunities.

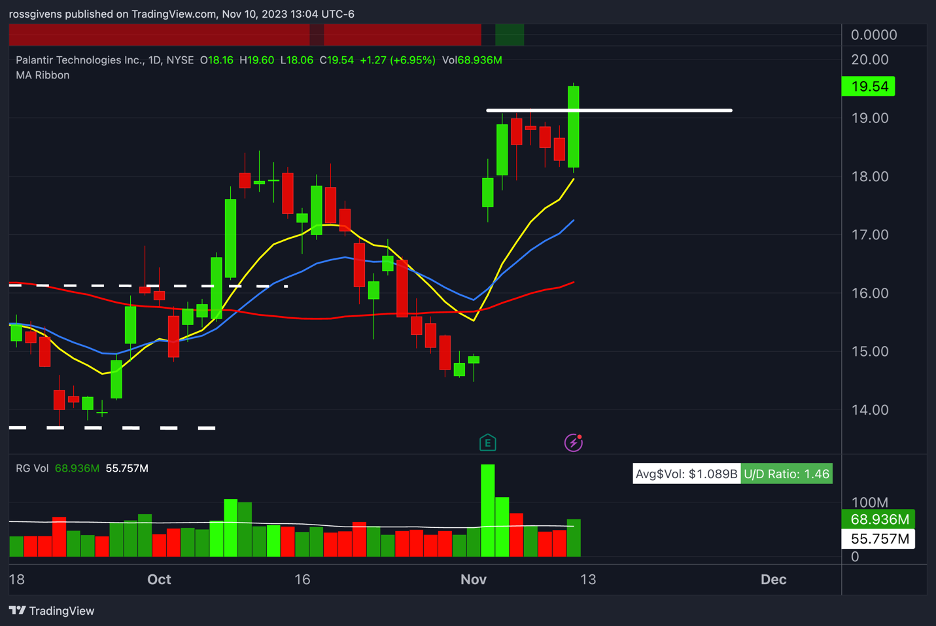
Palantir (PLTR), for example, looks fantastic here. We bought the stock on Friday morning in my Alpha Stocks service.

Palantir is an artificial intelligence company that made huge strides the first half of the year. It has been consolidating for the last few months but is now breaking through its post-earnings pivot and marching toward new all-time highs.

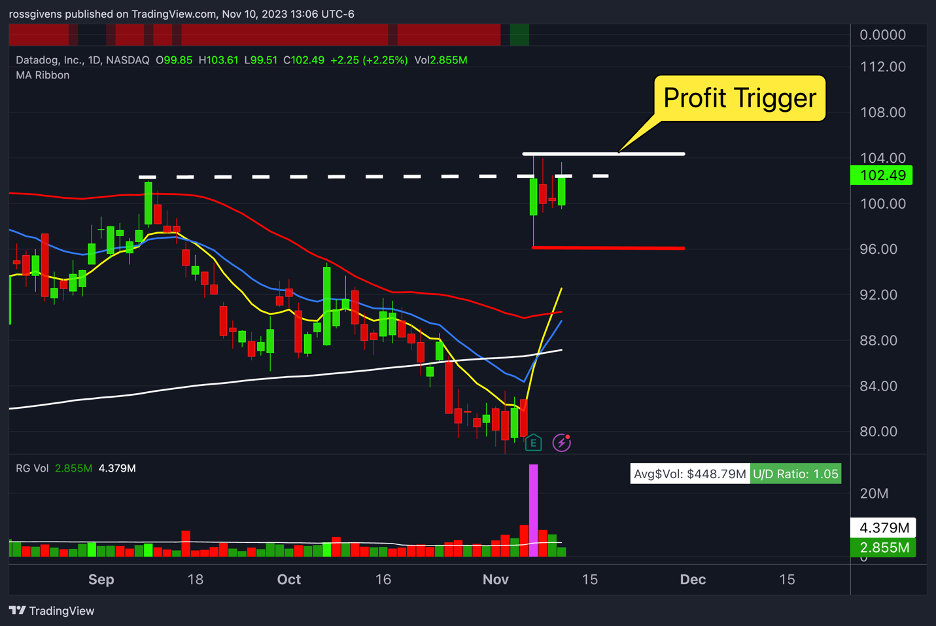
Another stock I like here is Datadog (DDOG)…

Shares trended lower from August to November, falling 30% from peak to trough.

But a strong earnings report put DDOG back in the game. And if shares get above the post-earnings high of 104.50, that could trigger the next leg higher.

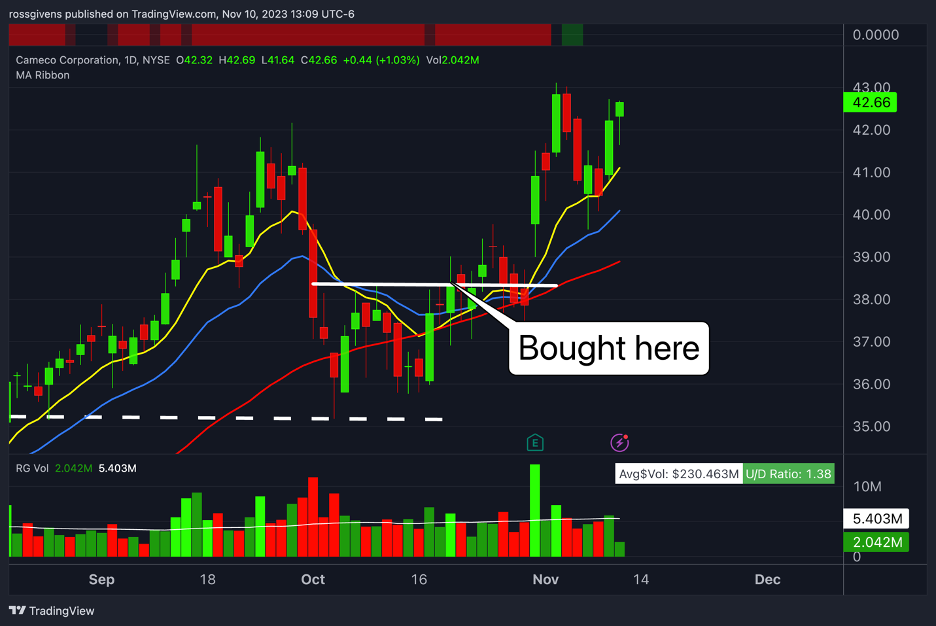
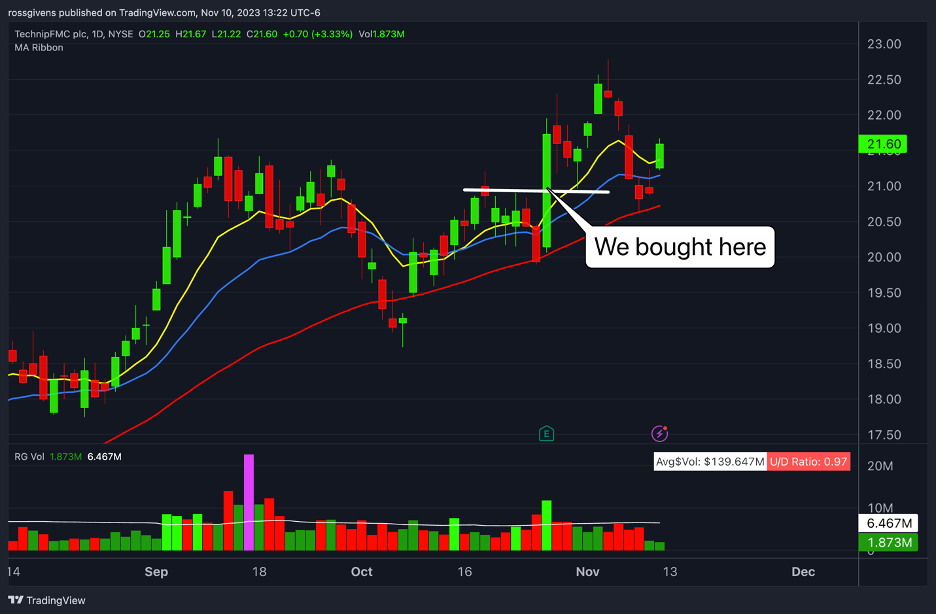
On the energy side, I prefer nuclear and those stocks with exposure to natural gas. Two of my favorites right now are Cameco (CCJ) and TechnipFMC (FTI).

CCJ, as can be seen in the chart above, is pressing against new all-time highs. We are long from around $38 on the low base breakout.

FTI (below) just bounced off its 50-day moving average and looks poised for new highs as well.

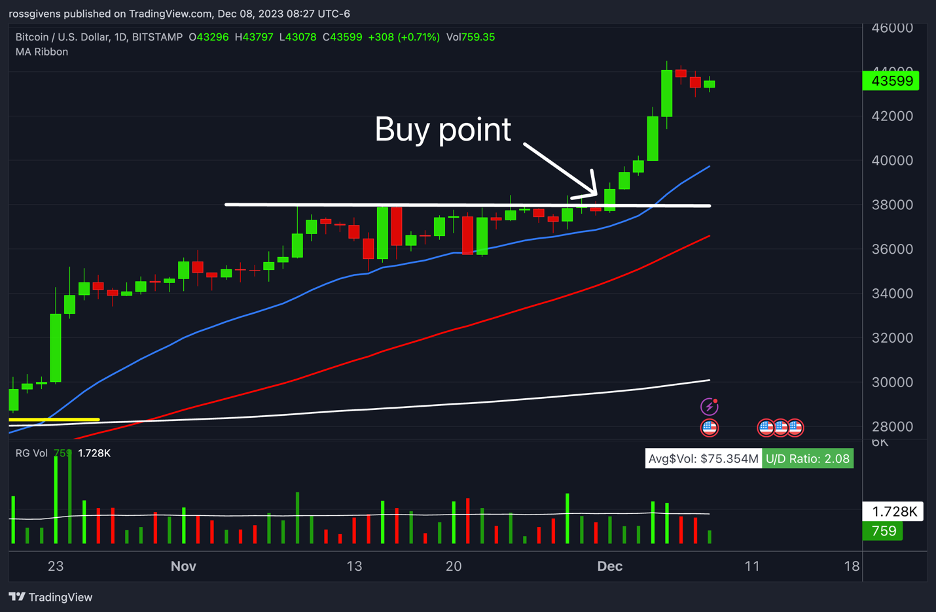
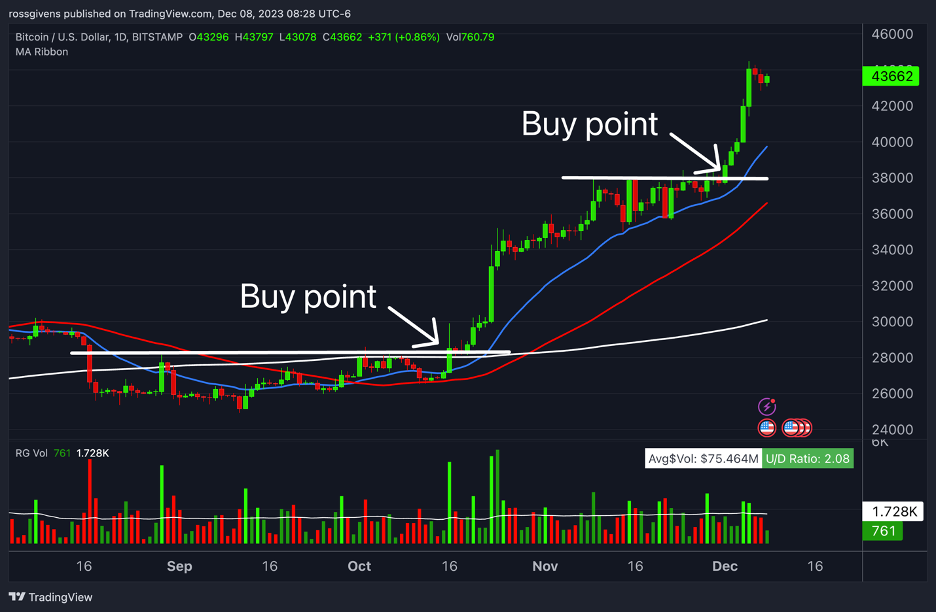
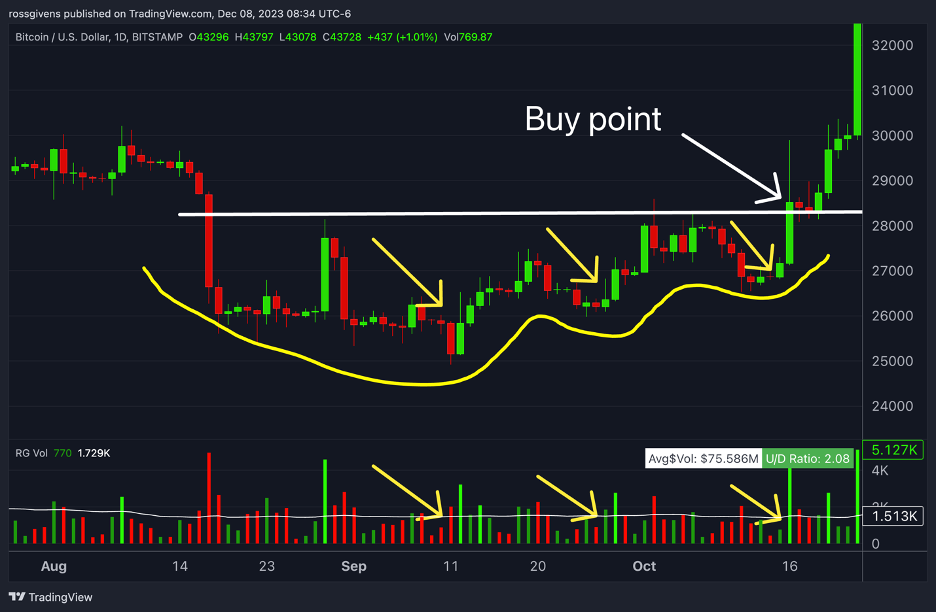
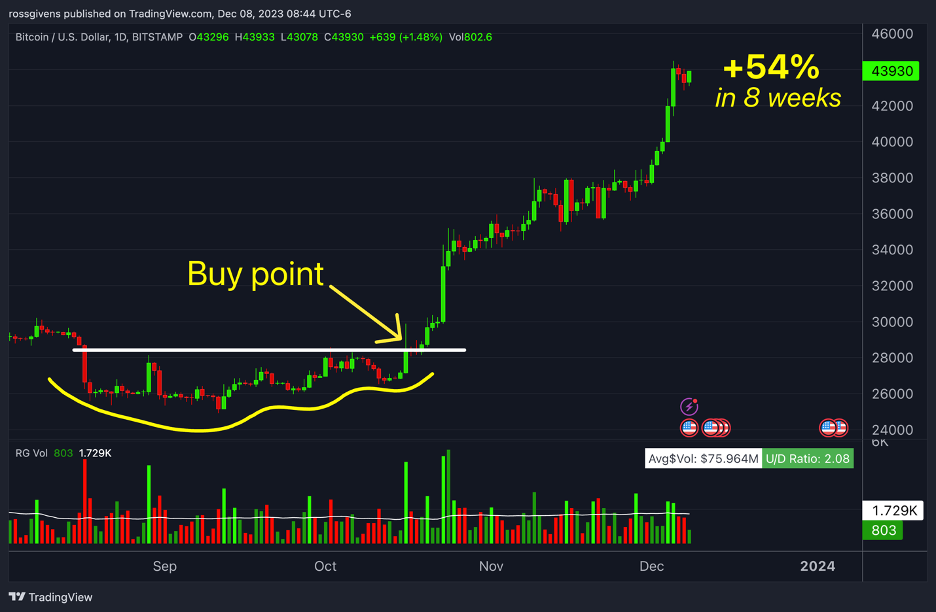
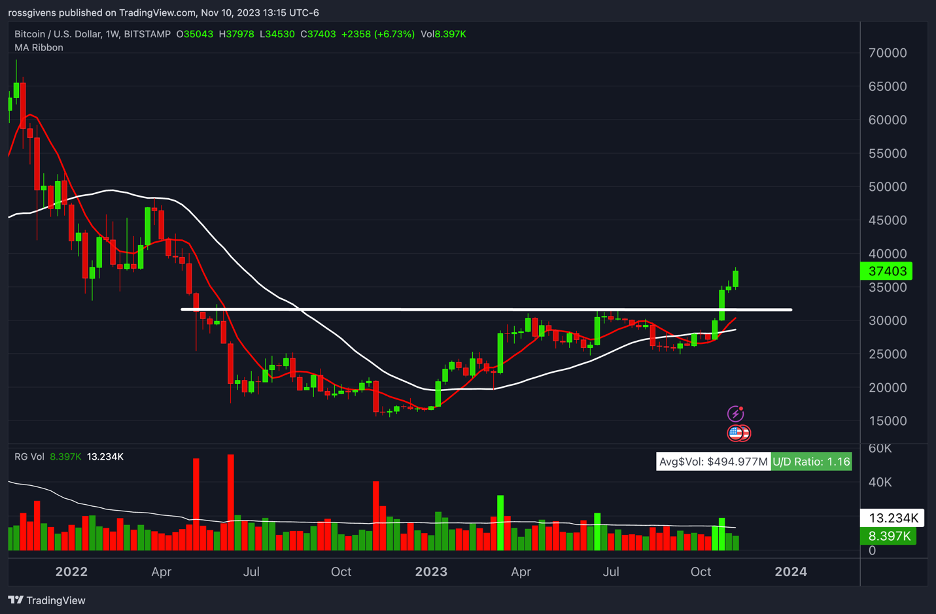
Bitcoin, which I don’t often comment on, looks really good too. The weekly chart below shows BTCUSD breaking out from a textbook stage 1 base on great volume.

I wouldn’t be surprised to see Bitcoin back up around $60k in the next 6-12 months.

That’s all for this week. I will see you in Monday’s live Stealth Trades session at 4pm ET.

Best wishes for your trading,

Weekly Update: This is How Things Have Played Out

Good evening, and welcome to this week’s edition of Stealth Trades!

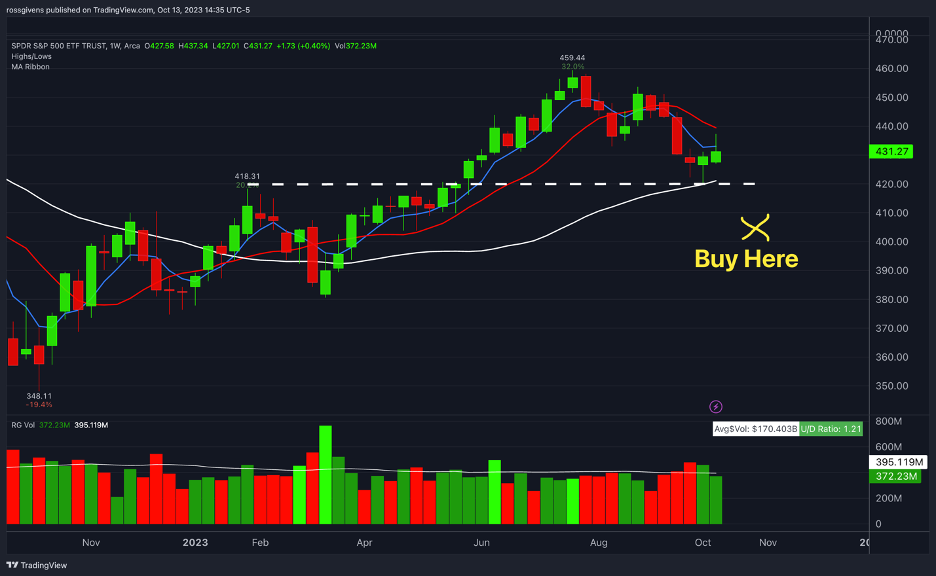
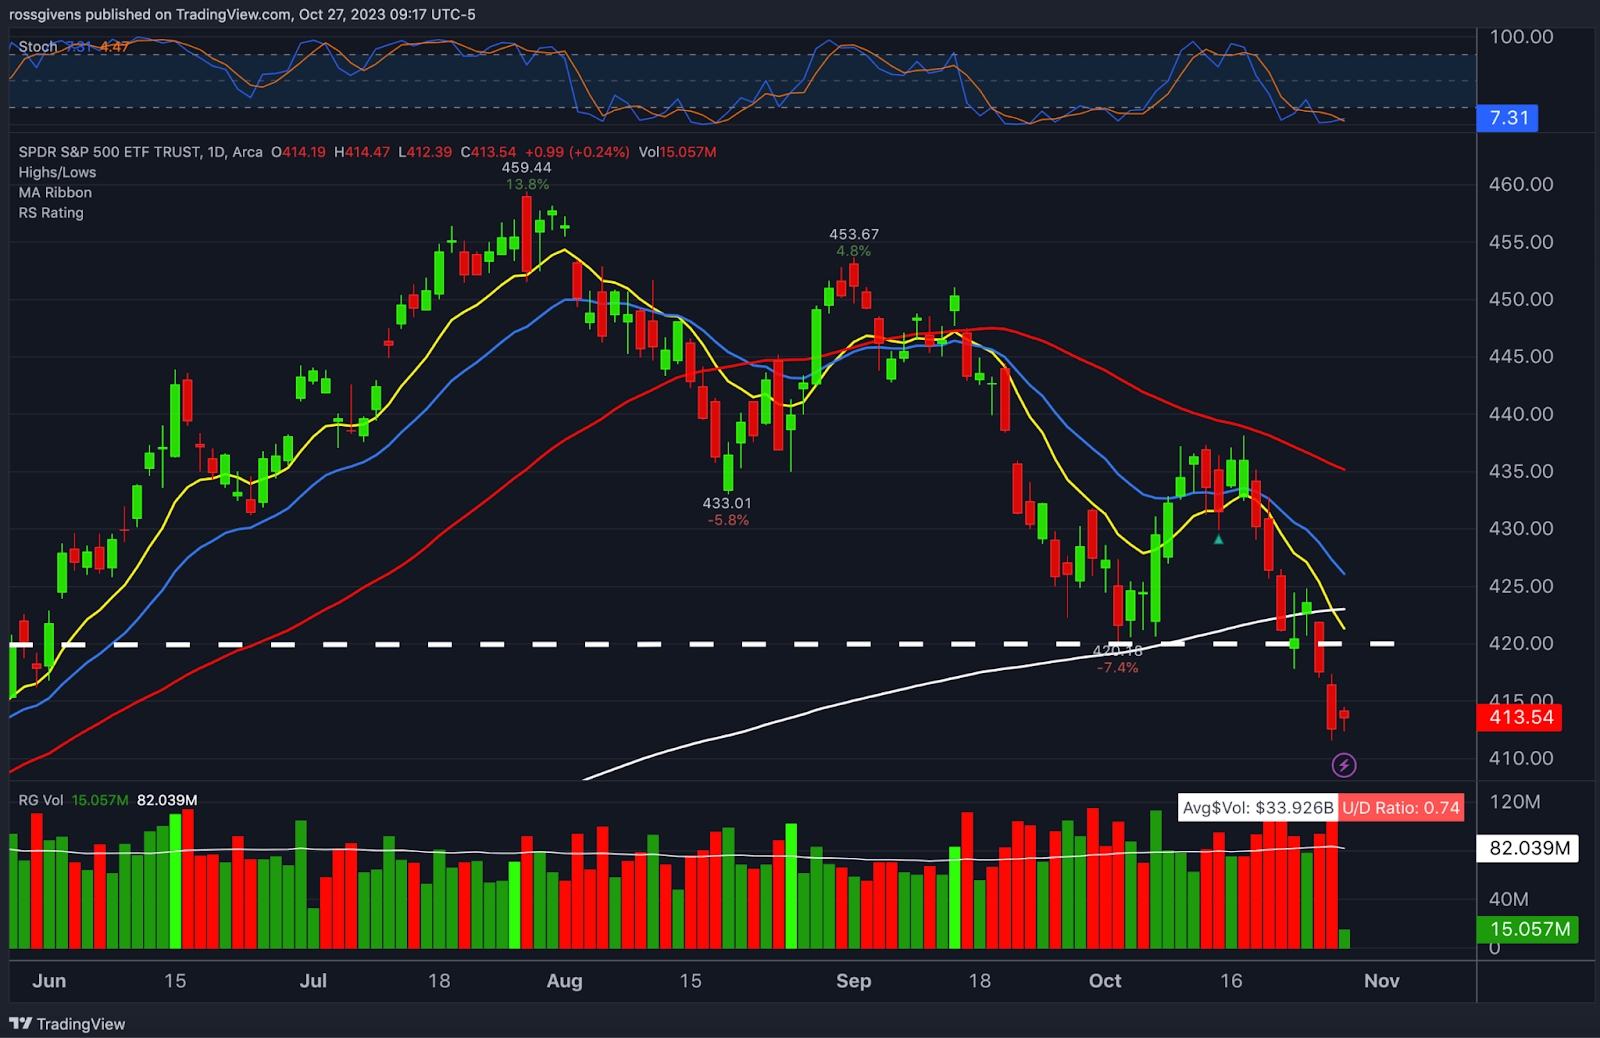
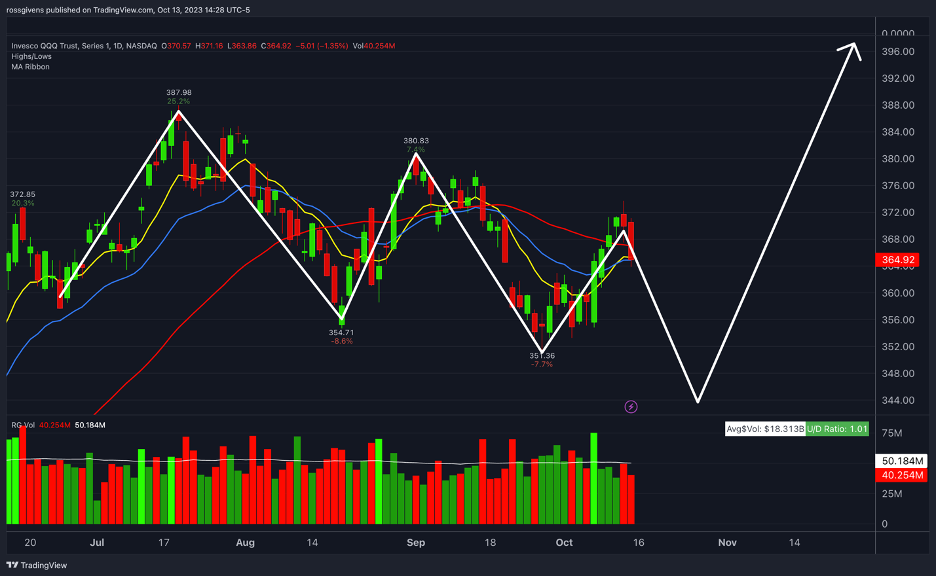
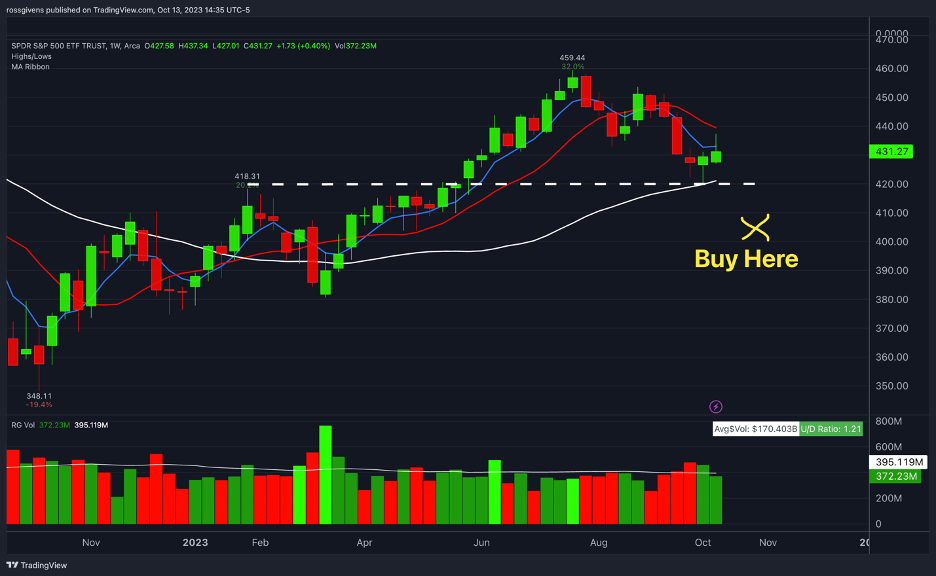
Three weeks ago, in the October 13 Weekly Update email, I included this chart outlining my forecast for the final stage of the market pullback:

I discussed the final flush we were expecting to see that would set up an ideal buy point in the market.

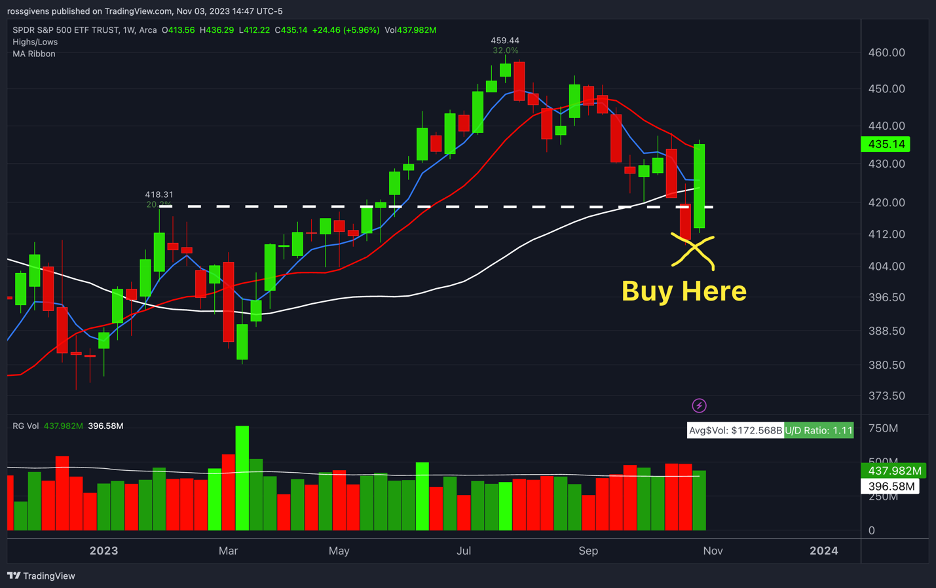
This is how things have played out…

Hopefully you followed our advice, which we reiterated in last week’s email, and bought stocks this week.

If you did, there is a good chance you had a profitable few days.

The S&P 500 rose 5.91% this week – its best week in over a year. The Nasdaq did even better, tacking on 6.53%.

This move caught a lot of traders by surprise. After breaking support at 420 on the SPY (dashed line on chart above), many bulls threw in the towel and gave up hope for a bounce.

But as I discuss regularly, this is precisely when reversals happen.

Bear markets don’t end when the outlook finally turns rosy. If you wait until it is obvious that conditions have improved, you will miss the bulk of the move. Selloffs end when people quit selling… when the last stubborn bull throws in the towel and sells his positions.

This moment of “peak bearishness” is where savvy traders look to buy.

The FOMC met on Wednesday before announcing another rate pause. Stocks rose on the news and the major indexes gapped up then traded higher in the following two days as well.

Fed Chairman Jerome Powell’s language was interpreted to mean that rate hikes are over. The Fed has been looking for signs that growth is slowing, and inflation is coming down to signal that higher interest rates are doing their job to slow growth and tamp inflation.

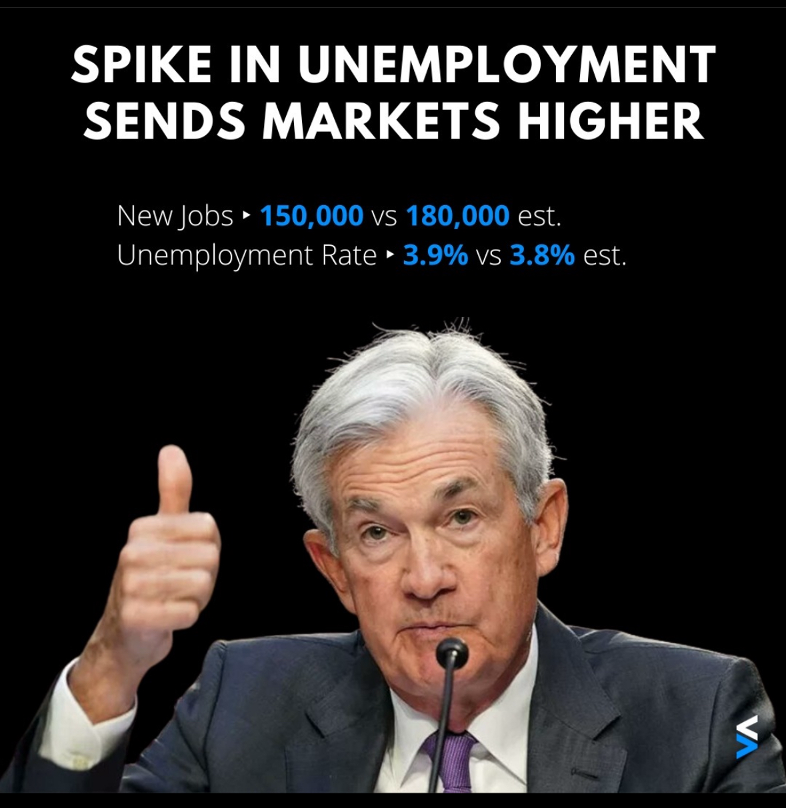
This week they got it…

Image Source: StockTwits via Instagram

It is crazy to think that BAD news for the economy would be GOOD for the stock market, but that is exactly the situation we are in right now.

Higher unemployment is bad. Higher interest rates are worse. Wall Street wants rates lower. And the only hope of that happening is economic pressure.

Last week was our moment of peak bearishness – war breaking out in the Middle East, 23-year high interest rates, record low mortgage applications, slowing housing starts, an uptick in unemployment, and a rapid increase in national debt.

Things looked terrible. But unless they get worse, last week will be the low and stocks should continue to rise from here.

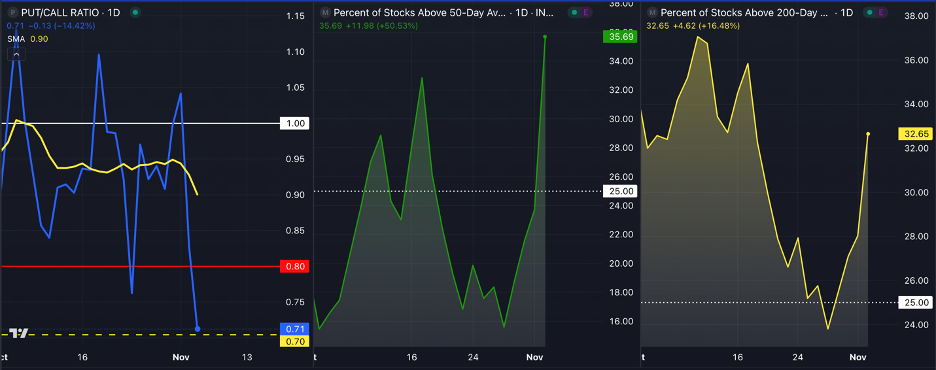
Market internals showed significant improvement over the last five trading days. Below are three key metrics I watch:

The put/call ratio on the left fell dramatically, signaling a shift in sentiment among speculators.

The percentage of stocks above their 50-day moving average in the middle rose from 16% to 36% this week. That means a fifth of the market transitioned into short-term uptrends.

The percentage of stocks above their 200-day moving average on the right also rose from 24% to 32%.

This is exactly what we want to see – a rally with broad participation and a large number of stocks reversing course.

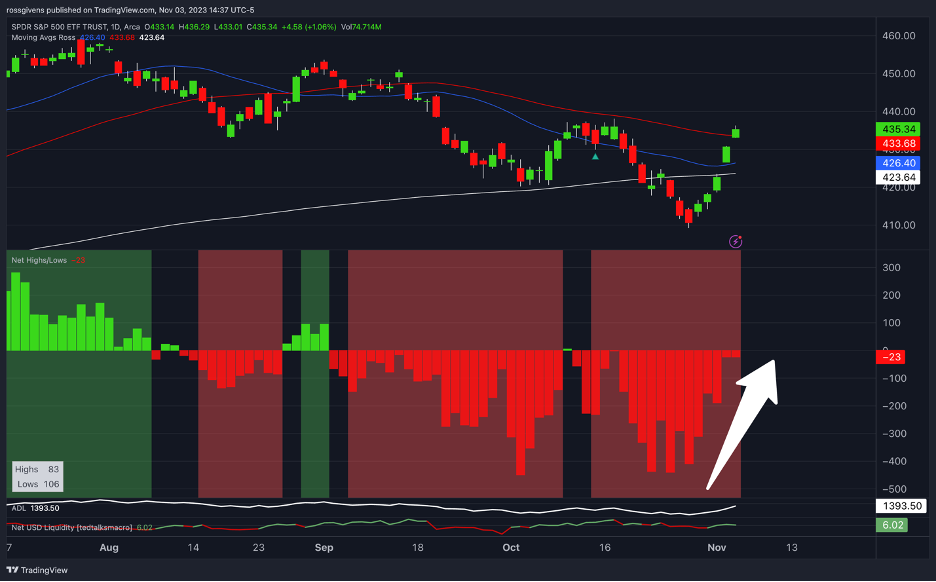
The net new lows also turned positive:

The chart above shows a red number for Friday only because the data had not yet updated at the time of this writing. But more stocks made new highs than new lows on Friday.

Finally, the equal-weighted S&P 500 index (RSP) showed impressive performance this week as well.

For most of 2023, the rally has been led by a small handful of mega-cap names. Apple, Nvidia, Google, Meta, Microsoft, Amazon, and Tesla carry significantly more weight in the major indexes and often hide lackluster performance in the rest of the market.

This week, however, the equal-weighted RSP was up slightly more than the market-cap weighted SPY.

We continue to focus our efforts on the groups and sectors showing the greatest strength. The table below shows the top 5 over the last 1, 3 and 6-month periods.

Natural gas stocks as well as nuclear and uranium names have been clear standouts over the last couple quarters.

This month, crypto is making a move on the back of a wave of new Bitcoin ETF approvals by the SEC who previously rejected them across the board. More and easier access to crypto in IRA and 401k accounts could bring additional demand and trigger the next bull run in Bitcoin.

Defense stocks are moving for obvious reasons as well, but that trend could continue if these wars escalate further.

If you missed this week’s rally, don’t worry. If things play out as I expect, this is just the beginning of a new bull market. Wait for clean setups in strong stocks from the best-performing groups.

And if this rally continues, expect to see breakouts capable of big fast gains.

Best wishes for your trading,
Weekly Update: The Market is Oversold 

Good evening, and welcome to this week’s edition of Stealth Trades!

Stocks finished lower with major indexes down roughly 2% for the week as of the time of this writing on Friday morning.

The S&P 500 now trades below its 200-day moving average – a long-term trend level watched heavily by institutional investors.

It appears that our call several weeks ago saying the high was in for the year will likely hold true.

Right now, the market is highly oversold.

I expect to see at least a short-term bounce higher from here as most stops were likely triggered on the move below 420 on SPY.

Many investors are throwing in the towel. This week’s close below support and the 200-day is something overly optimistic bulls did not think we would see.

But I believe we have a buying opportunity here.

As I outlined last week, my ideal buy point would be around the $400 level after a final flush lower. That is roughly 2% below current prices.

Whether we see a new bull market develop from here or simply a near-term tradable rally is yet to be seen. But I believe there is money to be made over the next several weeks.

The short side is too obvious. The gutsy contrarian play is buying stocks showing high relative strength and coming out of tight patterns.

One area we are still seeing a lot of strength is nuclear and uranium stocks.

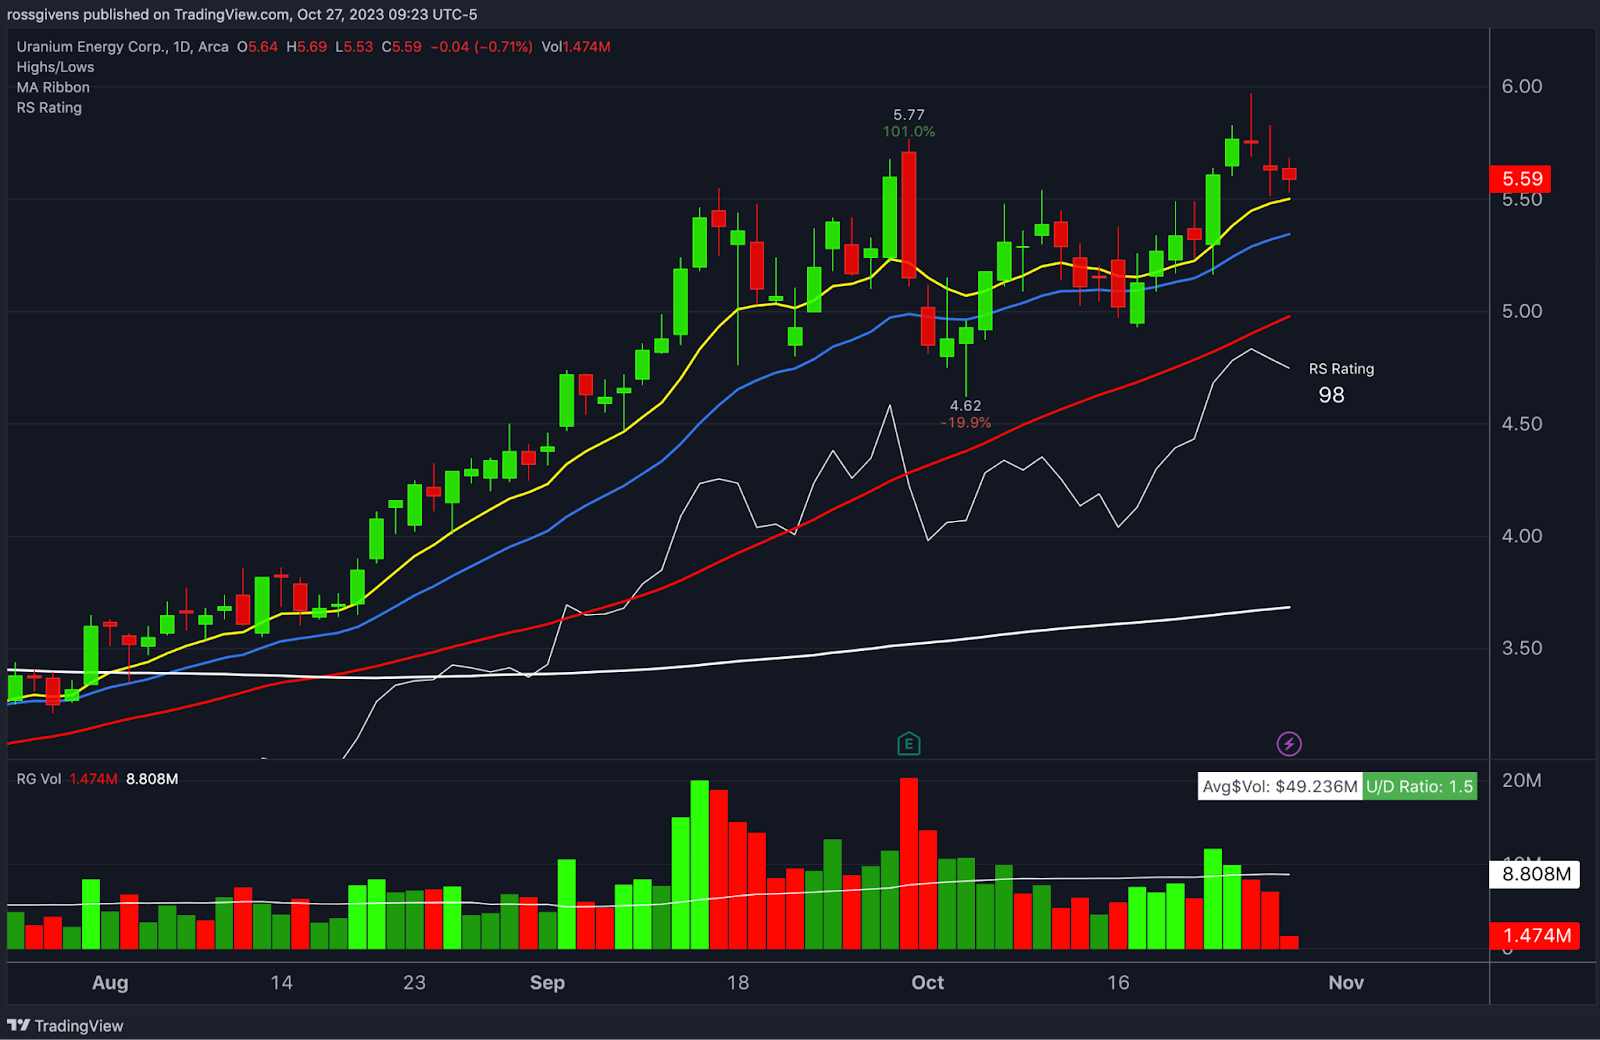
Uranium Energy Corp (UEC), for example, has not only held its short-term 21-day moving average, but it is trading near all-time highs.

It has a relative strength score of 98/100. In other words, it is outperforming 98% of publicly traded stocks in recent months.

UEC looks buyable here or on any pullbacks to its 21 EMA (blue line on chart).

I am out of town in Palm Beach and away from my trading desk until tomorrow morning. I plan to run some scans over the weekend to identify the strongest names that have held up well during the recent pullback and have the greatest chance of moving higher on market strength.

We will be discussing these opportunities in the live Stealth Trades and War Room sessions next week. I’ll see you there.  

Best wishes for your trading,
Weekly Update: Markets Sold Off Further This Week

Good evening, and welcome to this week’s edition of Stealth Trades!

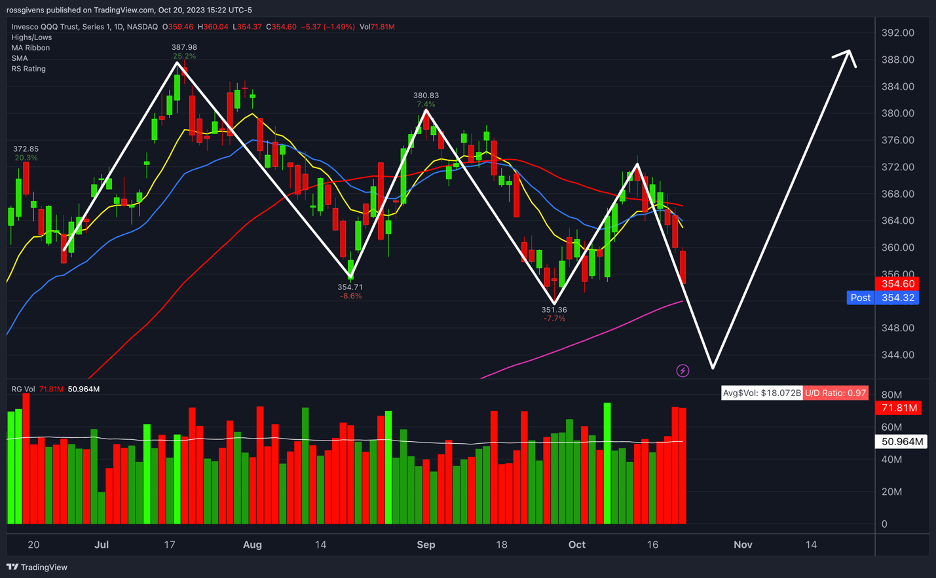
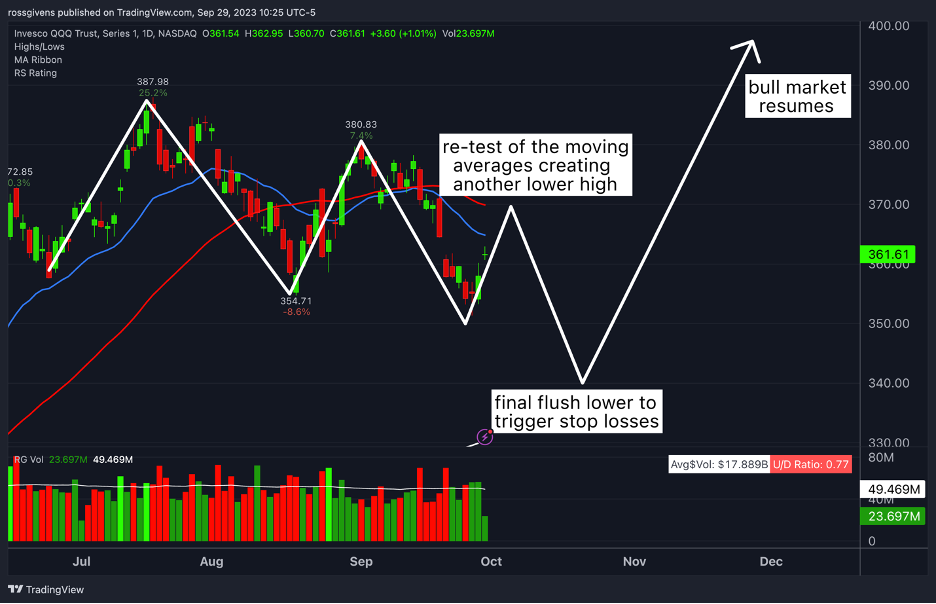
As expected, markets sold off further this week amidst a backdrop of escalating war.

The scenario we laid out three weeks ago continues to unfold as anticipated.

(Forecast from September 29 Weekly Update)
(Nasdaq index as of today)

Internal metrics, which briefly showed signs of a turning point, continued to deteriorate this week.

The percentage of stocks below their 50 and 200-day moving averages sits at 22% and 29% respectively.

In other words, more than 70% of stocks are in long-term downtrends. And unfortunately, this number is still falling.

Yesterday, 642 stocks made relative strength new lows. Only 82 made new RS highs. In addition, 2 and 10-year bond yields are rising, and the VIX just made a new 6-month high.

This led to back-to-back distribution days Thursday and Friday on all major indexes. Distribution, another word for ‘institutions dumping stocks’, exists when the index falls significantly on above average volume.

Back-to-back distribution days is typically a bad sign. If we don’t see quick buying and a substantial movement to the upside in the first few days next week, this will likely lead to the final flush lower we have been expecting to see in the market.

The only sector showing positive performance over the last few weeks is natural gas. FCG, the exchange traded fund composed of natural gas stocks, is up 6.67% on the month.

Hess (HES), Diamondback Energy (FANG), Permian Resources (PR), and CNX Resources (CNX) are all at and trying to make new highs.

These strong moves in energy stocks are more likely a result of wars in the Middle East than they are indications of strength in the US market, however.

Natural gas prices are well off their 2022 peak still, so I wouldn’t be surprised to see a big move in some of the stocks I mentioned above.

Energy is shaping up to be a clear standout in terms of performance.

Nuclear, natural gas, and oil make up the top 3 sectors over the last quarter.

Outside of the energy space, not much looks overly attractive right now. There will be stocks that do very well and even benefit from chaotic times (like defense stocks) but as a whole, I believe the market has more work to do before the next bull can get underway.

Right now, stocks are competing with investors’ ability to park cash in short-term government bonds for a guaranteed 5% yield. That is an enticing offer, especially given the level of uncertainty.

For the time being, cash is king. I have my longer-term money sitting in money markets collecting the aforementioned 5% yield.  But I’m ready to take it off the bench the moment there is a sign that buyers are back.

Best wishes for your trading,
Weekly Update: Things Are Playing Out as Expected

Good evening, and welcome to this week’s edition of Stealth Trades!

Two weeks ago, I posted the following chart in my weekly update. It shows how I expect the rest of the year to play out in the stock market.

So far, things are playing out as expected…

After a short-lived rally into the moving averages, indexes sold off in the second half of this week in what will likely be a final wave lower.

The stock market has a unique ability of embarrassing the greatest number of people.

I talk about this often in live events, but bear markets do not end when conditions finally improve. They end at the moment of peak bearishness – when everyone has given up hope and is sure the market is toast. That’s when we get a bottom.

The level I am watching is 420 on the SPY – an ETF representing the S&P 500 index (white dashed line on the chart below). The significance of this cannot be understated.

First, this is the current level of the index’s 200-day moving average. Long-term and institutional investors watch the 200-day as a proverbial line in the sand to dictate whether the market is trending higher or lower. A close below this level triggers sell orders and limits new buys in many trading systems.

This is also the breakout area from the beginning of the year that led to the strong rally we saw in May and July. A violation of this level means all of those gains have been wiped out.

It should not come as a surprise that the market found support here last week. But I do not expect it to hold.

While I remain bullish on the market over the long-term, I also want to trade the wiggles. That means timing these shorter-term moves in order to make well-timed buys.

If and when the S&P breaks through this level, expect to see a quick flush lower. Lots of investors have stop losses here, either physical or mental ones, and many bulls will likely throw in the towel when the level fails.

But there is opportunity on the other side…

Remember, markets bottom when things look their worst. During the great financial crisis of 2008, stocks did not bottom when economic conditions improved. They bottomed at the peak of the bad news – when everyone believed the sky was falling in March 2009.

In the COVID selloff of 2020, the bottom was made on March 23, 2020 – in the middle right as lockdowns and a wave of overreaching mandates were first made public.

Last year’s bear market found the low on October 13th – the day of the worst inflation report in decades.

In every major market correction, the story is the same. Bottoms happen when conditions are at their worst. So that is when we want to buy.

The final leg lower that I expect to play out over the coming weeks will be just such an occurrence. Auto workers striking, 23-year highs in interest rates, record lows in mortgage demand, war breaking out in the Middle East, a rapidly rising national debt, and a technical sell signal in the major indexes.

This will likely create the peak bearishness moment I am looking for that will flush out the bag holders and trigger the final sales to end this pullback.

And that is where I will be waiting… ready to buy before the next great bull market gets underway.

Best wishes for your trading,
Weekly Update: A Picture is Worth a Thousand Words

Good evening, and welcome to this week’s edition of Stealth Trades!

When it comes to the stock market, I find that pictures, i.e. charts and data, are more valuable than people’s opinions about what could or should happen.

We all have inherent biases based on our own experiences and point of view – myself included.  When I force myself to ignore everything but the data in front of me, my investing results tend to be better.

So, in this week’s update, I want to stick to the raw data. Here is what I am seeing…

The chart below is something I included in last week’s email, but I am showing it again for those who missed it.

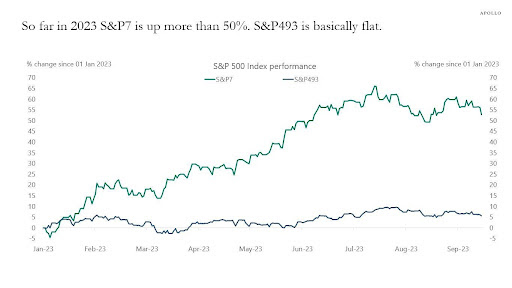
It compares the year-to-date performance of the 7 largest stocks in the S&P 500 (green line) with the other 493 (black line).  

Meta, Apple, Amazon, Alphabet, Nvidia, Microsoft and Tesla all delivered huge gains – propelling the Nasdaq up 48% to start the year. But without the “Super 7” the market was basically flat this year.

In other words, this has been a “fake” bull market seen only in the market cap-weighted indexes.

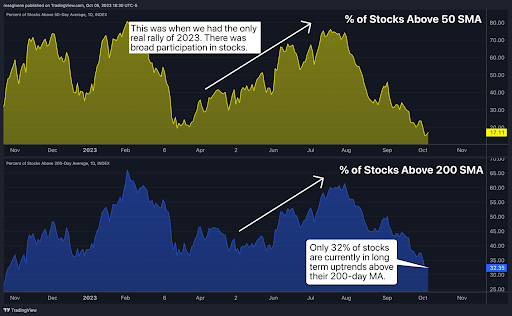
Another metric I like to watch is the percentage of stocks above their respective 50 and 200-day moving averages. This gives a clear view of market participation by revealing how much of the market is in short and long-term uptrends.

The chart above highlights the deterioration that has taken place beneath the surface over the last couple months.

As of today, only 32% of stocks are above their 200-day moving average and 17% are above their 50-day. 

Translation?

The majority of the market is in decline, regardless of what the indexes look like.

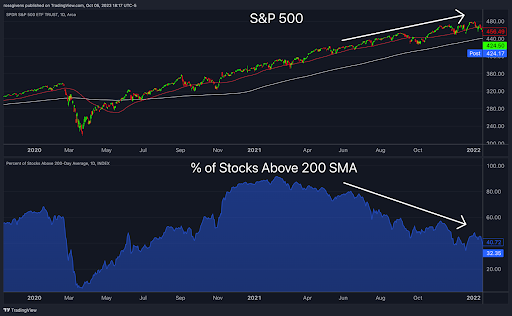
Market participation or “breadth” as it is often referred is a big part of my analysis. The chart below shows the action leading up to last year’s bear market.

As I discussed many times in these weekly updates in late 2021, participation was steadily declining. Even though the S&P 500 index was advancing, most stocks were in decline. By the end of the year, only 32% of stocks were in long-term uptrends.

So, the 2022 bear market was not much of a surprise.

When looking at these breadth readings, the trend is more important than the reading. In other words, I do not care whether 30% of stocks are above their moving average or 70%. What is important is whether that number is rising or falling.

And right now, those numbers are still falling. Until I see them improve, I remain cautious on the general market and holding ample cash.

Lastly, let’s look at the net new highs and lows.

The chart below calculates how many stocks made new highs and how many made new lows across the NYSE and Nasdaq exchanges.

The net reading is then plotted as a red or green bar. A green bar means more stocks made new highs than new lows. A red one shows the opposite.

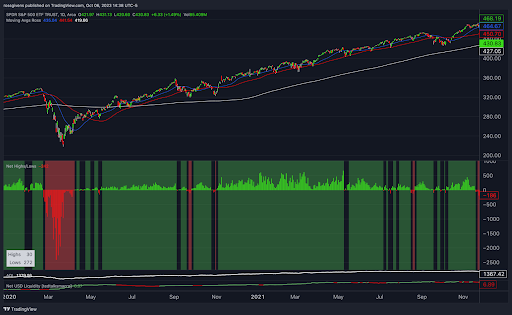
In a healthy market, we should see more stocks making new highs. In the last bull market from April 2020 to November 2021, that is exactly what we saw (see below).

We are seeing the opposite trend right now.

Together, these internal breadth indicators do not paint a rosy picture. Markets are fluid, and this could change at any time. In fact, I expect the bull market to resume before the end of the year.

But if you are trying to time your buys in alignment with the market internals, the verdict is clear – wait for clearer skies.

My analyst Jean and I have been working on an indicator that combines this data to generate a comprehensive market health reading. We are currently testing a beta version, and initial results look promising.

More to come on that in the future.

In the meantime, try your best to think independently… to ignore the headlines and personal biases that influence your expectations for the market.

It is easy to be swayed in one direction by the market action of a single day or week. Today, for example all the major indexes are up over 1% each. It looks like things are turning around. 

Yet stocks made new lows at 10x the rate they made new highs today.

Here’s what I like to do…

Pretend you have been living in the woods for 5 years and have no idea what is going on. What do the charts and the data tell you?

You might be surprised how good your analysis can be.

Today, we are very close to this level. But we have not hit it yet. I expect to see one final flush lower to turn the final bulls into bears.

That is where I will be looking to buy.

Best wishes for your trading,
Weekly Update: The Bull Market was Fake

Good evening, and welcome to this week’s edition of Stealth Trades!

This chart will blow your mind…

It compares the year-to-date performance of the 7 largest stocks in the S&P 500 (green line) with the other 493 (black line).

Meta, Apple, Amazon, Alphabet, Nvidia, Microsoft and Tesla all delivered huge gains – propelling the Nasdaq up 48% to start the year. But without the “Magnificent 7” the market was basically flat this year.

How is this possible?

Indexes are market-cap weighted. Bigger companies like Google, Amazon, and Apple have far more of an impact than smaller ones.

These 7 stocks have been holding up an otherwise lackluster market. In other words, the 2023 bull market was fake.

The chart below shows the percentage of stock trading above their 200-day moving average.

As of today, only 37% of stocks are above their 200-day moving average. In other words, 63% of stocks are in severe downtrends.

This figure has been trending in the wrong direction since the end of July, and it is not the sign of a healthy market. In order to make any real progress, we must see broad participation in stocks.

By contrast, this is what the same chart looked like during the “healthy” bull market in 2020.

So, when is the selloff going to end? Here’s what I expect…

Since topping at the end of the Summer, markets have been choppy and range bound. We have seen a series of lower highs and lower lows as reality and rising rates caught up with stock prices.

Following an ugly September, we are likely due for a short-term bounce higher. This small rally is unlikely to penetrate the 50-day moving average, at which point I am expecting a final flush lower.

This will make the final bulls throw in the towel and hit everyone’s stop losses. Once pessimism sets in… once everyone is bearish and bracing for another bear market, that is when stocks will begin to rise – catching everyone off guard as it always does.

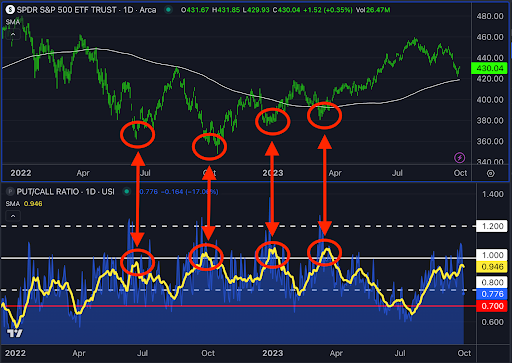
One of my favorite indicators to watch for potential bottoms is the Put/Call Ratio. It measures the amount of put buying versus call buying. When this ratio is high, it is telling you investors are overly bearish and expecting lower prices.

Most think a high put/call ratio is a bad sign. But it is just the opposite. We almost always see a spike in this ratio at the bottom of the market.

Below is a chart of the put call ratio. I have added a 10-day simple moving average in yellow (a tip from John Carter) to smooth out the reading.

For the last two years, this moving average hitting the 1.00 level has been a perfect buy signal.

I have circled each of these occasions on the chart below:

Today, we are very close to this level. But we have not hit it yet. I expect to see one final flush lower to turn the final bulls into bears.

That is where I will be looking to buy.

Best wishes for your trading,
Weekly Update: 3% Mortgages Are Gone – What Lies Ahead?

Good evening, and welcome to this week’s edition of Stealth Trades!

The days of 3% mortgages are over. And we may never see them again.

Those waiting for interest rates to fall back to 2021 levels are in for a rude awakening.

Humans tend to suffer from recency bias – a tendency to overemphasize recent information when estimating future events.

We have been spoiled by low interest rates for more than a decade. Money has been cheap, allowing Americans to borrow for a fraction of what our parents paid for the same debt.

This has fueled prosperity. Bigger houses, nicer cars, and a host of other luxury goods became “affordable” thanks to low monthly payments.

But this is not the norm.

The average 30-year mortgage rate peaked at 18.6% in 1981. For today’s median home price of $439,000 with 20% down, that would mean a monthly mortgage payment of $6,224. And that’s before taxes and insurance.

It’s no wonder our parents lived in 1,300 square foot houses.

At the beginning of 2021, when rates bottomed at 2.65%, that same house would cost you $1,611 per month – almost 75% less!

Saying today’s rates are high is relative and only true in comparison to recent years.

What we are seeing today is a shift in the tides. The shock we have all experienced during the last 18 months of Fed rate hikes is a temporary one. Most people expect them to go back down. They won’t. At least not to where they once were. 7% interest rates will soon be the new normal, and nothing says they cannot go higher still.

On Wednesday, the Fed chose to keep interest rates at their current level. And what Powell said in the press conference did not instill confidence.

He suggested rates would likely remain high for longer than previously expected. He pulled back on plans to cut rates by 1.00% next year and adjusted that to 0.50%. Who knows… maybe he decides to not cut at all.

From a technical perspective, the 10-year yield is emerging from a breakout pattern that would suggest we go even higher from here.

Bill Ackman is a legend on Wall Street. His hedge fund, Pershing Square Capital, manages $18 billion.

He made a lengthy post on Twitter this morning about the state of the financial markets, and I encourage you to read it (just click the image below).

Ackman is one of the sharpest minds in finance. When he talks, Wall Street listens. And so do I.

As for my view on the stock market, my position has not changed. In my August 25th weekly update, the day after Nvidia’s earnings report, I told you why I believed the high was in for the Nasdaq in 2023.

A month later, my analysis seems to be correct. Stocks continue to roll over, and Wednesday’s Fed meeting only added fuel to the fire.

Things don’t look any better under the hood…

Market participation has plummeted over the last 60 days. I measure this by plotting the number of stocks above their 50- and 200-day moving averages.

As of today, 62% of stocks are in long-term downtrends and 78% of stocks are in short-term downtrends.

Yesterday, 239 stocks had relative strength lines making a new 52-week low. Only 25 made a high.

We saw the same thing with stock prices. 184 made new lows. Only 14 made new highs.

The path of least resistance, at least in the near term, is the short side. Rising interest rates, a hawkish Fed, the United Auto Workers strike (which I expect to see more of in other industries), and a weak technical picture all point to a less-than-ideal environment for investors.

The only areas I am seeing strength right now are driven by rising commodity prices.

Uranium stocks like Uranium Energy Corp (UEC), Cameco (CCJ), and Energy Fuels (UUUU) continue to rip higher.

Oil and gas stocks, specifically pipelines and midstream companies like Energy Transfer (ET), are also making highs.

For those readers open to shorting stocks, here are a few names to look at:

Applied Materials (AMAT)

AMAT has been a strong performer this year, but the stock is showing signs of rolling over.

After failing to find buyers at the previous high, AMAT has collapsed through its 50-day moving average and is now forming a shelf at previous support.

A stock can only hit a level so many times before breaking through. This marks the fifth test of the $135 support area. A lot of people are going to have stop losses here.

If AMAT breaks below this level, watch for the price to fall rapidly.

Dicks Sporting Goods (DKS)

DKS is toast.

After a hideous earnings report, the stock fell 24% in a single day on its highest trading volume in over a year.

This is clear institutional selling.

Even worse, the stock has been unable to rally after the drop. If there was any demand for DKS shares, investors would be buying in this 24% off sale.

They’re not.

In fact, each mini rally is weaker than the last – a sign that it is finding fewer and fewer buyers. Once the value suckers have depleted their capital, DKS is likely to capitulate even further.

On a weekly chart, the picture is even clearer:

The biggest weekly decline on the highest weekly volume almost always leads to a new Stage 4 downtrend.

Nvidia (NVDA)

I realize it may seem controversial to short what has been the leading stock in this year’s bull market. But when the whore house gets raided, even the piano player goes to jail.

As I mentioned earlier in this update, market participation is degrading. This bull market has been driven by big moves by some of the largest stocks which have artificially pushed the market cap-weighted indexes higher.

2/3 of the market has quietly rolled over and now sits in a defined downtrend. Nvidia cannot prop up the market forever.

NVDA peaked on August 24 following its quarterly earnings announcement. It reported huge beats in both sales and earnings as well as higher forward guidance and a $25 billion share buyback.

It wasn’t enough. The stock has been falling ever since.

Institutions are using this final piece of good news to exit their positions and take profits on the trade. Once they are out, the stock has a long way to fall.

Best wishes for your trading,
Weekly Update: The Chop Fest Continues

Good evening, and welcome to this week’s edition of Stealth Trades!
The chop fest continues. After rising slightly in the first part of the week, the Nasdaq sank Friday to wipe out this week’s gains and then some.

Most of Friday’s selloff was caused by a flight from growth. Stocks that have led the 2023 bull market fell by several percent each.

As I write this an hour before the market closes on Friday, Super Micro Computer (SMCI) is down 7.8% on the day. Nvidia, Broadcom, C3.ai, and the other big names were also down several percent.

As I’ve said many times, it is important to keep an eye on market leadership. There will be 5-10 stocks in any bull market leading the surge. This year, Nvidia (NVDA) has been the clear leader. And right now, it is not healthy.

As I detailed in the August 25th weekly update, the stock began showing signs of topping and that has continued.

In case you missed that email, Nvidia reported better-than-expected earnings and sales numbers on August 23. They also raised guidance and announced a $25 billion share buyback. All of these things should have sent the stock higher.

And initially, it did. NVDA gapped up to open 6.5% higher the following day. But the stock immediately sold off.

This is a clear sign of heavy institutional selling. And when the big guys head for the exits, it’s usually not long before the stock crashes.

Today, NVDA broke another level of support. Even at a 12% discount from its highs, the stock has been unable to entice new buyers.

If we see another day or week of heavy selling – a big drop on above-average volume where the stock closes near the low of the session – that will be the final straw for NVDA, and investors should look out below.

We are currently short this stock in my Alpha Stocks service with a 5% profit and growing.

Not everything is falling, however. Oil and gas stocks, which I highlighted as an area of strength last month, continue to make upward progress.

XPRO, an energy stock we own, made a new 52-week high today.

The uranium market is also very hot. Cameco (CCJ), Nexgen Energy (NXE) and Uranium Energy (UEC) are all soaring.

I wish I owned these stocks. I don’t. But I will be looking for a chance to buy them on a pullback.

In the meantime, here are two stocks setting up for potential breakouts that may be worth a look:

Wayfair (W)

Wayfair is the kind of stock you can make a lot of money on by catching the early move. It has household name recognition, trends well, follows the traditional growth stock stages, and is both large enough to attract institutional investors while still being small enough to deliver triple-digit gains.

The daily chart above may not look like an ideal setup at first glance. But I believe the failed breakout in August was a premature move held back by weak market conditions. The weekly chart below shows the significance of this level over the last two years.

Below is a simple stage analysis of Wayfair stock over the last cycle:

Wayfair bought the branding rights for Bed Bath & Beyond on the cheap when it went into bankruptcy earlier this year. This re-brand could be the fresh start the company needs to jumpstart sales growth and trigger a new Stage 2 uptrend in the stock. I will consider buying on a move above $75 per share.

Root, Inc. (ROOT)

ROOT is an app-based insurance company offering home, auto, and renters insurance in all 50 states. With a market capitalization of just $156MM, it is below the small-cap threshold making this a micro-cap stock. 

In other words… It’s small. But it wasn’t always. The company was worth roughly $6 billion when it IPO’d in 2020 – roughly 400X larger than its current valuation.

But the stock is showing serious signs of a turnaround. There was a huge volume breakout in June when shares shot from $6 to $14 in one day. A move that extreme needs to be digested since profit taking is almost guaranteed to weigh on the price over the short term. 

After a series of shallowing retracements which I have highlighted on the chart above, ROOT is setting up for a potential breakout higher. I want to see a break of the most recent highs near $12 to give the best odds of success.

If the breakout is valid, it should take off and not look back. Traders could use a 10% stop to give it a little room to work but don’t give it too much rope. This is a volatile stock that can make big fast moves in both directions.

Best wishes for your trading,