Weekly Update: Nvidia Continues to Lead the Market

Good evening, and welcome to this week’s edition of Stealth Trades!

Nvidia continues to defy all odds. Despite the historical precedent for leading stocks to fall after a stock split, NVDA went up another 9% this week.

A 9% move without news is a strong move for any stock. But for a $3 trillion dollar behemoth… it’s almost unheard. The company is worth $300 billion more than it was last week for no reason at all.

The activity we are seeing right now is the Dot Com Bubble 2.0. In the late 1990s, internet stocks soared in a bull market frenzy as investors chased the hot new thing. Qualcomm went up 2,619%. Yahoo, Intel, AOL and other internet stocks skyrocketed, leading to an 85.6% gain in the Nasdaq Composite index.

Today, the hot new thing is artificial intelligence, and Nvidia is the clear front runner. The stock is already up 170% year-to-date.

Since the indexes are market cap weighted (bigger companies have more impact), NVDA’s move has pushed the markets higher. The S&P 500 has a 13.9% gain for the year, making 2024 the best start to a presidential election year in history.

Another similarity to the Dot Com bubble is narrow market breadth. The bull market is being fueled by a small percentage of stocks. Nvidia alone is responsible for more than a third of the S&P 500’s gain this year.

The chart below shows the Nasdaq Composite index in blue above the percentage of stocks above their 200-day moving averages in white:

All things being equal, we should see these metrics move together. But over the last two months there has been a divergence.

The market is marching to new highs, but participation has remained stagnant. Only 55% of Nasdaq stocks are in long-term uptrends. Almost half trade beneath their 200-day average.

The advance decline line, shown in blue in the chart below, is also weakening.

Do not misinterpret this as a bearish signal. I do not expect the market to crash. I am simply pointing out where this market strength is coming from.

Traditional bull markets are easy. Everything goes up. Your only job is to pick which stocks will go up the most.

Narrower bull markets like this one are more selective. Traders must stay in tune with the theme of the market and focus on the names showing high relative strength.

Will there eventually be a major crash in AI stocks? Without question. But that could happen in 3 months or 3 years. As the saying goes, “Ride her ‘til she bucks you or don’t ride at all.”

More than half the leading market groups over the last 4 months are AI-related.

Semiconductors is the obvious one, but crypto is tied to this move as well since rapid improvements to processing power allows miners to be more efficient and profitable.

We are also seeing clean energy show up across the board as data centers struggle to power their operations on the outdated power grid. Expect to see nuclear-powered data centers become the norm in the years to come.

One way to play this is with a stock like NuScale Power (SMR):

The company builds advanced small modular reactors designed specifically to power AI data centers.

The stock is currently on the move. We own it in my Alpha Stocks service from $6.70, but I expect it to go much higher.

Following a brief consolidation in April and May, SMR broke out through the $7 area and is trending higher. In my opinion, SMR is buyable on any pullback to its 21 and 50-day moving averages.

It is a volatile stock, so don’t expect a quiet ride higher. But with a current market cap of just $2 billion, SMR could easily deliver a double from here.

Best wishes for your trading,

Weekly Update: NVDA Stock Split – What to Expect

Good evening, and welcome to this week’s edition of Stealth Trades!

NVDA stock is up 1,000% since the October 2022 lows…

Nvidia has cornered the market on AI semiconductor manufacturing. They sold $80 billion dollars’ worth in the last 12 months.

Sales are up 208% this year. And earnings grew by an astonishing 686%.

The market has never seen growth like this from a company of this size. And some investors seem to think no price is too high for record-breaking numbers like these.

Nvidia stock will undergo a 10-for-1 split before it begins trading on Monday. For every $1,200 share of NVDA stock you own on Friday, you will see ten $120 shares in your account on Monday.

This is common with big growth stocks. Without a split every few years, the share price would be out of reach.

Warren Buffett’s Berkshire Hathaway stock has never split. BRK.A shares currently trade for $625,000 apiece.

There is a lot of hype surrounding the NVDA split. Many retail traders expect the event to be a boom for the stock price since more investors will now be able to buy it.

I understand the thought process. But they’re wrong…

Nvidia is worth over $3 TRILLION dollars today. The impact of retail buying on this stock is negligible. Only large institutions wielding billions in buying power will have any effect on NVDA’s share price.

Historically, stock splits actually cause stocks to go down – at least in the short term.

Looking back over the last twenty years you will see that most of the big names (Amazon, Apple, Google, etc.) see the price drop in the weeks after a split takes place.

Amazon fell 17% in two weeks after a 20-for-1 split in 2022. Apple did a 4-for-1 split in 2020 and dropped 23%.

It doesn’t happen every time. But more often than not, when a leading growth stock undergoes a stock split, the near-term move is down… not up.

Needless to say, I wouldn’t buy NVDA next week. If anything, I would try to short it with a stop loss above the highs.

But what about the rest of the market? NVDA now makes up 8.22% of the Nasdaq index and 6.64% of the S&P 500. This one stock is responsible for more than a third of the index’s growth this year.

So, if it falls, don’t expect to see much progress in the rest of the market for a week or two.

Instead, it might be time to focus back on crypto.

Bitcoin, which is largely uncorrelated from the stock market, appears poised for another move higher.

Members will recognize the breakout pattern playing out on the chart above.

Bitcoin has a history of making strong moves after consolidations like this. Being driven by nothing but supply and demand, it tends to trend better without the interference of earnings and other corporate events like stocks have.

Three of the last four such patterns delivered nice gains (see chart below):

A fifth wave is not out of the question.

In fact, if we step way out on a monthly chart and put it in logarithmic scale to smooth the percentages…

This could be a monster move.

And thanks to new Bitcoin exchange traded funds, it is easy to take a position in any regular or retirement account. The most liquid options are GBTC, IBIT, BITO and ARKB.

Anything could happen. The past is not a perfect predictor of the future. But at these levels, I would bet on Bitcoin over Nvidia here.

Best wishes for your trading,

Weekly Update: The Biggest Market Trends Right Now

Good evening, and welcome to this week’s edition of Stealth Trades!

As an active investor, it is easy to get caught up in the daily or even hourly movements of the market.  Sometimes I have to take a step back, switch over to weekly charts, and realign myself with the major investment themes.

Remember, institutions are buying stocks they can hold for several quarters or years. If they are steadily investing in a particular area, you will see it on the chart.

Here are a few of the biggest trends in the market right now…

Construction

Above is a chart of PKB – the Invesco Building & Construction ETF. It doesn’t take a genius to see the trend here.

The sector is up roughly 70% over the last two years and climbing.

There have been a few pullbacks along the way. Each of these occurred after bad interest rate news.

America has a major lack of housing supply. This has driven used home prices up and, in a lot of areas, made new construction the only game in town.

Rates need to come down sooner than later to keep this going. That is the only major risk I see in this sector – it will fluctuate lock and step with Federal Reserve interest rate announcements.

Here’s another one:

Gold

The yellow stuff is on the move. Gold prices are up almost 50% since the market lows in October to new all-time highs.

Personally, I think we will see gold at $5,000 an ounce in the next few years.

This breakout is 13 years in the making.  And if history repeats itself, this could be the beginning of a new gold super cycle.

Silver is getting legs too…

Precious metals almost always move together so no surprise here.

Silver peaked at $50 an ounce back in 2011. Today it trades for $31.

Artificial Intelligence

This is the obvious theme we have seen play out over the last two years. AI is having its “dot com” moment and leading this market rally.

NVDA, SMCI, and several others in this space have delivered huge gains already. But there are plenty of smaller and backdoor plays into this area. One of those backdoor plays is alternative energy.

The bottleneck for AI is not computers. It’s power. 50-year-old city grids simply cannot supply enough electricity to run these massive data centers.

Big tech is beginning to vertically integrate by making their own power.

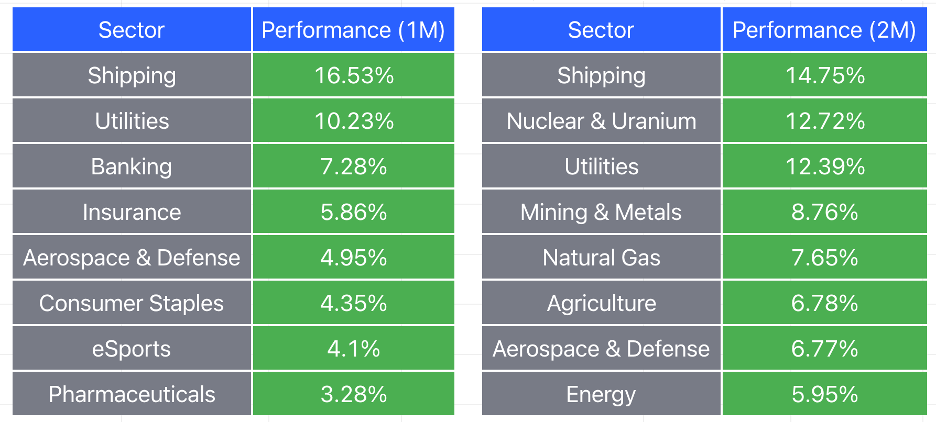
Look at the top-performing areas of the market over the last 30 and 60 day periods:

Solar. Clean energy. Nuclear.

Nuclear is an area I have been talking about for a couple months. In fact, I featured one of my favorite stocks in that group in last week’s edition of this email.

The ticker is SMR, and it is up 20% since I wrote about it last Friday.

Don’t sleep on solar either. When that sector gets hot, it can fly. Below is a chart of TAN – the Invesco Solar ETF.

The whole sector quadrupled in 2013. It did even better in 2020. If this group continues to outperform, you want to pay attention.

That’s all for now. See you in next week’s live sessions.

Best wishes for your trading,

Weekly Update: Shipping Stocks Are Soaring

Good evening, and welcome to this week’s edition of Stealth Trades!

The stock market is back!

I have been talking the last couple months about how we were due a pullback.

After a relentless march higher, it was long overdue.

And as you know by now, short-term dips are actually healthy for stocks. They give the market a chance to “digest” the move and rid itself of weak-handed sellers.

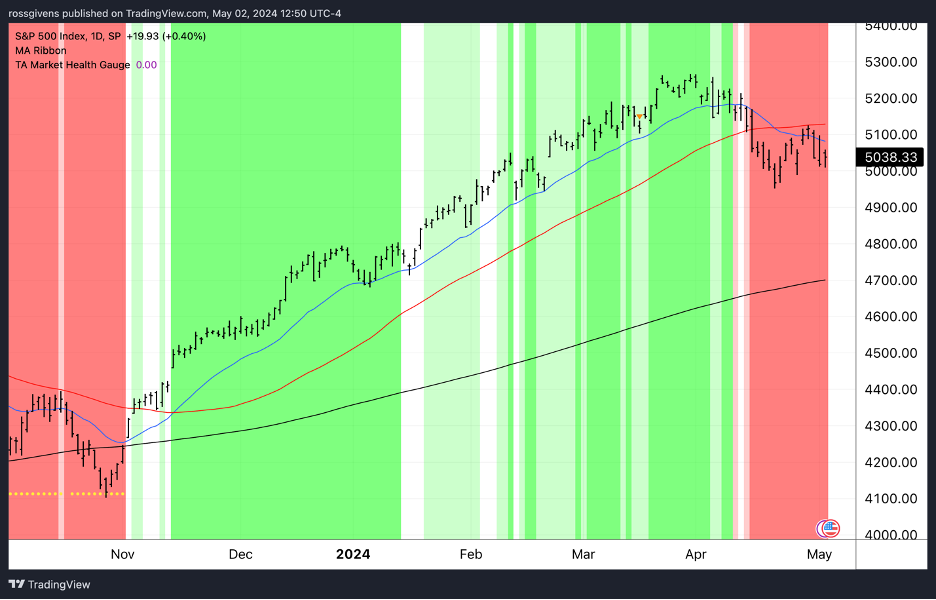
In just a week, our market health model has gone from fully bearish to fully bullish.

This is an impressive show of strength and exactly what we want to see – strong buying in response to the dip.

Right now, the shipping sector is showing the greatest strength. This has been the leading group for the last two months.

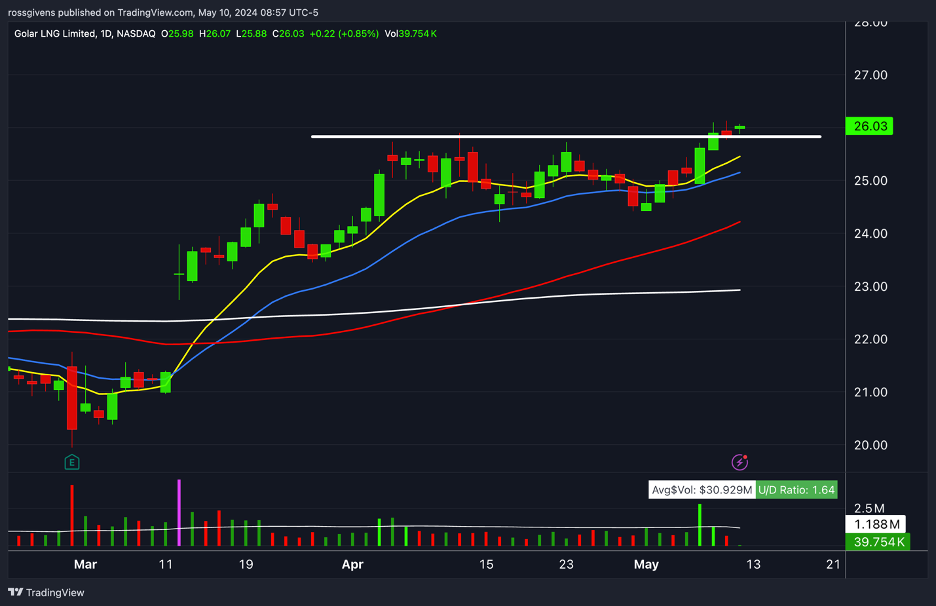
We bought Golar LNG (GLNG) in our Alpha Stocks service a few days ago. This is a mid-cap marine shipping stock coming out of a consolidation base and breaking out higher.

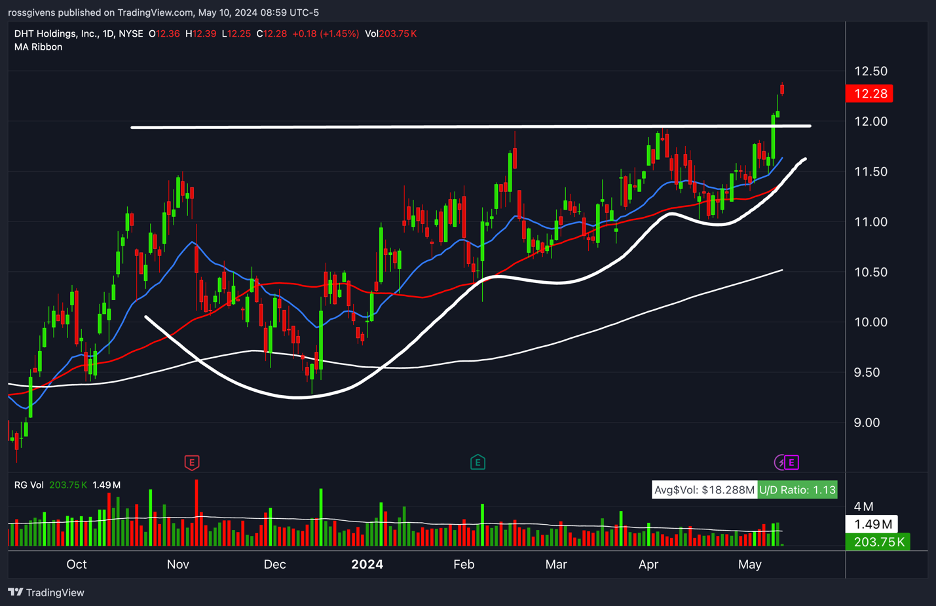
DHT Holdings (DHT) is another marine transport stock that looks good here (see chart below):

It is scheduled to report earnings on Tuesday. But if I was a betting man, I would wager they beat expectations.

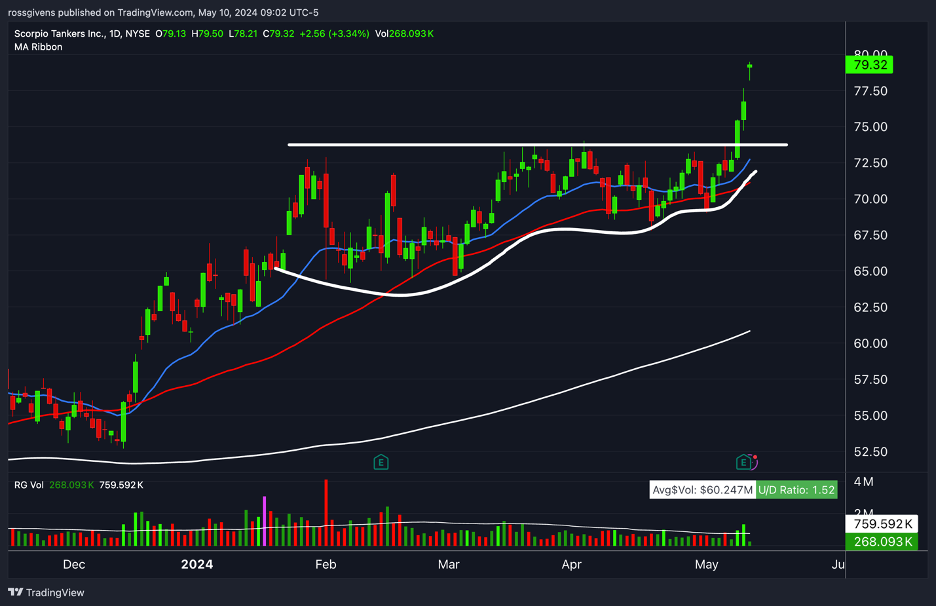
Scorpio Tankers (STNG) reported better-than-expected numbers on Thursday triggering a breakout from a similar pattern:

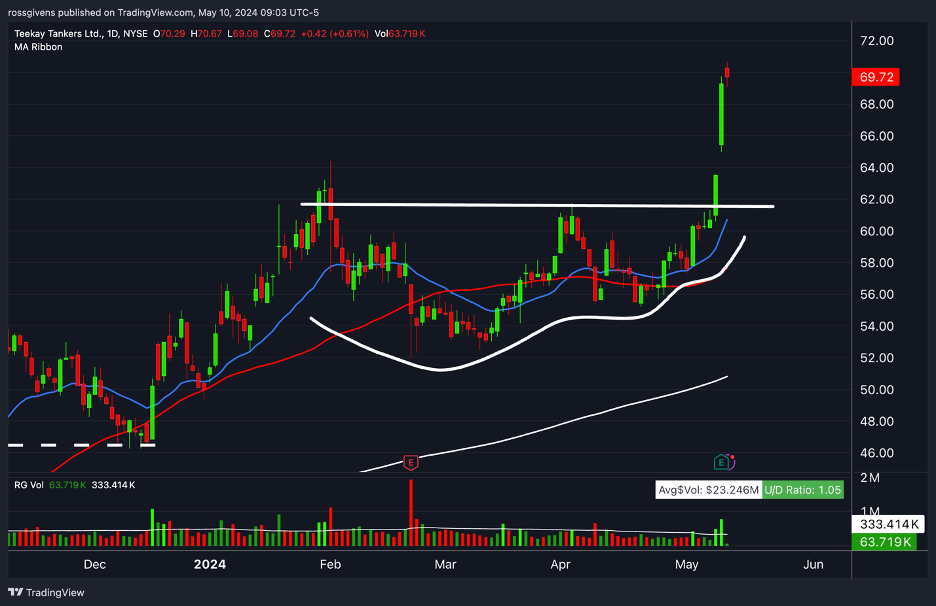
So did Teekay Tankers (TNK)…

Safe Bulkers (SB) and Overseas Shipholding Group (OSG) also look extremely strong here, and both are ripping to new all-time highs.

Beneath the surface, everything looks strong.

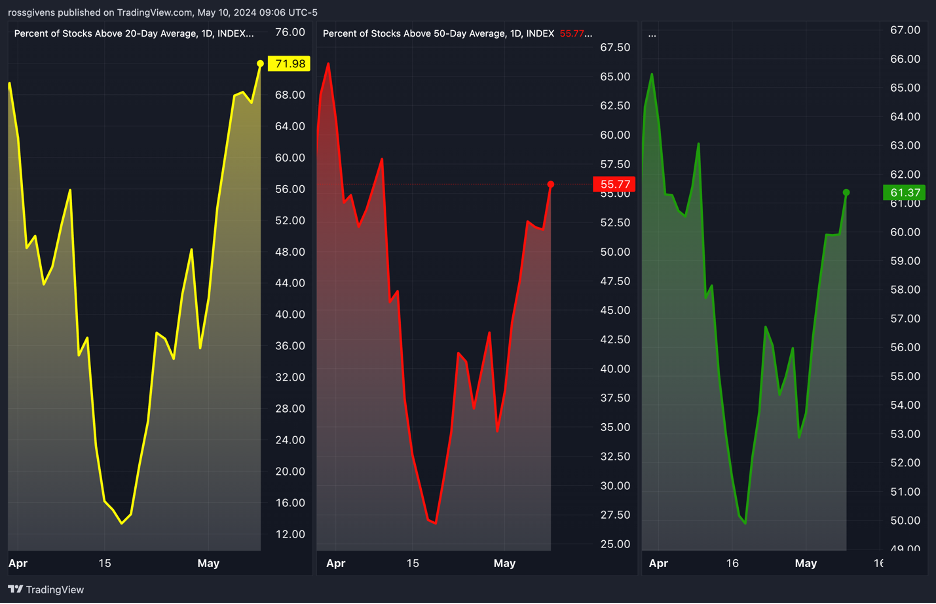
The percentage of stocks above their 20, 50, and 200-day moving averages have been steadily increasing for the last three weeks.

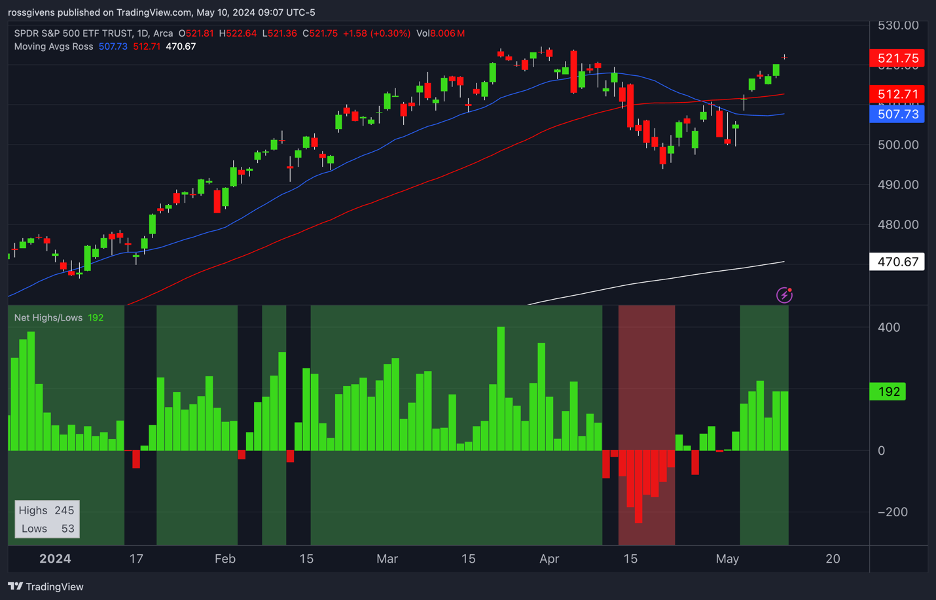
We have also seen 7 straight days of more stocks making new highs than new lows:

As of Friday morning, at the time of this writing, the S&P 500 index trades within 0.5% of its all-time highs.

Given the strong price action, robust market internals, and standout strength in the shipping sector, this is when I would be stepping on the gas.

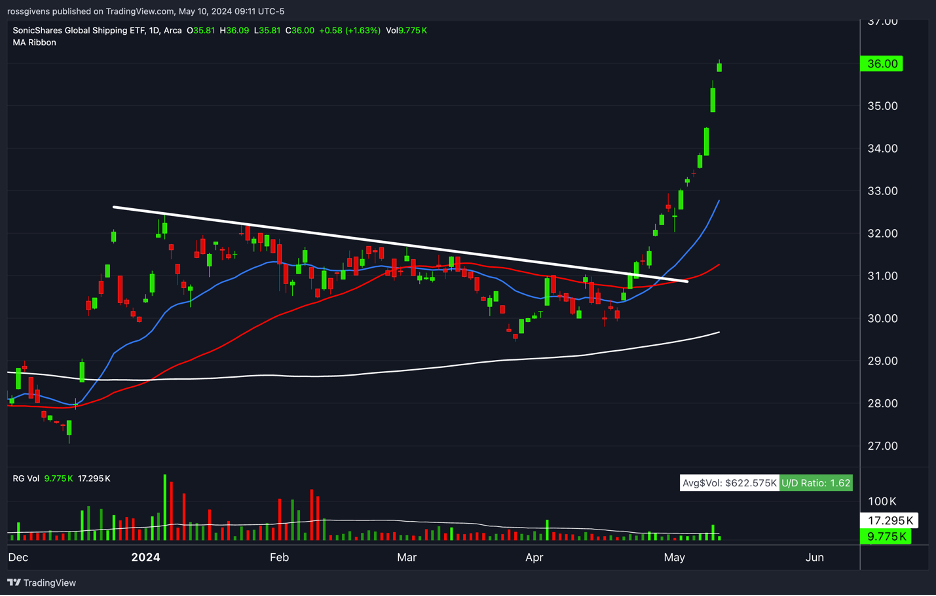
BOAT is the ticker symbol for the global shipping ETF. And as you can see in the chart below, it is flying up the right side of the chart.

Those looking to gain some exposure in this area would be wise to scan through charts over the weekend to identify potential buy targets.

Click here to access my TradingView watchlist of shipping stocks.

If you have a TradingView account, click ‘Save as watchlist’ to add it. If you don’t have TradingView, it will still give you the 28 names and tickers.

We can dive into these Monday afternoon in our live Stealth Trades session at 4pm ET. If you are getting this email, you have access.

Here is the link just in case.

See you then.

Best wishes for your trading,

Weekly Update: Our Market Model Says “Wait”

Good evening, and welcome to this week’s edition of Stealth Trades!

Six months ago, we built a model.

It gauges the health of the stock market to identify bullish conditions where we should be buying and bearish conditions when we ought to remain cautious.

Right now, the latter is advised.

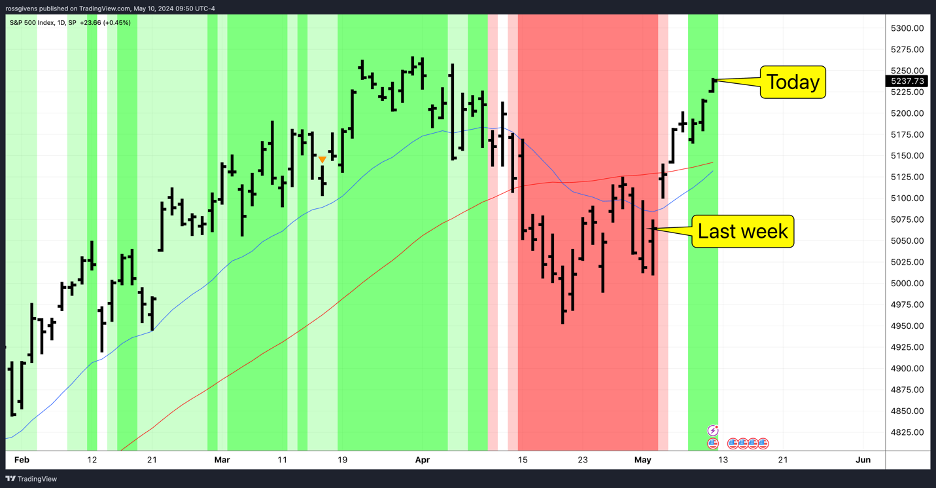
Above is a daily chart of the S&P 500 index. A green background designates a bullish market. This is when we want to be buying stocks.

Red, on the other hand, tells us that conditions are less than ideal. During these periods, we want to be less aggressive or flat.

The indicator is a combination of several inputs including price levels, market internals and breadth measurements.

And while no model is perfect, I am happy with the results.

Below is the same S&P 500 chart over the last five years:

It quickly went red 2 days into the COVID selloff. It also painted red for most of the 2022 bear market.

When conditions were favorable, however, it stayed green. This includes the 2020-2021 bull market as well as the strong rallies we experienced in mid-2023 and the last several months.

Does it pinpoint the precise top and bottom to the day? Of course not. Nothing does.

But it does what it is supposed to. It helps us tune out the noise and get an unbiased, scientific view of the landscape.

New traders are led to believe that top performers make money every week, every month.

It’s not true.

I have met some of the greatest traders of all time. In fact, I am currently in Las Vegas in a 2-day session with Tom Basso – a hedge fund manager featured in the Market Wizards book by Jack Schwager (look him up).

So, I can tell you with confidence, NONE of them are profitable each and every month.

Whatever your strategy, it will have periods of underperformance.

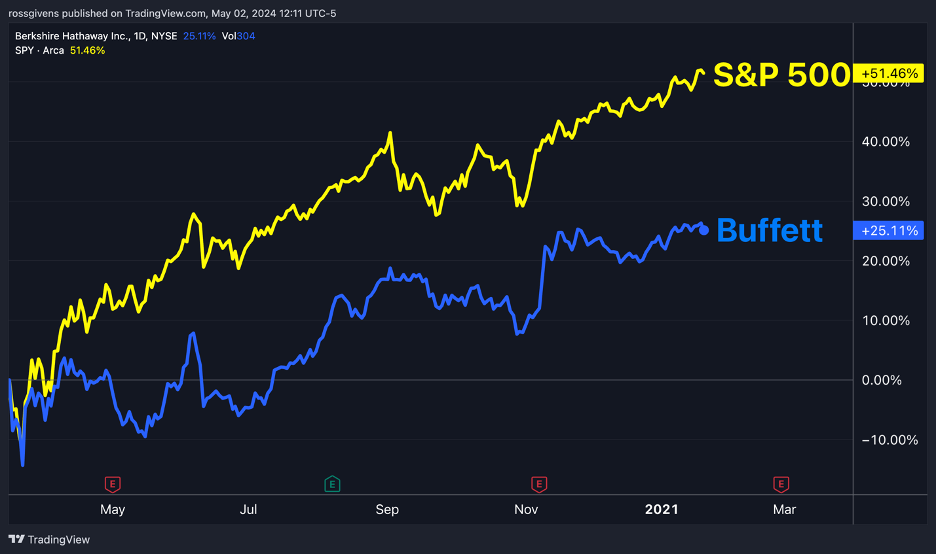
Value investors like Warren Buffett significantly underperformed the markets in the post-COVID bubble of 2020:

Momentum traders had a tough time in 2022 when the majority of rallies failed, and institutions were selling stocks hitting new highs.

Buy and hold investors all saw their accounts lose value in 2008. At the same time, short sellers and futures traders made a fortune in that volatility.

Whatever your strategy, you have to know its strengths and weaknesses. If your goal is significant outperformance, you must be willing to sit out when conditions are not ideal for you.

If I am tracking insider trades, I pay very little attention to my market health model. Why? Because insiders are experts at buying dips.

They have a long history of opportune buying near market lows – when my model is going to be painting bright red.

On the other hand, trading breakouts in high momentum stocks like we do in my Alpha Stocks service can be tough under bearish conditions.

So, when the model suggests taking caution like it does now, I tend to trade less and with smaller size.

Don’t misinterpret what I am saying. I am not suggesting this is the start of a long bear market. In all likelihood, it will be nothing more than a short-term pullback.

But after the hugely profitable period we experienced from November to April, the last thing I want to do is give back those hard-earned gains.

Unlike baseball, trading is not a game of called strikes. You can watch 100 pitches go by before taking a swing. The game starts and stops when YOU decide.

So wait for your moment. Demand ideal market conditions, perfect stock setups, whatever it is that gives your strategy an edge.

If you are selling options, you want the VIX above 20 and high premiums on those contracts. If you BUY options, your ideal environment is the opposite.

Wait for market conditions to be green for YOUR strategy.

And when they are… swing the damn bat.

Best wishes for your trading,

Weekly Update: This Bull Market is Not Dead

Good evening, and welcome to this week’s edition of Stealth Trades!

​​This bull market is not dead. In fact, I believe it is just getting warmed up.

After 4 months of consistently higher prices, stocks finally took a breath over the last few weeks.

But the pullback has been minimal. And, so far at least, it has been a healthy one.

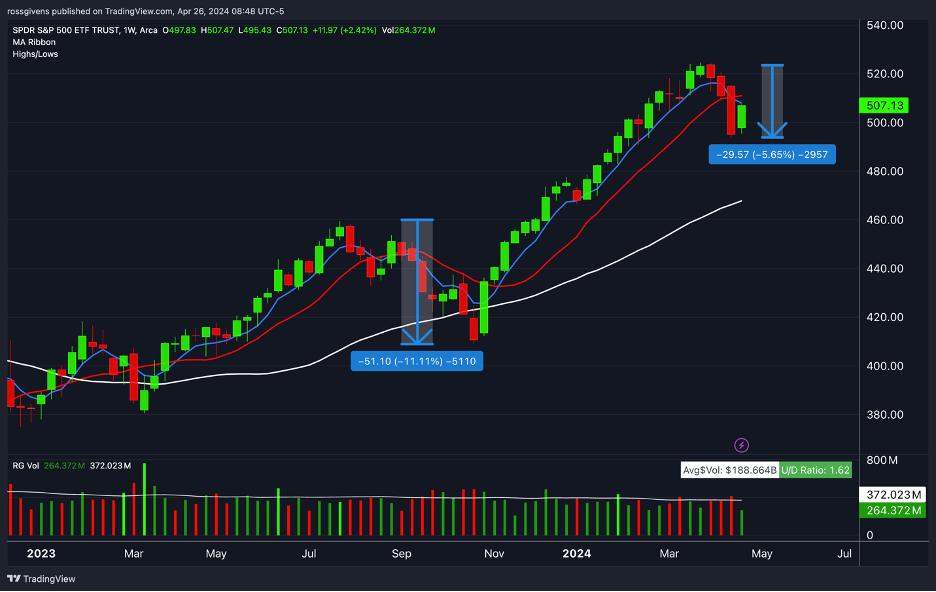
Above is a weekly chart of the S&P 500 index. Sometimes it is best to zoom out a bit and put things in perspective.

The April retracement was just over 5%. Sub-10% pullbacks are routine in longer-term uptrends, and this one is no different.

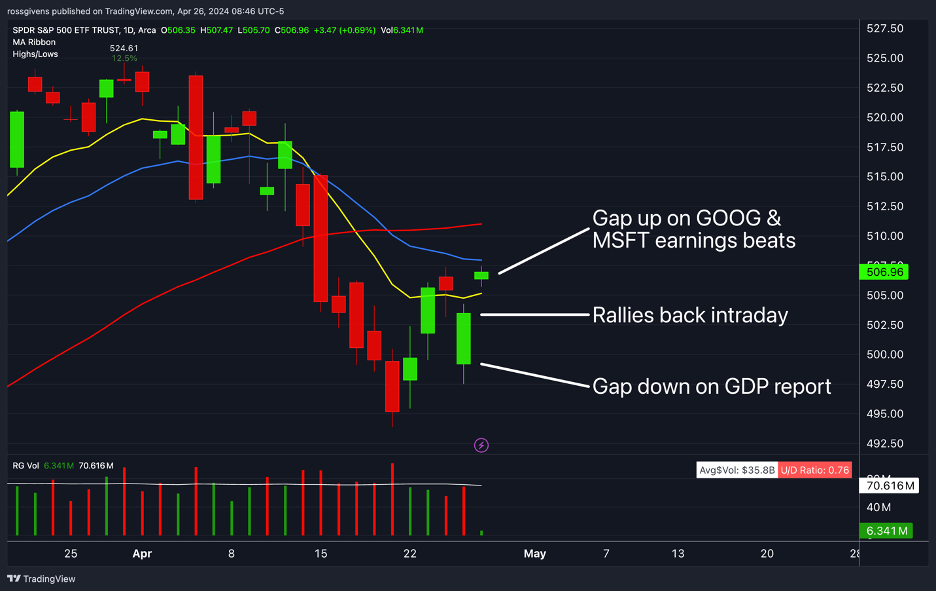
Zooming in closer on a daily chart we can see the market’s reaction to news over the last couple days:

As of Friday morning, at the time of this writing, the index is bouncing back nicely. More importantly, we saw support buying on Thursday following a disastrous GDP report.

The economy, as measured by gross domestic product, was expected to show growth of 2.4% last quarter. But the number came in much lower at just 1.6%.

Unsurprisingly, stocks gapped down on this news. But prices rose throughout the trading session to end the day down only slightly.

That afternoon, Alphabet and Microsoft both reported better-than-expected earnings numbers. As two of the largest and most widely held stocks in the world, this sent markets even higher this morning.

These are both good signs.

When the market quickly recovers from bad news like Thursday’s GDP report, it is telling you where the bias is. In fact, it is one of the few ways to identify turning points in stocks.

The 2022 bear market low came on the day of the worst inflation numbers in decades. The fact that stocks went UP after such terrible news was the signal to start buying.

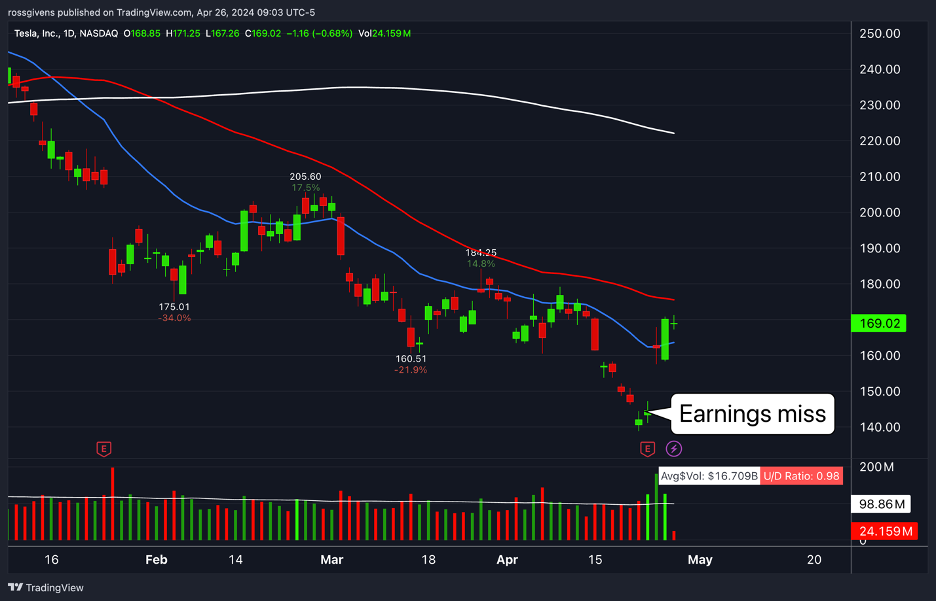
A more recent example is Tesla (TSLA). Tuesday’s earnings report showed lower than expected sales and profits. It missed on both metrics. But the stock went up.

Tesla has underperformed for the last year. It is down 50% over the last 9 months.

But this could very well be the low.

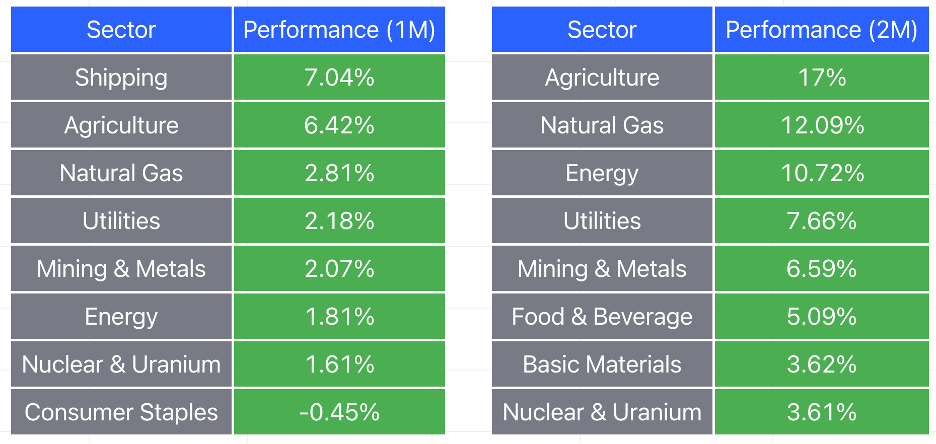
In terms of sector strength, we are still seeing money flow mainly into inflation trades.

Utilities, energy, basic materials and the like are all assets that keep pace with inflation. When these areas of the market are leading, it is generally reflective of institutions hedging their portfolios.

But that could soon change. And if the rally in the general market continues, I expect to see different groups leading the charge in the next week or two.

Until then, we remain cautiously optimistic. I still believe there is great opportunity in the gold and silver market and have not yet sold any of my holdings there.

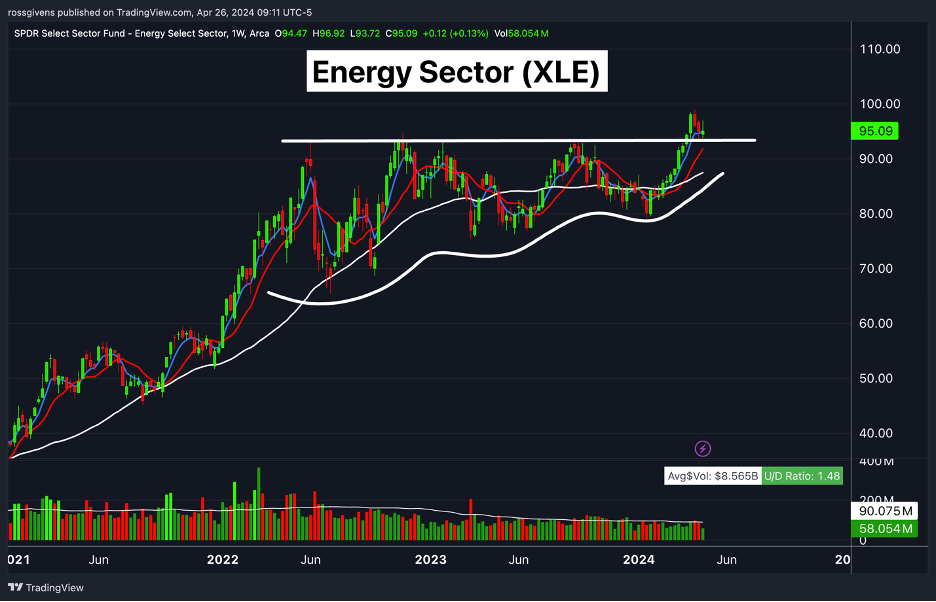
We are also keeping a close eye on the energy market. Note the breakout pattern on the weekly chart of XLE below:

Be prepared for oil and gas prices to rise over the next 3-6 months which will create opportunities to profit from these stocks.

Best wishes for your trading,
Weekly Update: The Start of a Gold Super Cycle?

Good evening, and welcome to this week’s edition of Traders War Room!

For a decade, gold has gone nowhere.

After peaking at $1,900/ounce in 2011, the yellow metal has failed to deliver.

But that is finally changing…

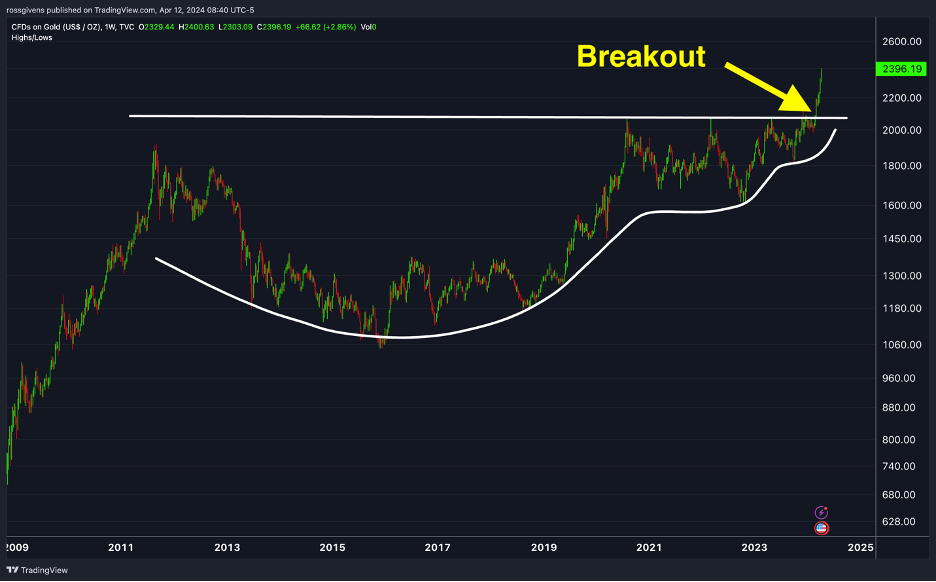
Gold is up almost 20% in the last two months after breaking out from a 13-year base.

The weekly chart above shows the price of gold over the last 15 years. Notice the shallowing base formation we typically see before a breakout.

For long-term trades, this is about as pretty as they come.

The nice thing about commodities like gold is that they tend to trend much better than stocks. Metals, oil, even coffee can make steady runs that last several years.

Gold has a history of what I call “super cycles.”

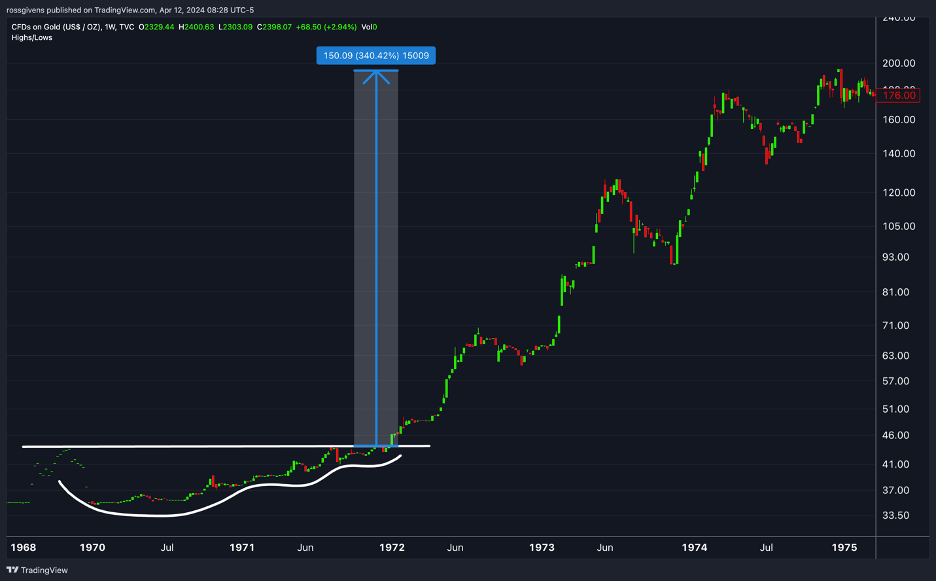
Starting in the late 1960s (as far back as I have price data), gold consolidated for four years before marching 340% higher.

This period from 1972 until 1975 was a super cycle.

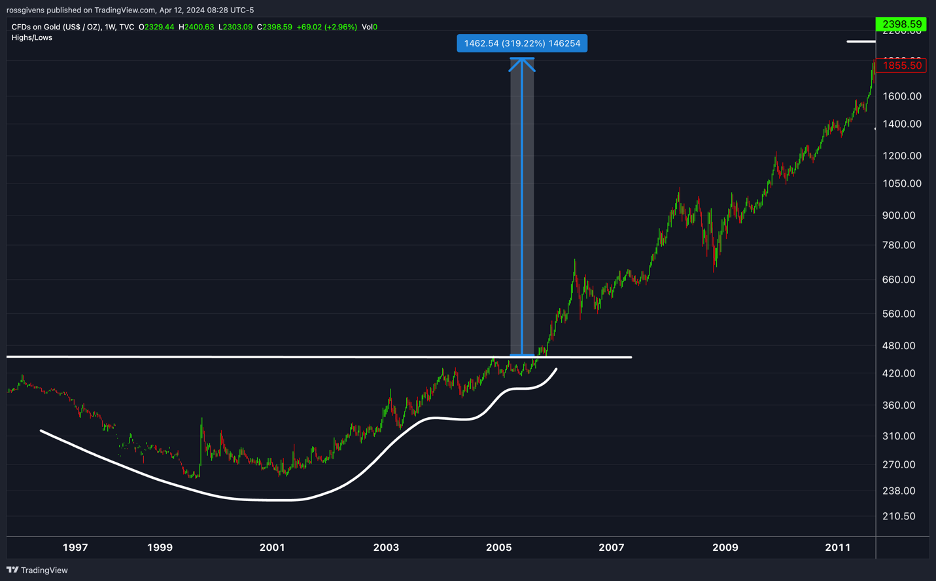
It happened again in the early 2000s…

After spending a decade forming a base in the $300-$500 range, gold soared to over $1,900 over the next six years.

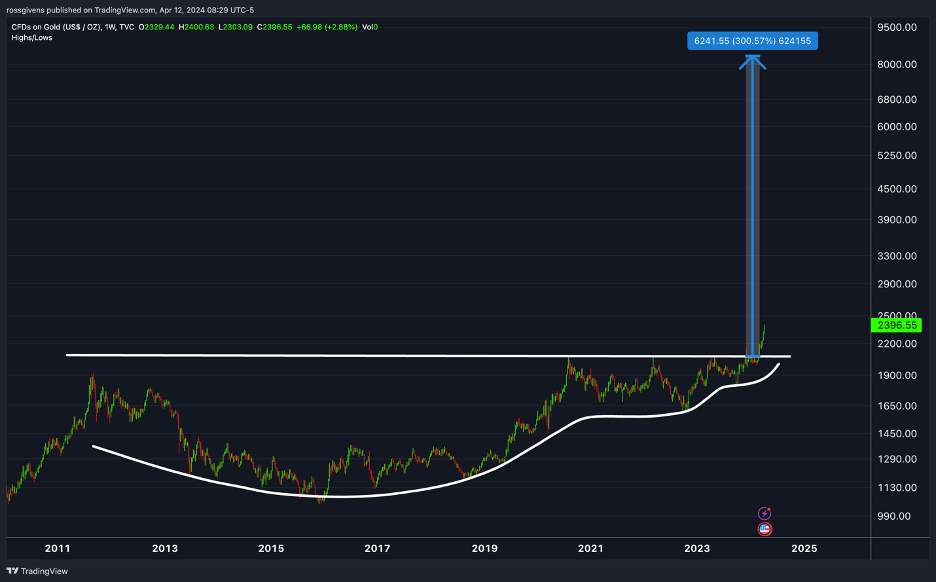
And here we are today, breaking out of a similar pattern after another decade of no action.

These past moves in the gold market give us a precedent for what we might expect from this rally. If history repeats itself, that means gold at roughly $8,000 per ounce.

Don’t think it can’t happen. It will. The only question is when.

The backdrop is set. Record inflation, a fiat currency backed by unfathomable debt, and 13 years of catch-up could easily double or triple the price of gold. I’m surprised it’s not already higher.

The easiest way to take a position in gold is buying GLD – an exchange traded fund that tracks the price of gold.

But there’s another way too…

Gold mining stocks typically move in multiples of what gold does. This is because relatively small increases in the price of gold can dramatically increase their profit margins.

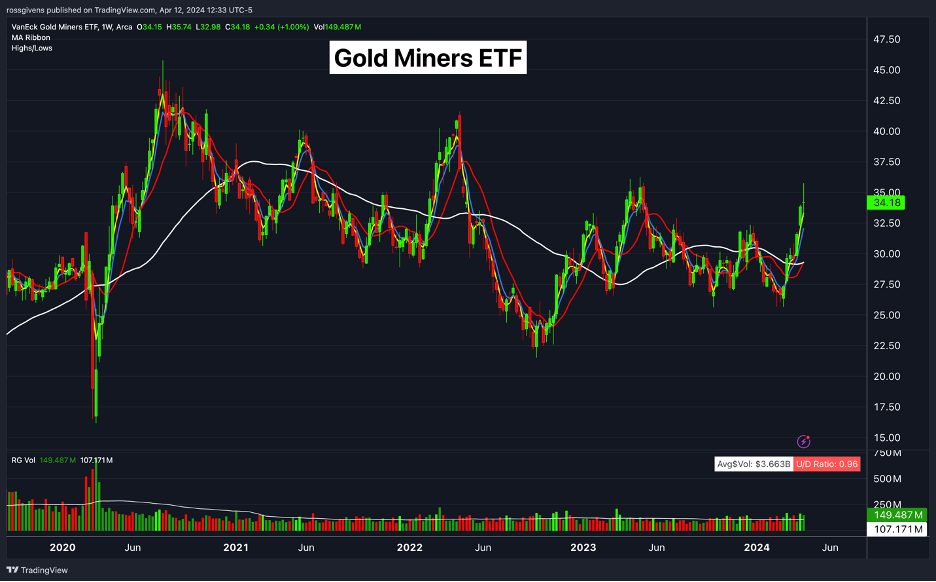
GDX is the gold miner ETF, and as you can see in the chart below, it is still well off its 2020 highs.

Mining stocks are soaring with leading names up 30-40% in just the last month.

But if this indeed the super cycle gold bugs have been waiting for, there is a LOT more left to come. Even a move to $3,000 an ounce would cause some of the smaller miners to climb several hundred percent.

I am hosting a LIVE webinar tomorrow morning to cover this opportunity in depth. The details are below:

SPECIAL WEEKEND WEBINAR EVENT
Saturday, April 13th @ 11am ET (10am CT)
Register Here

We will be discussing both the gold market and a proven strategy for buying the best stocks at the right times.

I’ll see you in the morning.

Best wishes for your trading,
Weekly Update: What the Heck Happened Thursday?

Good evening, and welcome to this week’s edition of Stealth Trades!

They never learn…

These “expert” economists that run the Federal Reserve are anything but.

At the end of 2021, the Fed planned to raise rates 3 times with a target rate of less than 1.0%.

It raised rates 7 times. And the target rate soared to 4.50%.

They said inflation would be “transitory” …

It wasn’t. 2 ½ years later, prices are still rising at an above-average pace.

Heck, it was their own reckless money printing that caused the inflation in the first place!

These clowns have a long history of incorrect forecasts and bad projections.

And when they screw up, they OVER correct to fix their own mistake, wreaking havoc on consumers and the everyday investor.

If they are not going to get it right, the least they could do is learn to shut up.

But everyone wants their 15 minutes of fame. And on Thursday, Minneapolis Federal Reserve Bank President Neel Kashkari got his.

He gave an interview to Pensions & Investments on LinkedIn Live.

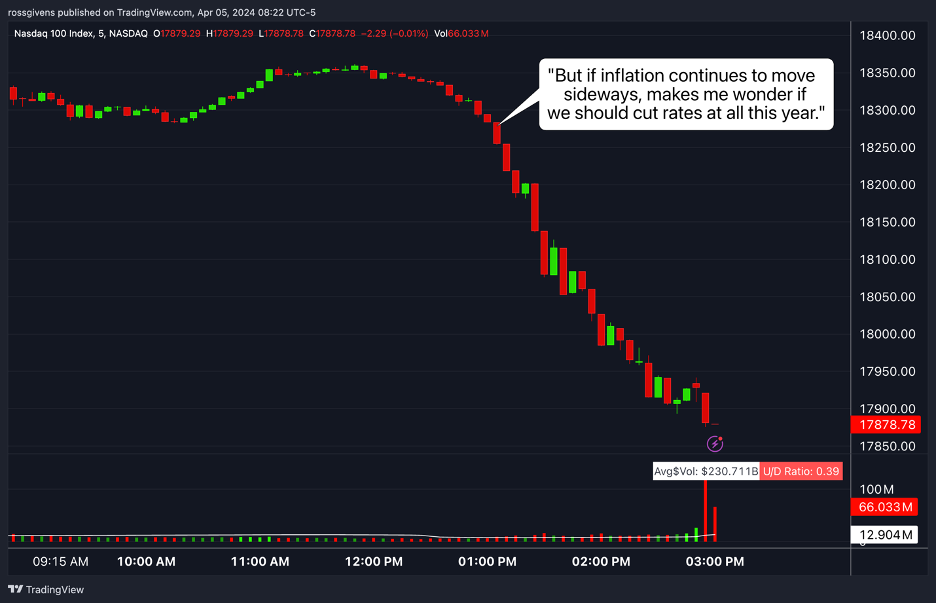
And unlike Fed Chairman Jerome Powell, who is careful to follow scripted remarks, Kashkari spouted opinions of his own. And at 2:03pm ET, he said this…

“But if inflation continues to move sideways, makes me wonder if we should cut rates at all this year.”

You don’t do that.

Especially after Powell just confirmed the Fed’s plans to cut rates 3 times in 2024.

This mixed messaging caused panic. And traders dumped stocks like they were on fire.

Above is a 5-minute chart of the Nasdaq index showing how things played out.

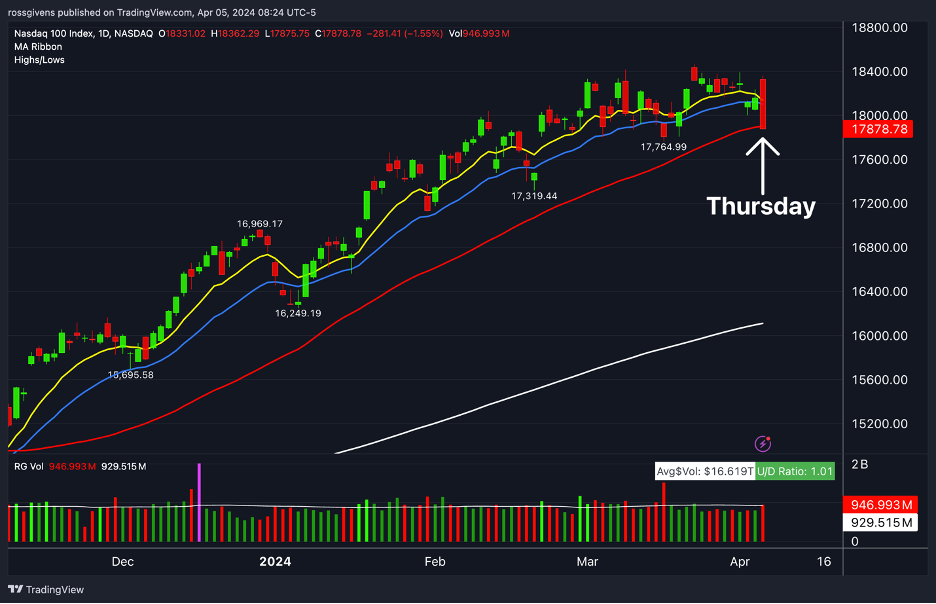
Thursday morning, the indexes were less than 1% from all-time highs.

By the close, the Nasdaq was touching the 50-day moving average… the first time it has done so since November.

In one hour, we learned what investors fear the most – interest rates.

Outside of a Black Swan event, failure to act by the Fed and follow through with its promise of rate cuts is the only thing that will kill this bull market.

Hopefully, Powell and his clown posse will go into damage control.

Traders will be looking for assurance. They want to hear that Kashkari misspoke and rates will soon come down. The sooner that happens, the better.

This may very well end up being a small, short-term pullback. Stocks are in the middle of a historic rally, so the trend is definitely on our side.

As of Friday morning, at the time of this writing, the index is just 3% off its highs. It is in no way time to panic.

But we just witnessed the first sign of weakness in 5 months. If this behavior continues, we will start playing defense.

Until then, stay the course.

Right now, I am looking for two things – stocks pulling back to obvious support areas, and stocks that held up better than others in Thursday’s selloff.

The first group is to identify pullback buys in leading names.

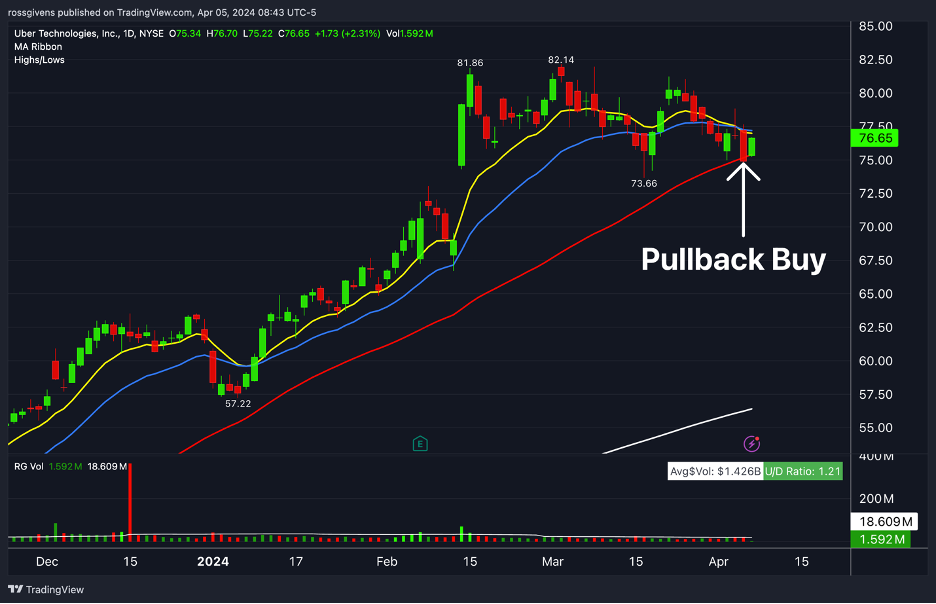
UBER pulled back to its 50-day moving average (red line) and is already bouncing off that level.

This is a classic pullback buy setup.

Stocks that held up better than the rest will be the market leaders.

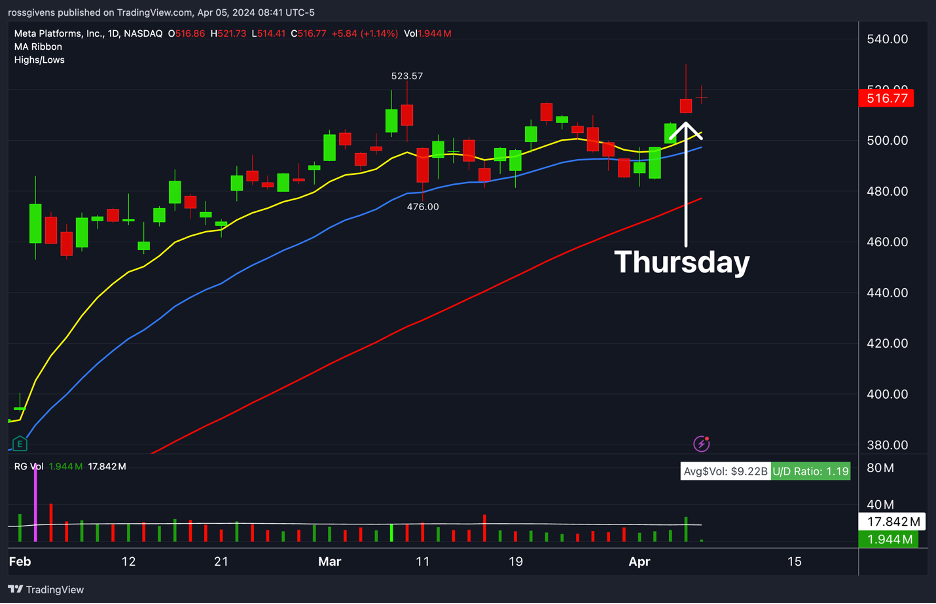
META, for example, was up on the day.

That is a clear sign of strength.

Try not to exit the market prematurely. You want to play trends until they end, not until you think they will end.

Or as I like to say… Either ride her ‘til she bucks you, or don’t ride at all.

Best wishes for your trading,
Weekly Update: Only Trade Stocks That Do This 

Good evening, and welcome to this week’s edition of Stealth Trades!

I ignore 95% of the stocks I look at.

The reason?

They don’t “trade well.”

Not all stocks are created equal. Some trend well. They respect key moving averages and break out strong from clean patterns.  

Others are a mess. They’re up 20% one week and down 20% the next. They don’t follow structure. They move erratically.

This makes trading them a crap shoot.

The game of trading is all about putting the odds in our favor. I have spent the better part of two decades studying what makes stocks move and why. And the only edge I have found is in focusing on institutional favorites being actively bought by large funds.

These are the stocks that allow me to buy them from low-risk entry points with maximum profit potential.

I’ll show you an example…

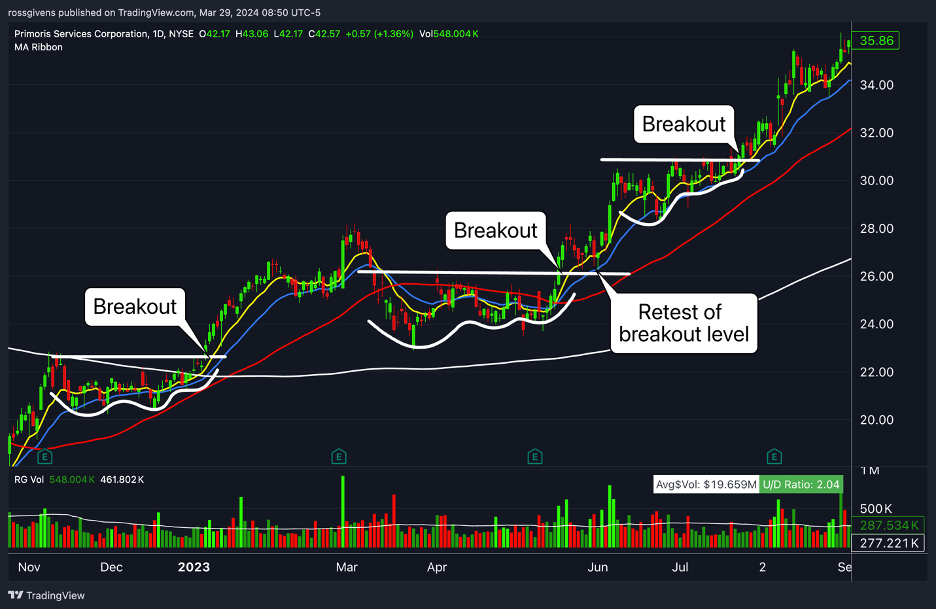
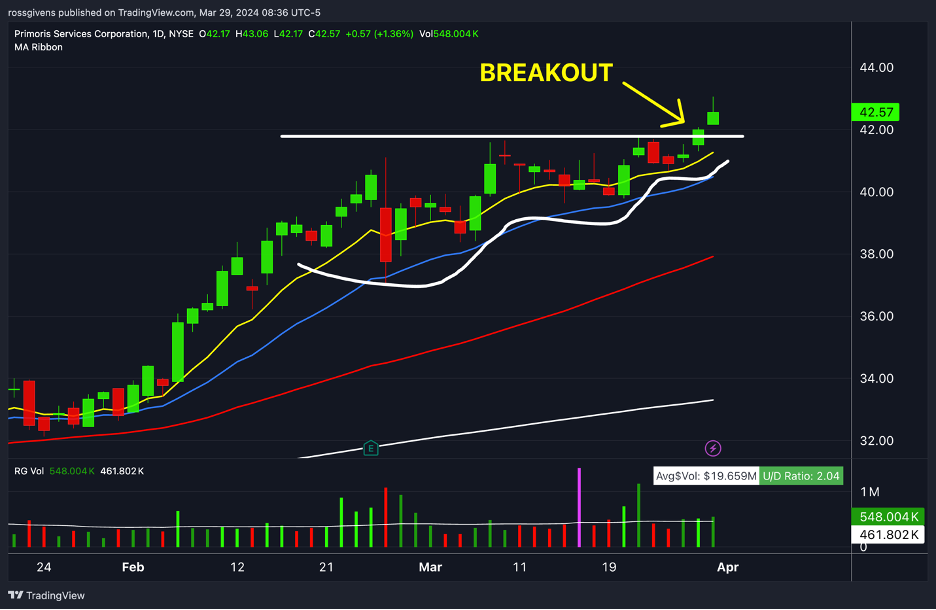
This is Primoris Services, ticker symbol PRIM. It is an industrial construction company.

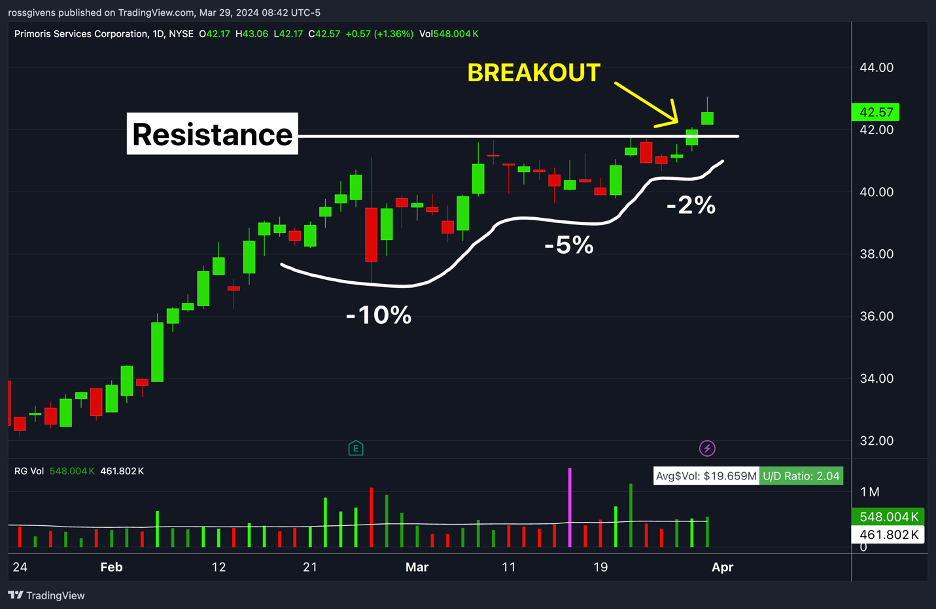
The stock is currently coming out of a textbook breakout pattern. After a 25% rally in January, PRIM consolidated through a series of shallowing pullbacks from left to right.

Notice how each retracement was shallower than the last:

This is a stock I would buy here. In fact, we did just that in my Alpha Stocks service yesterday.

PRIM is in the right group – construction has been a leading theme of this bull market and the area I am seeing the most strength right now.

It is also breaking out from a clean pattern which we outlined above.

But this stock also “trades well.” It has a history of making quick runs higher after patterns like this. I’ll show you what I mean…

This is a chart of PRIM from late-2022 to late-2023:

Notice how well the stock trades – steady up moves followed by constructive consolidation periods. No wild gyrations. No whippy price action. Just clean moves from tight bases.

Here are the 12 months leading up to present day:

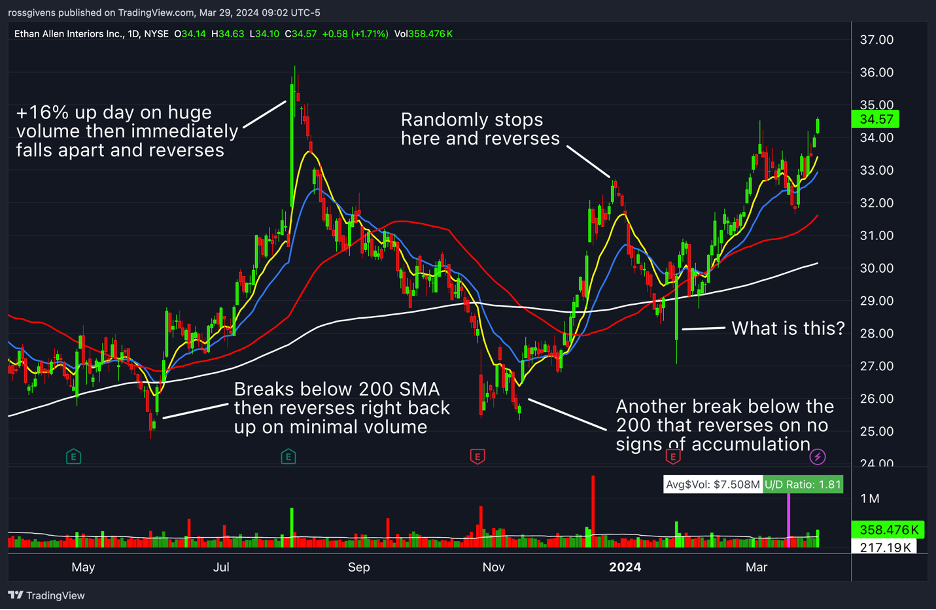
Now let’s contrast that with another housing-related stock benefitting from the construction boom – Ethan Allen (ETD).

Take a look at this mess of a chart:

There are no clean trends. The stock does not respect its 200-day moving average. There are no clean bases. It reverses randomly and for seemingly no reason.

In essence, this is a choppy mess.

Guessing what this stock will do from one week to the next is a coin toss at best. I have no edge here.

This would be one of the 95% of stocks I pass on.

Am I too picky? Possibly. I also might be exaggerating. Maybe it’s more like 80% of stocks that look like this.

But you get the idea.

Whatever pattern you are trading, go back a little. How has this stock responded to that setup in the past?

If you are new to chart reading, stick to obvious setups. If a chart confuses you, move on.  A year from now, it will take you 2 seconds to know if a stock is worth trading or not.

Knowing how to avoid the dogs is one of the best skills a trader can develop. Stock selection is key.

The bulk of your gains will come from picking the right names, not from buying at the perfect price. And the best stocks usually trade well.

Best wishes for your trading,
Weekly Update: Profiting from the Construction Boom

Good evening, and welcome to this week’s edition of Stealth Trades!
We are in the early stages of a major construction boom. 

I went as far as hosting free Saturday webinars last year to make my case and highlight what I believed was a huge opportunity in building stocks.

Nothing has changed. 

I am as bullish today as I was then, even though many of these stocks are already up 100% or more.

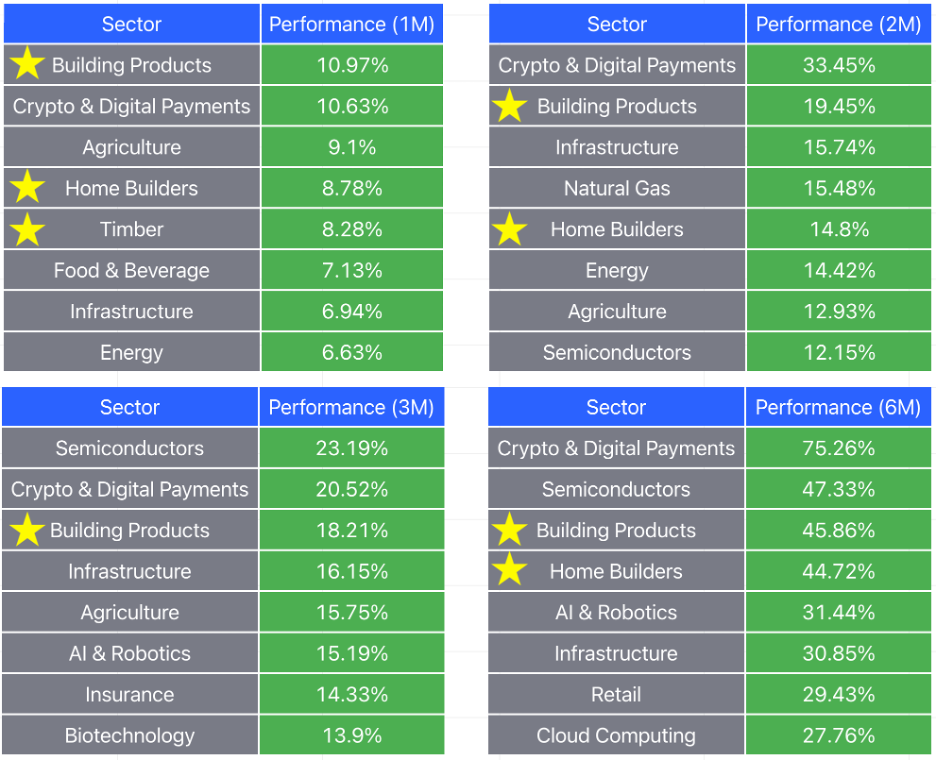
Take a look at the sector performance over the last 6 months:

I have put a yellow star next to every construction-related group. Over the last 30 days, building products, home builders and lumber hold 3 of the top 5 spots.

The evidence is crystal clear. This is where money is flowing.

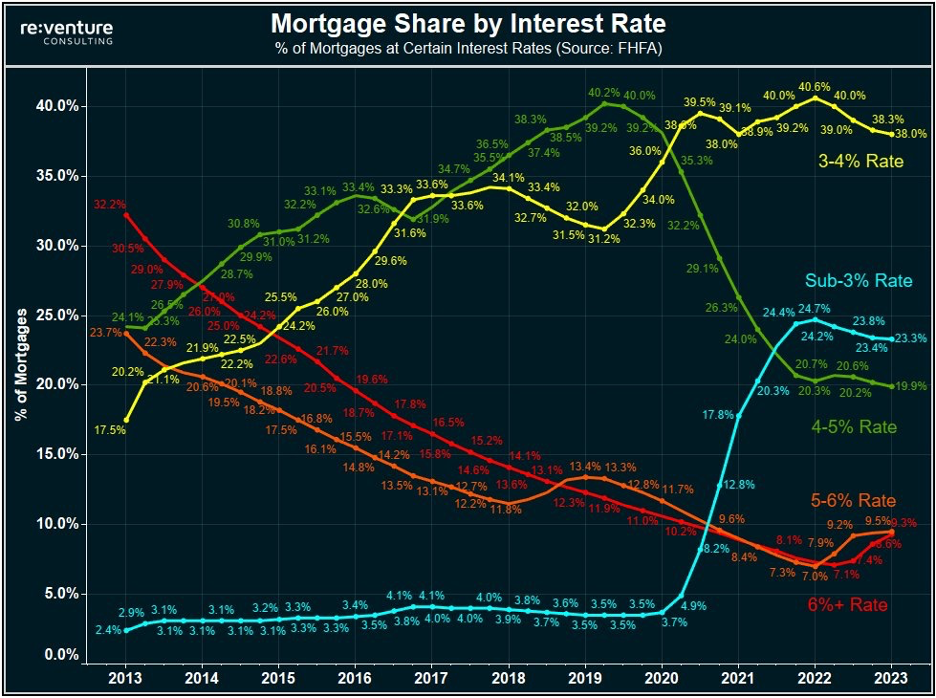
Why? It’s simple really. No one is selling their homes. More than 60% of mortgages are locked in with a sub-4% interest rate.

They’re not going to sell. Who wants to give up a 3% mortgage to take out a new one at 7.5%. The payment will be doubled.

This has caused a record low in housing supply. 

New construction is the only game in town, and homebuilders are seeing record profits because of it.

So how can YOU profit from it?

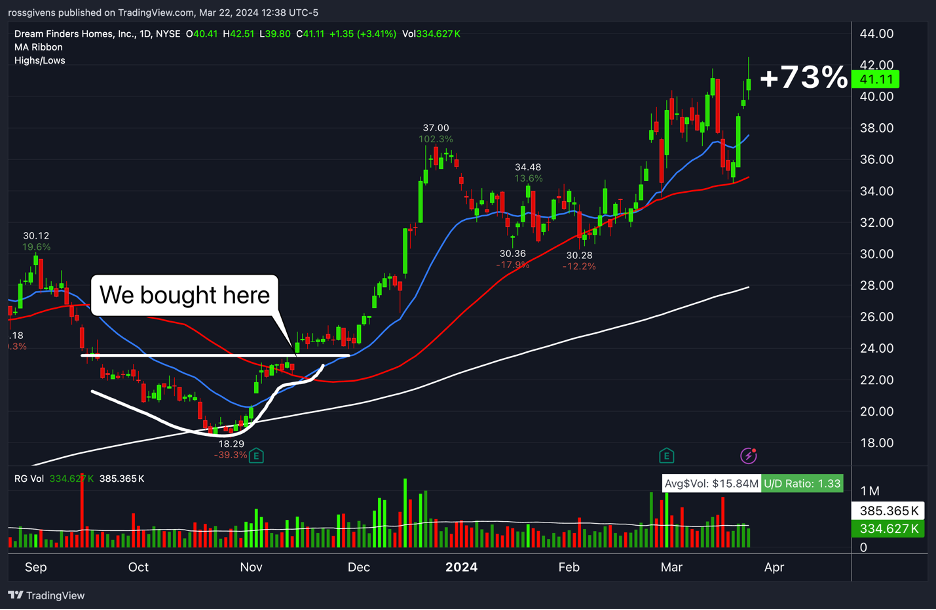
There are two ways to invest in the housing boom. The first, and most obvious, is to buy homebuilder stocks – names like D.R. Horton (DHI) and Dream Finders Homes (DFH).

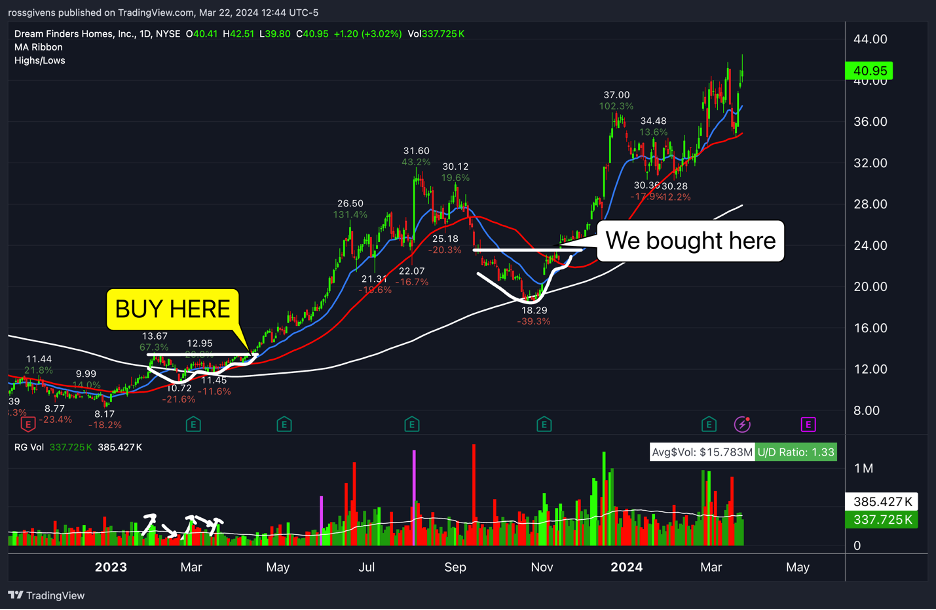
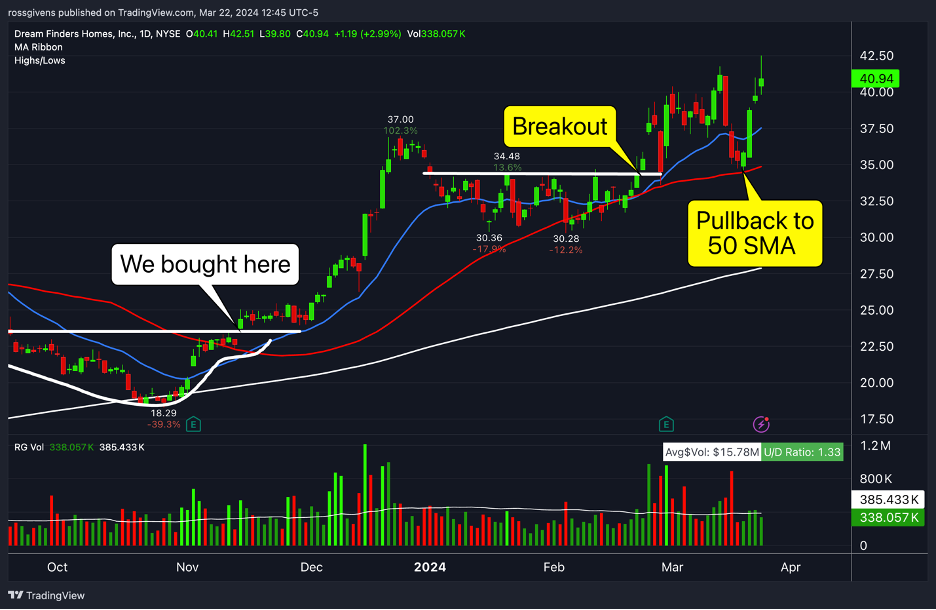
We bought the latter in my Alpha stocks service back in November and we are up 72% since. 

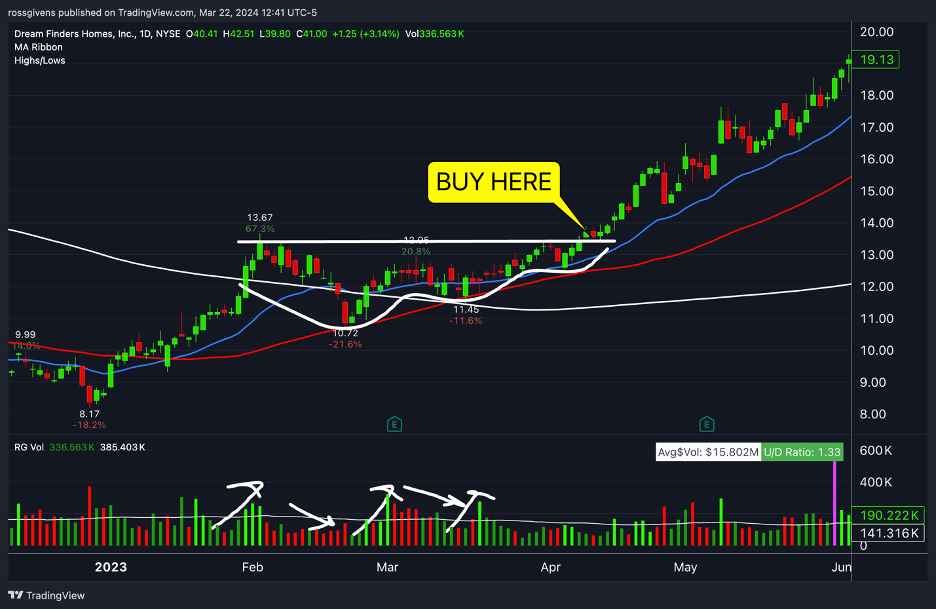
The setup was simple – a shallowing base off the moving averages at the end of a pullback.

But there have been several other opportunities to buy. 

I missed the first entry last year…

CHART LINK: https://www.tradingview.com/x/uHD9L9bd/

 This one was about as pretty as they come – a 60% rally off the lows to clear the 200-day moving followed by a series of shallowing retracements. Notice how volume rose and fell in sync with the stock too. This was a clear sign of accumulation.

That trade would have been a nice triple:

CHART LINK: https://www.tradingview.com/x/Am2wgtaA/

Here are two more recent entry points:

By the way, we cover these entry tactics every Monday at 4pm ET in my live zoom classes. If you are getting this email, you have free access.

Anyway, homebuilder stocks are the obvious play.

The other area to watch is the building materials sector. Companies that make drywall, flooring, light switches and everything in between also benefit from increased home construction.
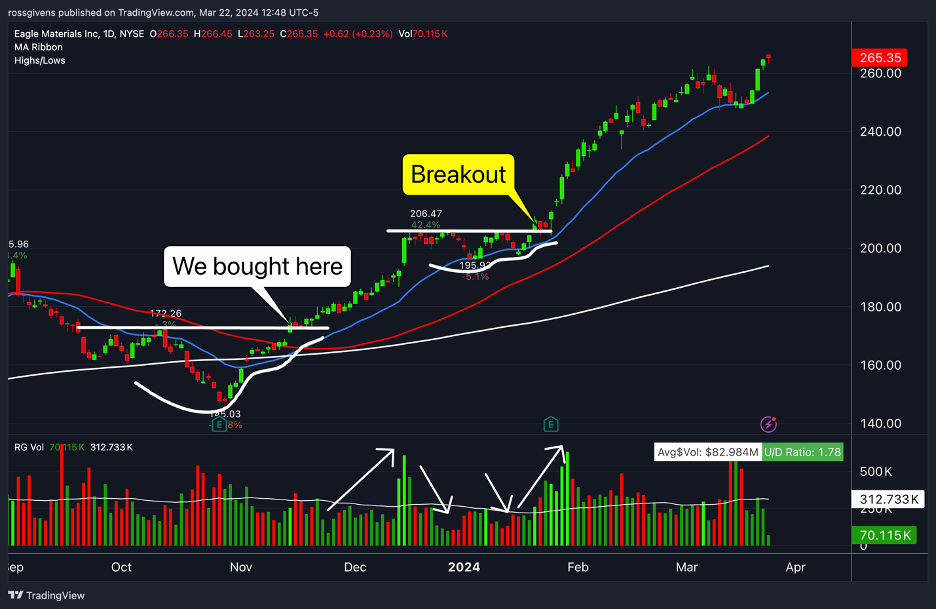
Eagle Materials (EXP), for example, makes concrete and Gypsum boards. We bought this stock around the same time as DFH, and it has performed beautifully.

There was another breakout buy opportunity in late January, and I’m sure there will be more.

If you are looking for a stock to buy now, you might consider Trex Company (TREX). They make wood-alternative decking, outdoor furniture and fencing. The is currently breaking out from a similar shallowing base pattern:
TREX is also sitting at the elusive “century mark” as we call it. $100 tends to be a significant area for stocks. You’d be surprised how many people say, “I’ll sell it if it gets to $100.” Sounds stupid, but it’s true. 
This is why stocks often find resistance at these large round number prices. So don’t be surprised if TREX stalls here for a few days. It’s normal.

I’ll be running through my list of home construction stocks in Monday’s live session to see if we can find additional opportunities. I hope you can join me.

Best wishes for your trading,