Weekly Update: The Crucial Role of Volume
Good evening, and welcome to this week’s edition of Stealth Trades!
In last week’s email, we talked about buying stocks on pullbacks. I outlined two methods of buying stocks on temporary weakness from low risk buy points.
If you missed it, check your inbox for a January 26 email titled “Weekly Update: How to Buy Stocks on Pullbacks.”
Today I want to add to that discussion by adding another element to the equation – volume.
Volume is one of the most overlooked indicators for traders. Learn to interpret it, and you can decipher what is really happening beneath the surface.
Remember that institutions are what moves prices. Multi-billion-dollar hedge funds, mutual funds, ETFs, pension funds and other large players are the ones whose buying and selling actions push stocks up and down.
So, when a stock is rallying on above-average volume, it usually means big players are behind the rally. And they don’t buy for a day or two. It usually takes them weeks or months to build their positions.
The same is true on the downside…
Let’s say a stock fell 10% last week. If this took place on huge volume, the big boys are getting out and you should probably do the same. If the same 10% decline occurred on BELOW average volume, however, this is likely retail selling or normal fund rebalancing.
All things being equal, a stock pulling back on the lightest volume is the one you want to buy.
Take a look at this chart…
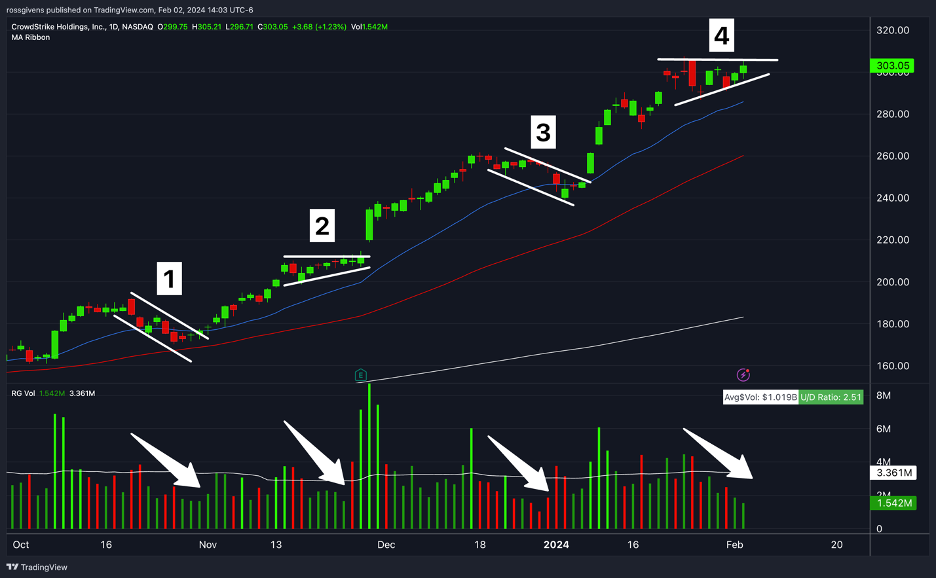
This is CrowdStrike Holdings (CRWD) stock from October through today. I have marked up the pullbacks and consolidation periods.
At Point 1, the stock pulled back 11% over a two-week period. But look at the volume graph below where I have drawn an arrow…
Notice how the decline took place on below-average volume. If you are looking for a place to buy or add on to an existing position, this is the place to do it – right between the 21 and 50-day moving averages after a low volume retracement.
The stock quickly rebounded and climbed 20% over the next two weeks.
Point 2 is more of a consolidation than a pullback. This is an area where price action compresses, the range becomes tight, and again we see volume well below its average level.
Profit taking is minimal. No one is selling and the stock is becoming harder to buy. Once CRWD broke out, it quickly rallied another 22%.
Point 3 is similar to the pullback at Point 1 – a shallow 8% decline over 2-3 weeks on very minimal volume. The stock dipped to the 21-day EMA, found buyers, then tacked on another 26% move to the upside.
That brings us to today…
Here, at Point 4, we see very similar action to what we saw at Point 2 back in November – tightening price action, a narrow range, and volume drying up.
And while nothing is guaranteed, this stock looks poised for another leg higher.
Volume is a crucial component of my stock analysis. If the price chart looks good but the volume graph doesn’t confirm, I have learned it is best not to take the trade.
I analyze breakout trades the same way. Here is a chart of Airbnb (ABNB) stock over the last six months:
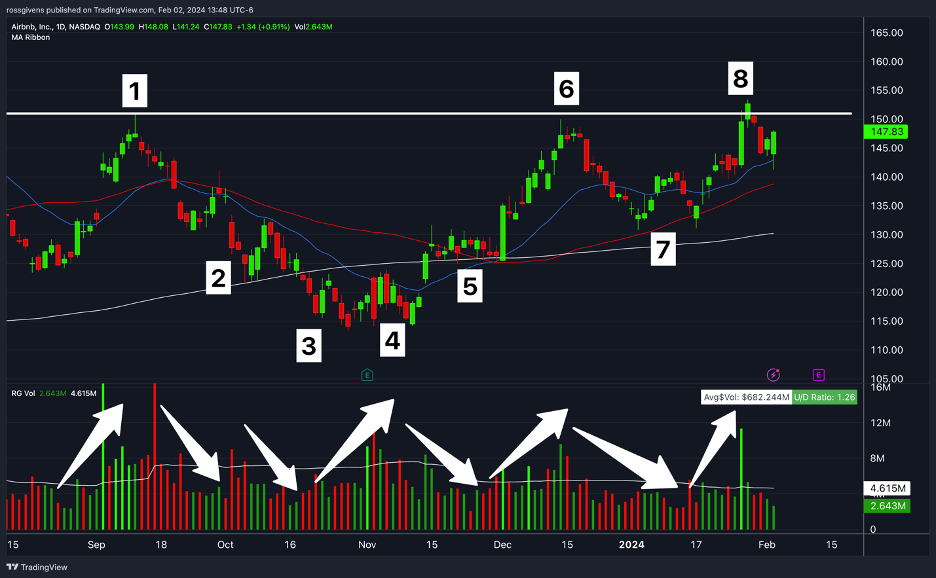
We can see the shallowing action as the stock tightens up from left to right. This is textbook pre-breakout action. And volume confirms the story…
The initial rally into Point 1 took place on high volume. The pullbacks at Points 2 and 3 occurred on lighter action. Then volume picked up at Point 4 as the stock formed a bottom – a sign that buyers are stepping in and supporting the stock.
This was followed by a low-volume consolidation (Point 5), a high-volume rally (Point 6), and so on.
Volume can also signal the start of new trends.
In fact, we may have just seen one such occurrence today in Meta Platforms (META).
The social media giant announced better-than-expected earnings and revenue, along with its first-ever dividend and a $50 billion stock buyback program. Shares surged 20% on the news.
The last time this happened?
One year ago to the day… and it triggered a 150% move.
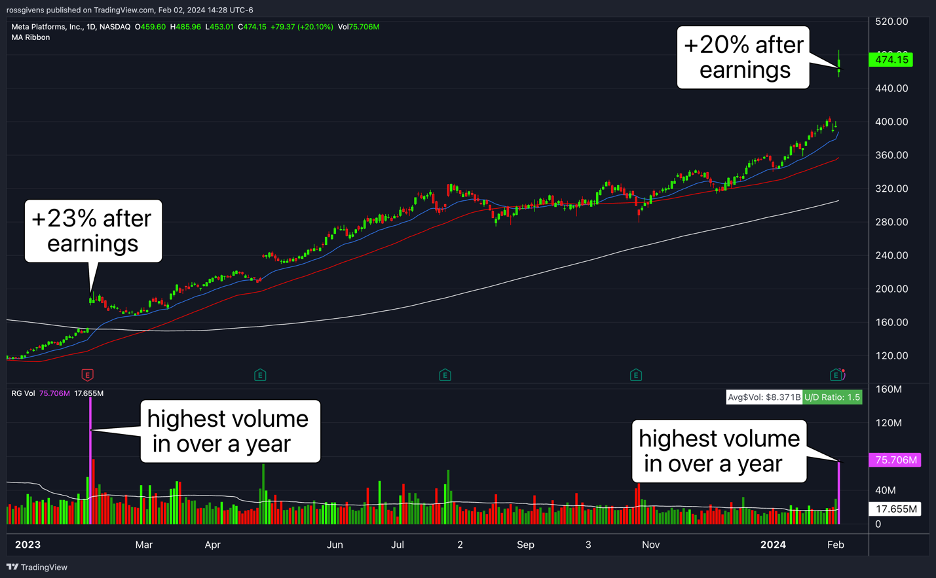
A 20% post-earnings move on the highest daily trading volume in a year… looks kind of familiar, huh?
Trading does not need to be overly complicated. I’ve known traders with so many indicators on their charts you couldn’t even tell what the price was.
Keep things simple – price, volume, and a couple of moving averages to serve as guideposts. There’s no magic indicator. But volume is probably the closest thing to it.
Best wishes for your trading,