Weekly Update: Identifying Strong Stocks Amidst the Dip

Good evening, and welcome to this week’s edition of Stealth Trades!

As predicted, markets pulled back slightly this week.

I am writing this early Friday morning because I have to catch a flight to Austin in a few hours. But as of now, the Nasdaq is down roughly 2% for the week.

Jerome Powell, Chairman of the Federal Reserve and sworn enemy of anyone who likes money, opened his big mouth before Congress this week. He stated that inflation would continue to be a problem and there would likely be 2 additional rate hikes this year.

Investors were not excited.

Stocks, especially high P/E growth names, pulled back on the news.

Pullbacks are natural. They happen in every bull market. Stocks never go straight up.

And if you know what to look for, they can make you money.

Pullbacks (dips, retracements, down weeks, whatever you want to call them) reveal which stocks have the most strength.

The strongest names will often resist the decline and hold up near their highs while the rest of the market falls. They will also recover very quickly.

This is a sign that demand is strong for that stock and investors are taking advantage of the short-term pullback and buying shares. 

Below are a few stocks showing a lot of strength right now. I decided to stick with AI names that week since this is the dominant theme of the market right now.

SoundHound (SOUN)

I gave this one last week, and the stock broke out beautifully. It shot up 19% on Tuesday and made another high Thursday.

Notice how the volume bars mimic the action from the price candles. Volume climbs as the stock moves higher and declines as price comes down.

This is exactly what we want to see. It shows the aggressive action is on the buy side and bulls are in charge. 

I want to see this stock stay above $3.25 and remain above the base. Traders may consider buying on a pullback into the $3.50-$4.00 area.

Super Micro Computer (SMCI)

SMCI is a market-leading stock. As a key player in the AI space, Super Micro is currently an institutional favorite.

Shares tripled in 45 days between April and June, and the stock is finally pulling back.

This dip to the 21-day moving average is a buyable pullback. I would use an 8-10% stop to keep risk tight.

CrowdStrike Holdings (CRWD)

This cybersecurity stock has been a top performer in 2023.

After a vicious Stage 4 downtrend that wiped out 70% of its value in the 2022 bear market, CRWD has come ripping off the low this year.

It reclaimed its 200-day moving average last month and continues to advance higher.

The dashed line on the chart above shows a key support/resistance level in CRWD. The stock found resistance here earlier in the year and it has so far served as support after getting above the 200-day.

The stock is also sitting on its 50-day moving average which should serve as additional support.

I would consider buying here with a stop just below the 200-day line at $133. This would represent a 7% risk on the trade.

Best wishes for your trading,

Weekly Update: Rally Extended

Good evening, and welcome to this week’s edition of Stealth Trades!

What a week.

The Nasdaq index surged another 5% to extend this rally even further.

This week’s Fed meeting saw rates unchanged as we expected. Wall Street has been expecting a pause to the rapid interest rate hikes and we finally got it.

But with a caveat…

Powell said they expected to raise rates twice more before the end of the year.

Hopefully that is not the case. Let’s remember that Powell and his cronies at the Fed are the ones who created this fiasco in the first place.

Their reckless money printing during the COVID crisis is what caused inflation in the first place. They “inflated” the money supply. That’s just how it works. It is not supply chain issues or corporate greed or whatever new fairy tale they are trying to sell the American people.

The Fed caused record inflation. They are embarrassed. And now they face the impossible task of controlling it without crashing the economy.

Wednesday’s comments may have been a bluff – one final attempt to spook the market and curb inflation before bringing rates back down to Earth.

Only time will tell.

But in the meantime, the stock market looks extended…

Even when markets are in uptrends, they don’t go straight up. Large advances must be digested along the way.

If prices go up too much too fast, they usually pull back temporarily.

A quick way to see if a market is extended is to measure its distance from the 50-day moving average (red line on chart).

Above is a weekly chart of the Nasdaq index.

Notice how the 50-day line contains the move in both bull and bear markets. When the index strays too far above or below, price pulls back as it reverts to its mean.

Below is a closer look at what happens when the market gets extended.

For the Nasdaq, it tends to pull back when it gets more than 12% above its 50-day moving average.

And that’s where it is trading today.

The market is overbought.

And while it is possible to stay that way and continue higher, the more likely scenario is that we will see a 5-10% pullback in the indexes.

If this happens, I will be using it as a chance to buy top-performing stocks on pullbacks.

AI is the dominant theme of the market right now.

NVIDIA (NVDA) makes the go-to chip for artificial intelligence applications. Its stock is up more than 200% this year.

C3.ai (AI) is the owner of ChatGPT – the AI language model that has already garnered 100 million users. That stock is up over 300% this year.

Palantir (PLTR) has one of the only commercial AI software applications. That stock has doubled since May.

All of these are on my shopping list as potential pullback buys.

 Here are a few more stocks on my radar:

SoundHound (SOUN)

I’ve had my eye on this stock for months.

SoundHound is smaller, off-the-radar AI stock. The company owns several patents involving voice-recognition technology.

If you drive a Dodge, Chrysler, Jeep, Hyundai, Kia, Honda or Mercedes-Benz, you are probably using their software already.

HOUN ripped higher to start the year, but it got overcooked and settled back in the $3 range.

It has been forming a base for the last four months with resistance near $3.35, and the stock is now trying to breakout higher. 

I just bought a few thousand shares on Friday with plans to add on as it advances.

iShares Robotics & AI ETF (IRBO)

Another way to play the AI trend is to make a bet on the entire sector.

The easiest way to do this is with an exchange traded fund, or ETF. ETFs trade just like regular stocks. But each share represents fractional ownership in a basket of stocks.

IRBO owns 133 stocks with exposure to robotics and artificial intelligence.

For me, this is a longer-term trade I would like to hold for several months which is why I bought it in my IRA account.

You can see the first Stage 2 breakout in the weekly chart above. The ideal buy point would have been closer to $32, but I believe it is still buyable here. I will hold IRBO as long as it holds above $28.

Progyny (PGNY)

This stock has nothing to do with artificial intelligence. It is a fertility company. But the growth is tremendous.

PGNY sales have increased by more than 50% in each of the last four quarters, and 2023 earnings are projected to be nearly triple the best year they’ve ever had.

With a 2024 EPS estimate of $2.05, the stock trades at just 19X forward earnings which is a steal for a high growth name like this.

The dashed line on the chart above shows a key support/resistance level in PGNY.

The recent pullback gives trades a chance to buy near this level with the 21-day moving average (blue line) offering additional support.

I would consider buying here with a stop at 36.50 to risk less than 6% on the trade. 

Best wishes for your trading,

Ross Givens

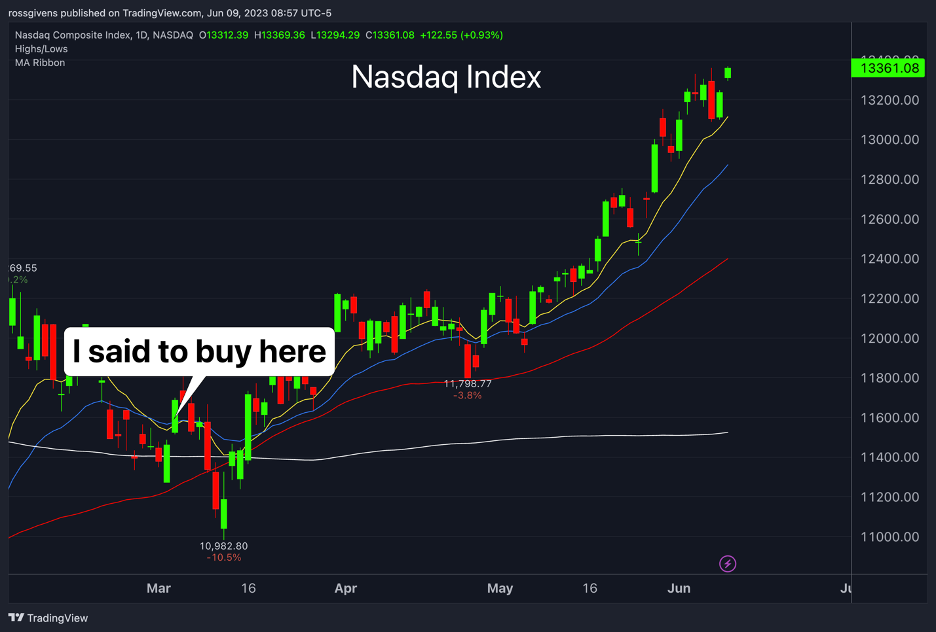
Weekly Update: I Hate to Say I Told You So…

Good evening, and welcome to this week’s edition of Stealth Trades!

I hate to say I told you so. Buuuuuuut…..

I have been pounding the table since March that this is a new bull market.

Week after week my message has been the same…

BUY. The bear market is over.

On March 3rd, in my Weekly Update email (which you are reading right now), I brought to your attention a bullish signal known as an “upside reversal.”

Here is a screenshot from that email:

I even showed you the trade I took:

The upside reversal is one of my favorite buy signals.

Typically, I’m not a fan of buying stocks when they are at the lows. This setup is the exception.

The upside reversal works great on the indexes. It works even better on individual stocks.

Here’s one that formed in TSLA back in April:

If you like buying low when stocks are “on sale” you need to know this strategy.

It is a way to buy right as a stock is reversing and, more importantly, a way to do it with limited risk.

Here are the rules…

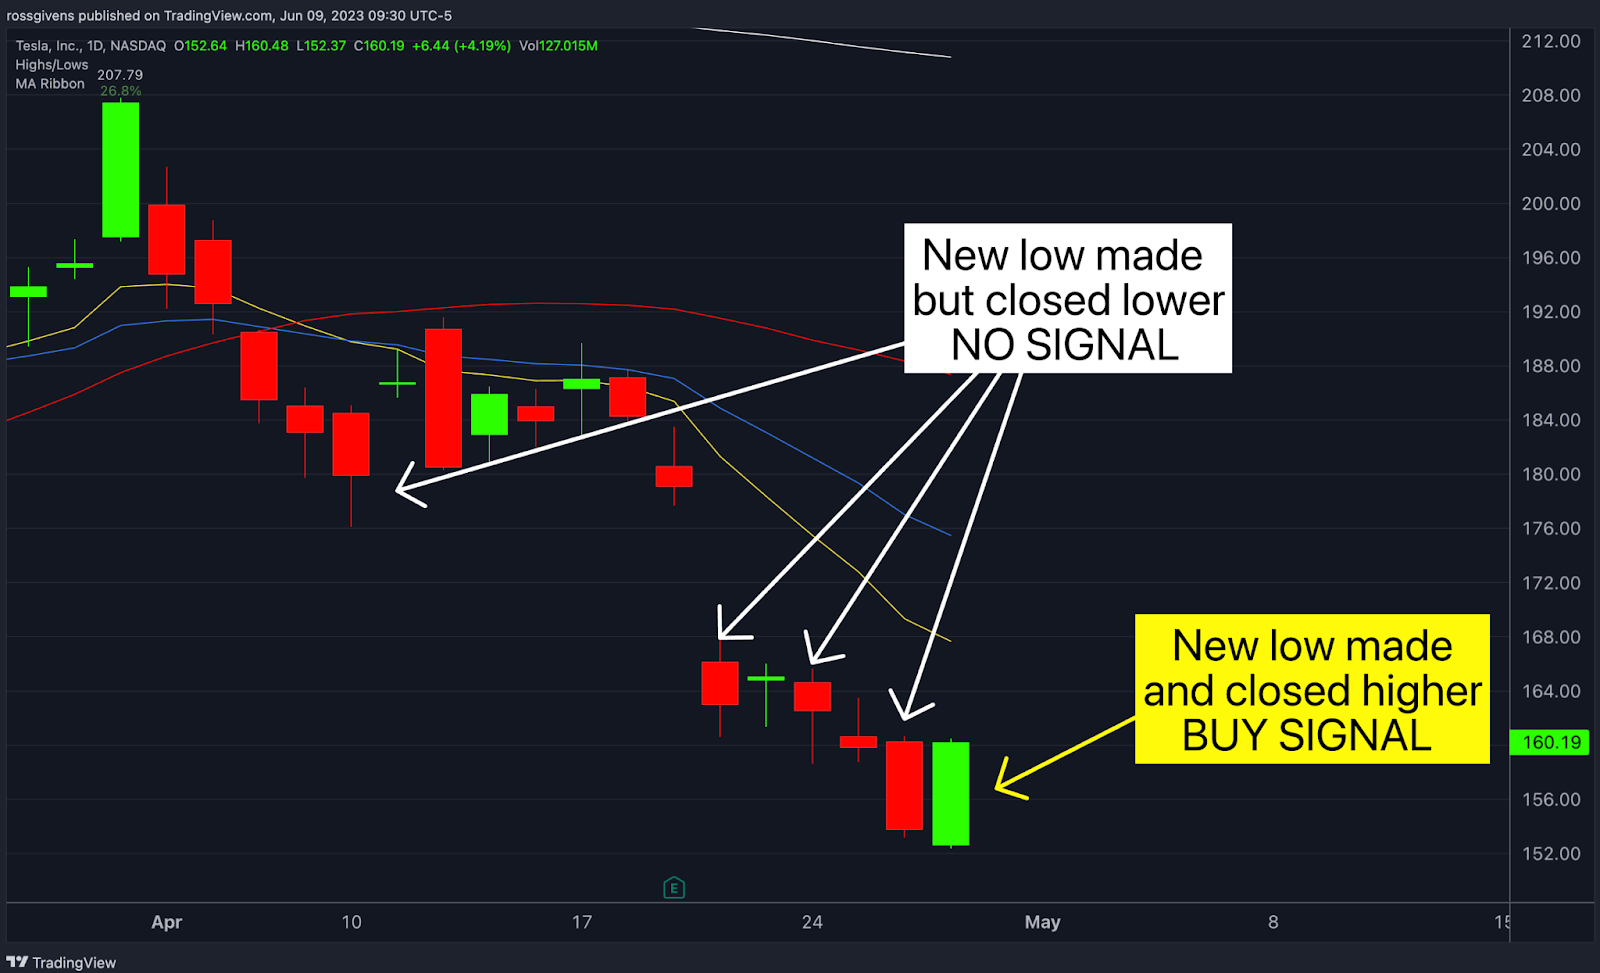
On a daily chart (each candle is 1 day) the stock needs to make a new low. It doesn’t have to be a new 52-week low, but you want to see a downtrend of at least 6-8 weeks and the stock to trade below the low of that period.

Next, and this is the important part, the stock must rally back up and close the day in the green.

In other words, it made a new 2-month low in the morning, and then finished the day above the previous day’s close.

Here is a closer look at the TSLA example I mentioned earlier:

Notice how the first few times it made a new low it closed the day in the red – below the previous day’s close.

Then, in the last candle, TSLA made a new low but surged higher to finish the day up 4%.

That is a valid upside reversal buy signal.

The execution is simple…

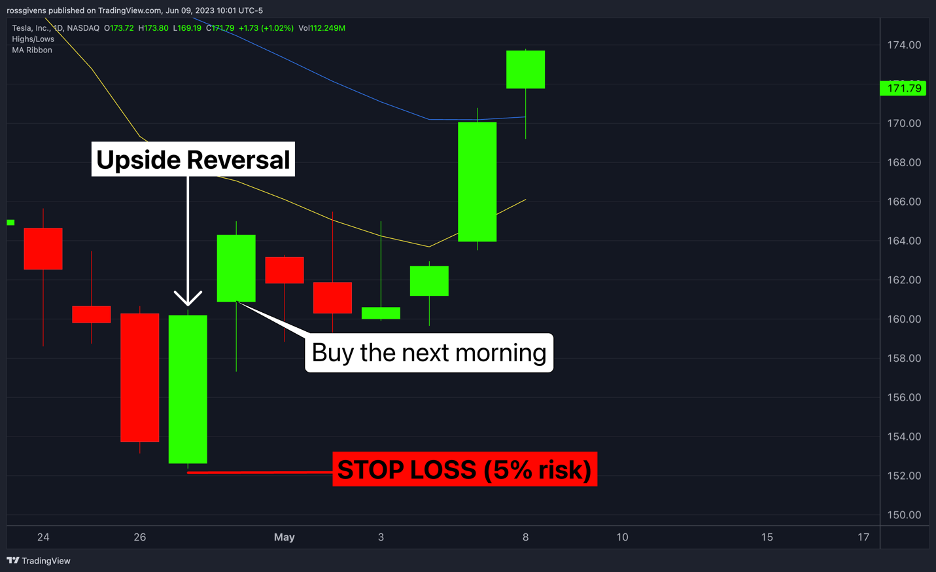
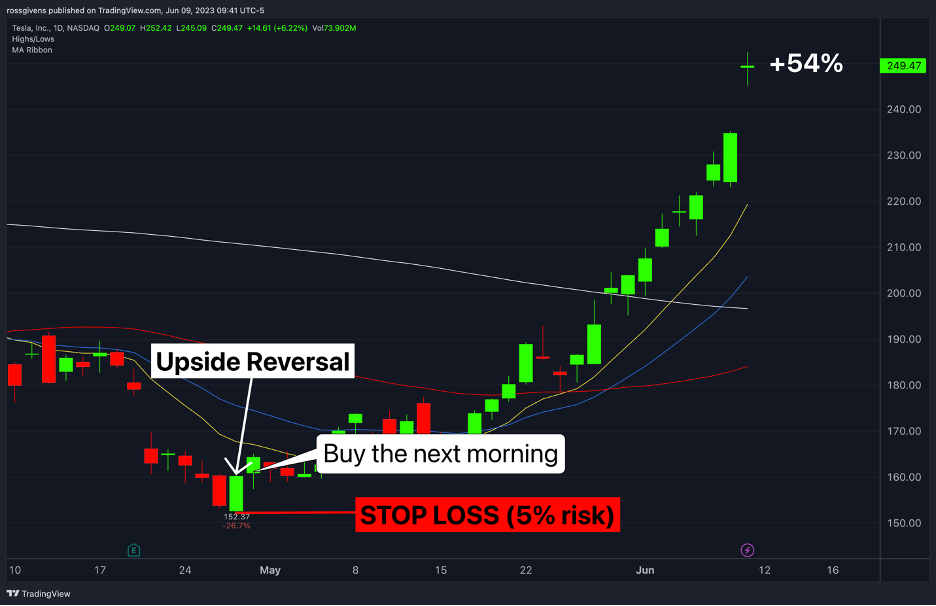
Buy the stock the next morning.

Set a stop loss a few cents beneath the low of the previous day (see image below).

The risk is usually less than 10% on the trade.

It was only 5% for TSLA.

The upside was substantially higher…

It’s not going to work every time.

Nothing does.

But it is a low risk/high reward setup.

And you’re going to look pretty smart when you buy the next TSLA right off the lows like a freaking market wizard.

I ran a scan today to see if I could find any to take on Monday, but there were no setups.

Here are three other trade ideas I like though…

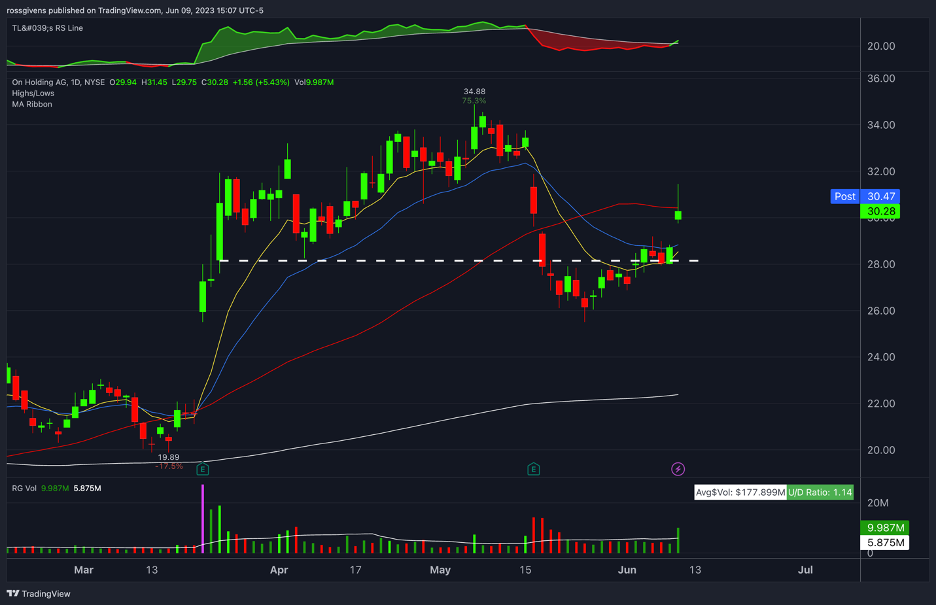
On Holding (ONON)

UBS analysts doubled down on its bullish view on the stock today. They have a buy rating on ONON and a price target of $42. Shares are up 5% today on the news.

This stock has been a favorite of mine for several months. It went public in late 2021. It performed great initially. But the 2022 bear market gave it a beating.

ONON has more than doubled off its 2022 lows and the company is growing sales at an astounding 80% quarterly rate.

Shares dipped below the 50-day moving average (red line on chart) in May and did an “undercut & rally.” This is where a stock will breach a previous support area triggering thousands of stop losses and taking investors out. Institutions often buy here and drive the price back above support (dashed line on chart) to continue the move higher.

Investors may consider buying here with a 10% stop loss near 27.25.

Hims & Hers Health (HIMS)

HIMS is another high growth name. Sales have nearly doubled in each of the last four quarters and losses are steadily declining.

Much like ONON, HIMS stock got overcooked after rising 195% between October and May, triggering a 30% retracement.

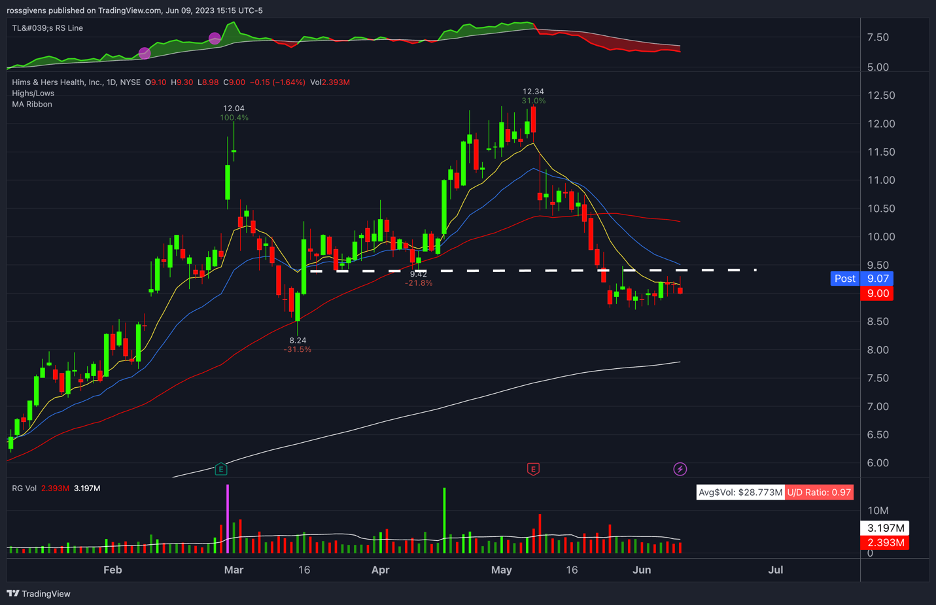
This stock also has an “undercut & rally” setup forming. Note the dashed line on the chart above. This was a significant area of resistance previously, so the move below this level last month likely took out a lot of investors.

Shares have consolidated in a tight range on low volume for the last two weeks. This is likely support buying as longer-term investors build or add to their positions.

I want to see a move above the support/resistance line at 9.50. A move above that price would be my buy trigger. My stop loss would be at 8.70 to risk 8% on the trade.

Krispy Kreme (DNUT)

Who makes the best donuts on Earth? Don’t you dare say Dunkin’. Krispy Kreme is king, and I won’t hear anything to the contrary.

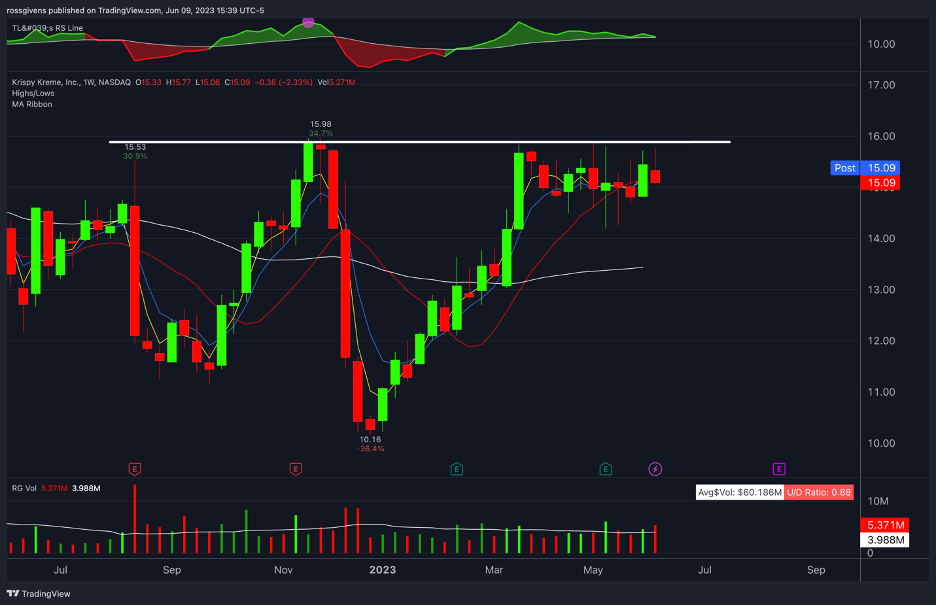
Regardless of who makes your favorite cream-filled pastry, take a look at the weekly chart of DNUT above.

This setup is fairly straightforward. The stock has not been able to breach the $16 level despite several attempts over the last six months. A close above $16, especially on above average volume, would be my trigger to buy.

DNUT is beginning a new Stage 2 uptrend here, and buying the first breakout of the second stage can often lead to a multi-month run. As a longer-term trade, I would consider risking up to 15% on it.

If it plays out as expected, DNUT should make new all-time highs.

Best wishes for your trading,
Weekly Update: Potential Breakout Opportunities

Good evening, and welcome to this week’s edition of Stealth Trades!

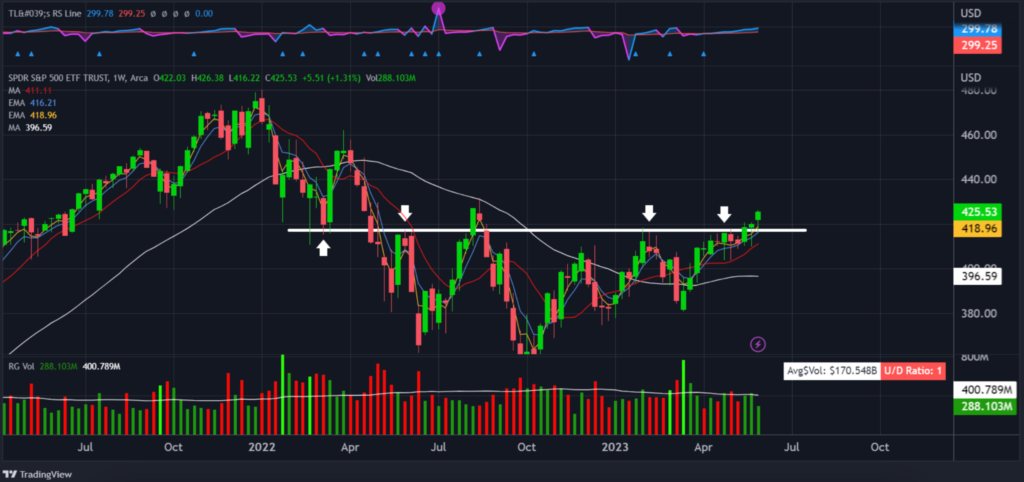
The market has finally broken above the level that we can see it has reacted off of multiple times in the past year.

Everytime we traded near it and were below it, the market had a sell off that lasted a few weeks. Now that we are above it and have tested it multiple times we can look to see if it can replicate what it did on the downside to the top side.

When in doubt, zoom out. Above we are looking at the weekly time frame because quite often we get caught aimlessly viewing the markets and aiming to force the market to show us what we want to see. Zooming out gives us an eagle eye view for us to base our analysis on.

Current prediction: The market closed above this resistance level 2 weeks ago. Last week the market traded below it as a test before ultimately trading and closing back above the resistance level. This week it seems we are closing strong above the level after we have tested it as support. If the market continues to rally then we should have a straight path to the 430 area as our next resistance zone.

Here are a few stocks I am watching right now:

Achieve Life Sciences, Inc. (ACHV)

ACHV is a clinical-stage pharmaceutical company, which engages in the development and commercialization of cytisinicline for smoking cessation. Its products include cytisine, a plant-based alkaloid with a binding affinity to the nicotinic acetylcholine receptor.

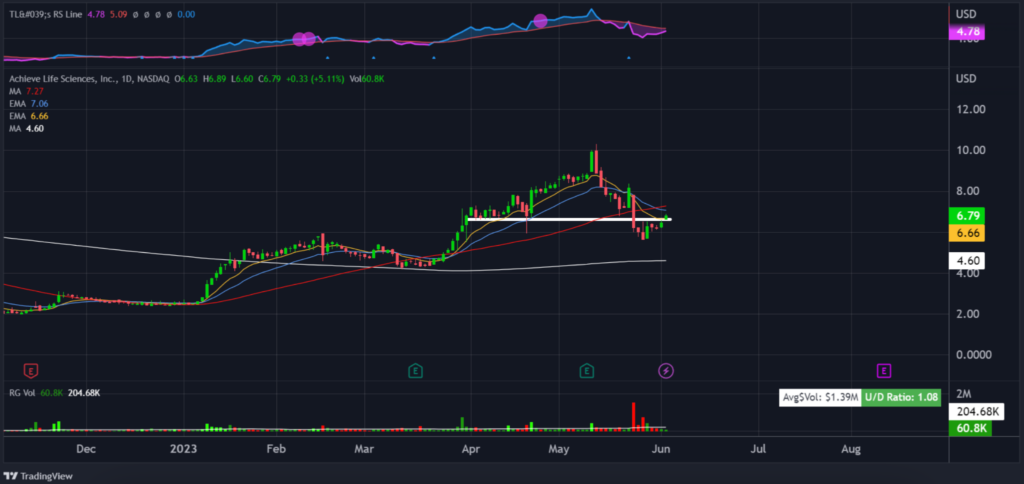
The company has been in a steady downtrend however that does not mean there are no profit making opportunities. If you zoom out to the weekly chart then you can see that from this recent low that was created we have begun to make higher lows and higher highs.

A move trading back to the last higher high that was created would be roughly a 50% return.

So due to the stock showing signs of a reversal and continuation with higher highs and higher lows, I am watching it closely.

The price is trading right back above this support level that was tested for 18 days before price came back down and violated it. This is similar to the undercut and rally pattern we have seen where you have a low that is taken out in an uptrend and then the market begins to continue the trend higher after shaking out the weak handed traders.

I would personally want to see a closure at today’s highs that made me want to take an entry.

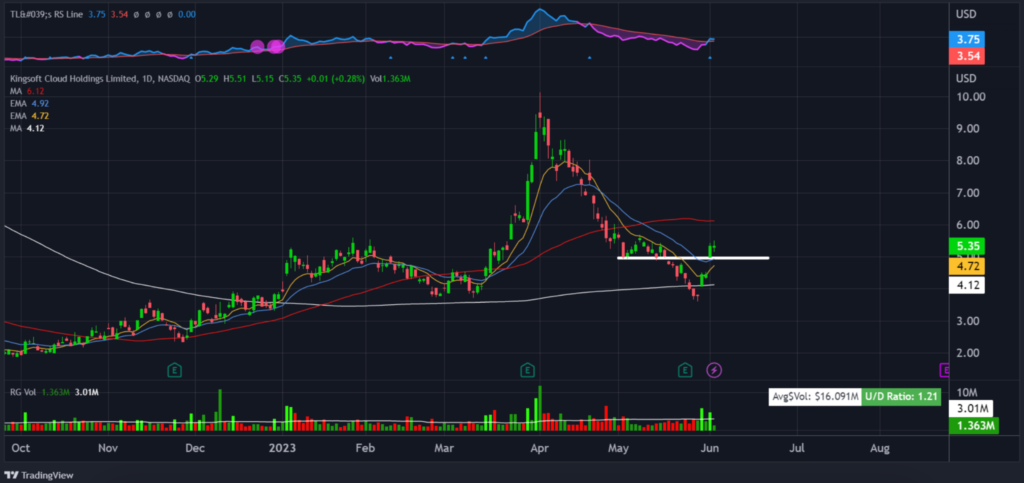
Kingsoft Cloud Holdings Limited. (KC)

KC provides services such as cloud storage and cloud computation services. It is the web cloud service of China, so to speak.

The company has recently had a nice run in price where it was creating steady higher highs and lows after trading to the sub $2 lows. From those lows last September it ran 400+ percent.

Zooming out to the weekly chart as well, we can see that the initial sell off came all the way back down to the support level it made above the 200-day moving average before it held and started to rally higher.

Price is now trading back above the last support area it created in the sell off after rallying and gapping up so aggressively. I am not a fan of the gap with no retracements so because of that I am wanting a retest of this level as we saw so many times before it ultimately sold off.

I am writing this Friday afternoon, and if we can get a retest of the $5 area and then ultimately hold then this can be a nice runner to hold back to those highs and ultimately higher prices.

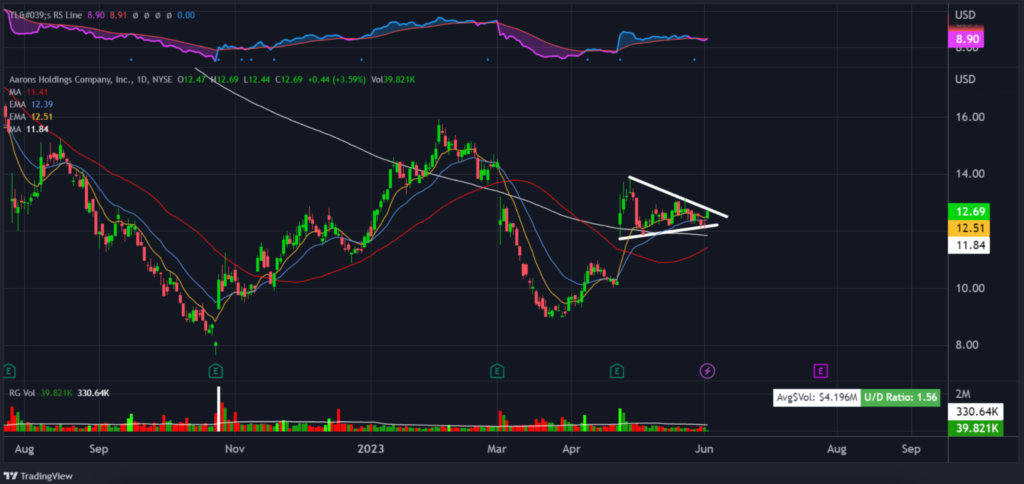
Aarons Holding Company, Inc. (AAN)

AAN is tightening in this wedge formation after making a higher low and holding above our long term 200-day moving average. Our last rally higher and move above the 200-day moving average failed to hold, however the move lower failed to continue to break the previous low and instead created a higher low that has brought us back above price.

Price made a move higher up roughly 55% before trading lower and tightening in this wedge formation. A break and closure above should be the signal needed to target the previous high, and then the failure from February and then higher prices from there.

This is a sign of sellers and buyers being exhausted because price is refusing to sell off lower and price is range-bound otherwise known as equilibrium. The fact is, however, that this is occurring above the 200-day moving average and the other moving averages are being held and respected. This tells me that there is further upside to go.

I would be interested in a break and closure above $13.00.

Best wishes for your trading,

Weekly Update: Stocks Trading in the “Chop Zone”

Good evening, and welcome to this week’s edition of Stealth Trades!

Stocks pulled back last week and are again trading in the “chop zone” where they have been stuck for two months.

The bear market may be over. But this new bull is taking its sweet time to get moving.

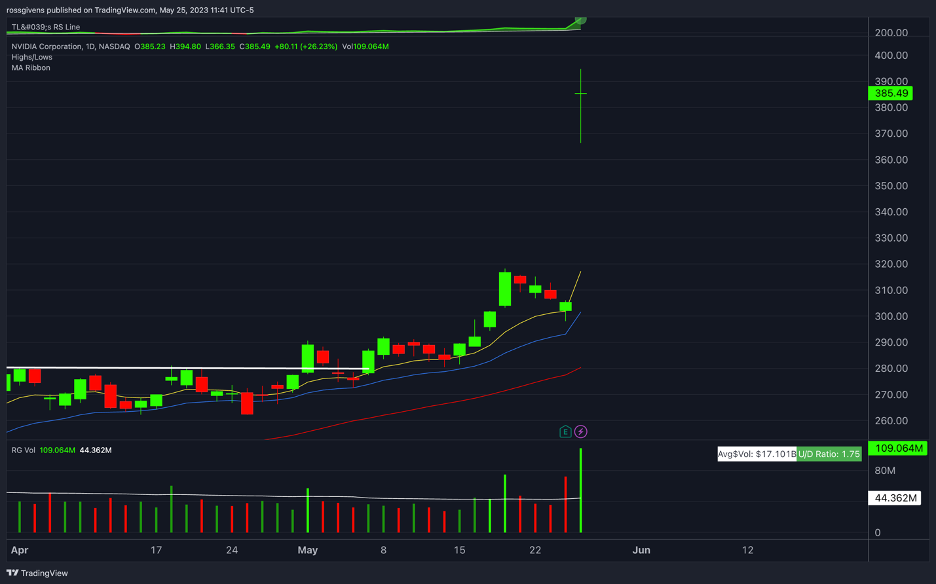
The big story this week was NVDA stock which skyrocketed as much as 30% Thursday after reporting better-than-expected earnings.

PLTR, AI, SOUN and the other big artificial intelligence stocks all gapped up on the news as well.

Artificial intelligence is becoming a dominant theme in this market. Every major tech company is dropping “AI” mentions in their earnings calls.

Nvidia makes the primary chips used in AI applications, so it makes sense that investors are piling into it.  The stock is now up 168% on the year and only needs another 5% to join the $1 trillion valuation club.

Yesterday’s move in NVDA is a good reminder that indexes are not a good proxy for the health of the stock market.

Indexes are market-cap weighted. So NVDA makes up 5.57% of the Nasdaq 100 index. Add in Microsoft, Apple, Amazon and Google, and that is 42% of the index.

Think about that…

5 stocks make up almost HALF of the entire Nasdaq index. 

When one of them is up 30% for the day, it can hide a lot of stocks going down. 

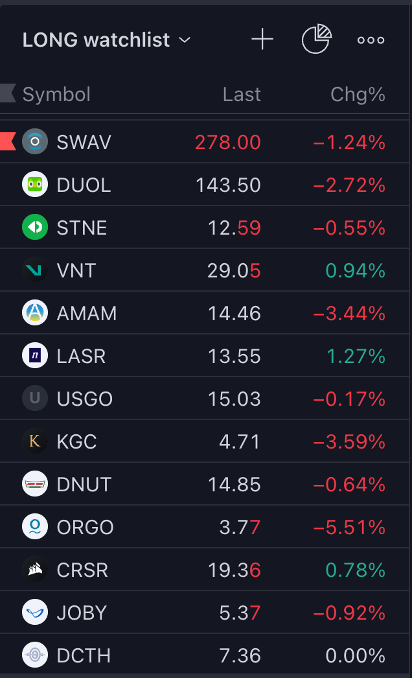
People watching the index would assume stocks had a great day. But there was a lot of red in my watchlist.

One way to take advantage of weakness like we saw this week is to buy stocks on pullbacks to key areas.

Here are a few I’ve got my eye on…

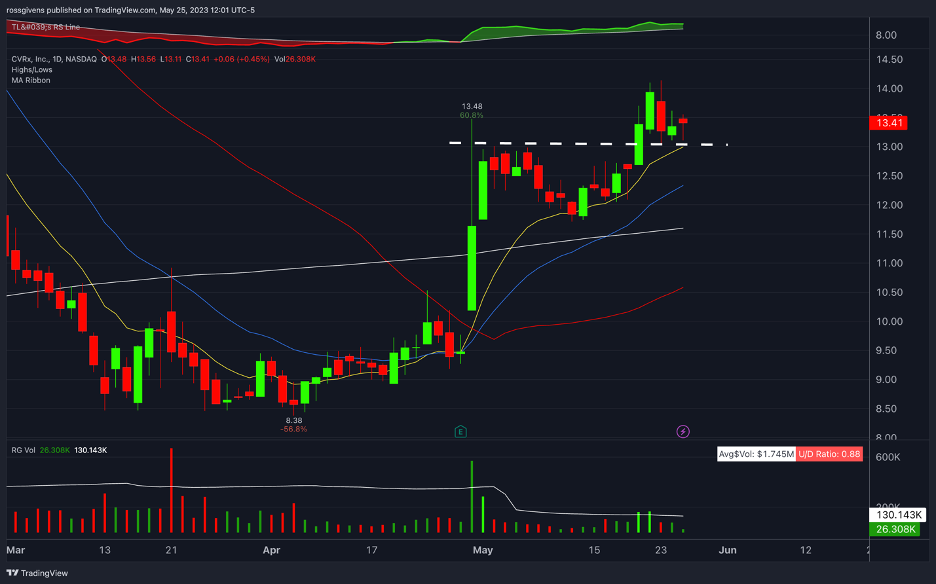
CVRx (CVRX)

CVRX has shown tremendous strength this month. It reclaimed all of its moving averages in two days and has managed to hold above the 10-day EMA ever since.

This short-term moving average is what I want to see supporting the stock on a strong move up.

Shares pulled slightly back this week and kissed the support/resistance level at 13.00. 

I would consider buying in the low $13 area with a stop loss at $12.00.

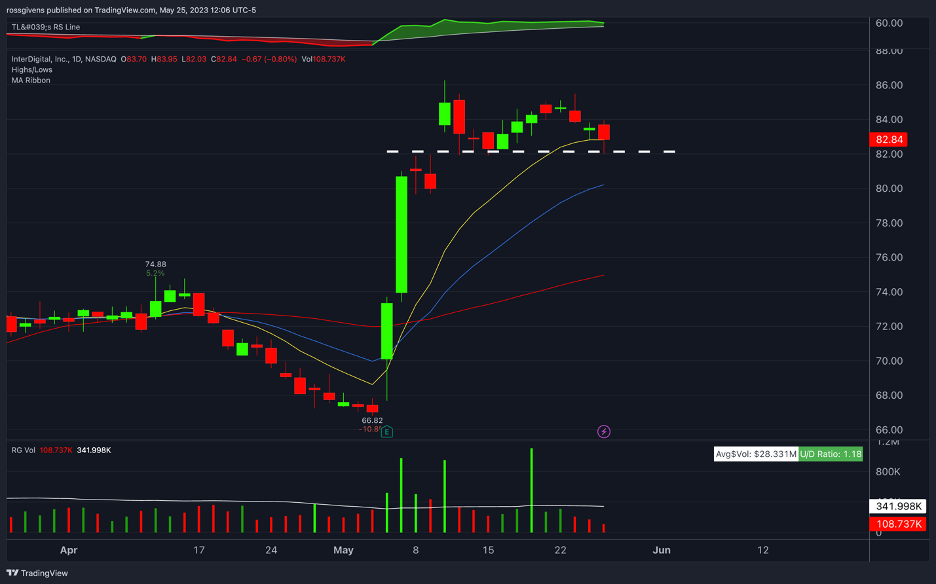
InterDigital (IDCC)

IDCC is another high-flier taking a pause to digest its recent surge.

Investors loved the most recent earnings report and drove the stock up 28% in a week. The run happened on good volume with nice follow-through, so I expect to see shares continue to drift higher.

Right now, IDCC has a support shelf near $82. I would be surprised to see it get much lower than that.

A trader could buy here with a 5% stop loss for a low-risk trade.

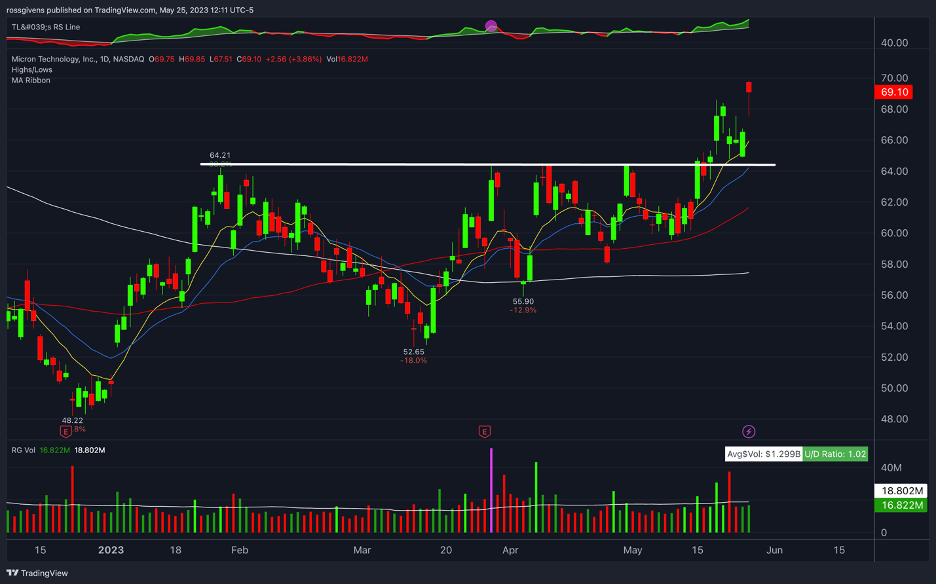
Micron Technology (MU)

Micron is a semiconductor stock riding some of the momentum from yesterday’s earnings beat at Nvidia.

Notice the textbook breakout pattern that has formed over the last three months – a series of shallowing retracements with resistance at $64.

The 200-day moving average is finally turning up and other MA’s are properly stacked and trending higher.

This is the first breakout into a new Stage 2 uptrend which is exactly where I like to buy. Look to build a position in the mid $60s if possible.

The trade sours if it closes below its 50-day moving average (red line on chart) which is currently around $62 and rising.

Best wishes for your trading,
Weekly Update: Stock Breakouts and Market Momentum

Good evening, and welcome to this week’s edition of Stealth Trades!

“A watched pot never boils.” 

My mom used to say that. And it’s as true for cooking noodles as it is for trading stocks.

Last week we talked about how quiet the market was and our growing frustration with the sideways action we have experienced for the last several weeks.

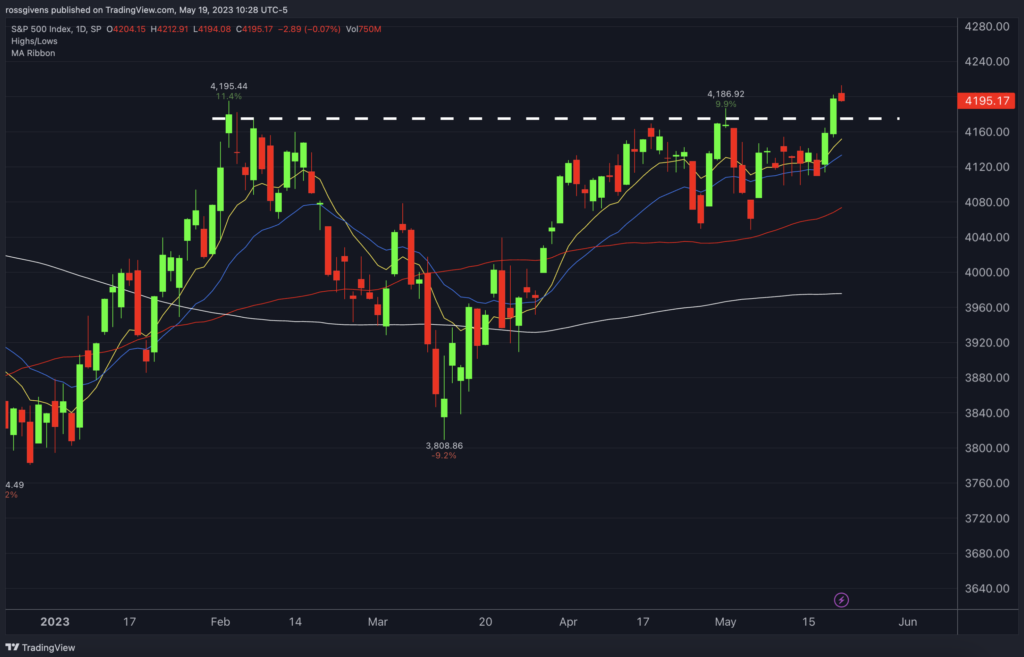
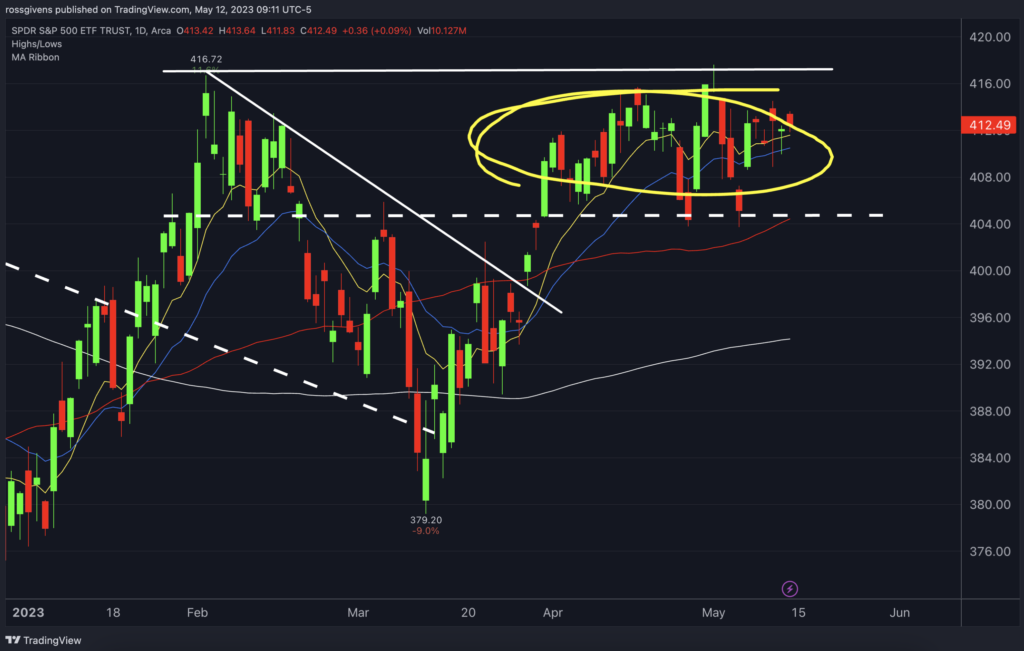
And wouldn’t you know it, the S&P 500 just made a new high for the year.

If you have been a member for a while, you should also see a textbook breakout pattern taking place in the index.

This is what we look for in individual stocks. When we get it paired with a broader market buy signal like this, I tend to get aggressive and take bigger trades.

Yesterday’s breakout higher pushed the index to 20% above the October lows, making this officially a bull market.

The Nasdaq has done even better – currently up 32% over the same period.

The indexes are, of course, market cap weighted. This means big stocks like Apple, Amazon and Google have far more influence on the numbers than small and medium-sized companies.

To confirm that the move is real, we want to be sure that the majority of stocks are participating in this rally.

Stocks in uptrends should, for the most part, remain above the 50-day. That’s my “line in the sand” that separates stocks going up from those going down.

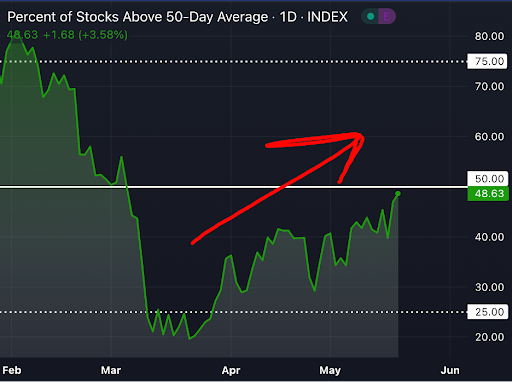
So, I like to watch the percentage of stocks above their 50-day moving average.

If you use TradingView, the ticker symbol for this reading is MMFI.

As you can see, we have progressed from having only 20% of stocks above to almost 50% over the last 8 weeks.

This is a good sign and confirms that mega-cap names are not masking weakness below the surface.

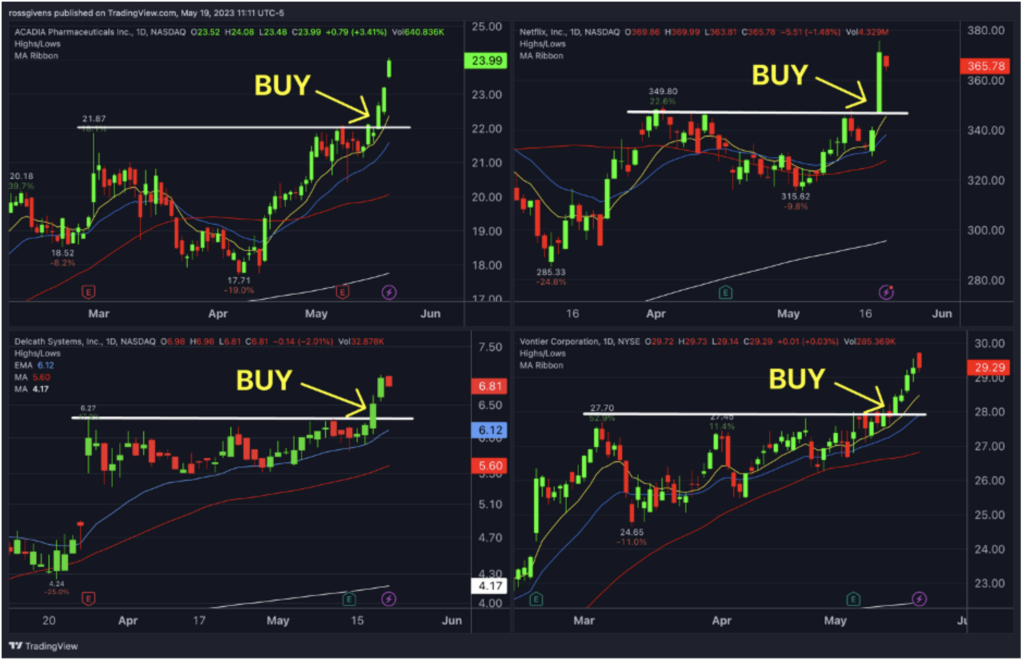
Notice how these stock breakouts lined up with the overall market:

This is a powerful combination that can lead to huge returns.

I maintain an active watchlist of stocks at all times that look ripe for a move higher. Here are three I’ve got my eye on right now:

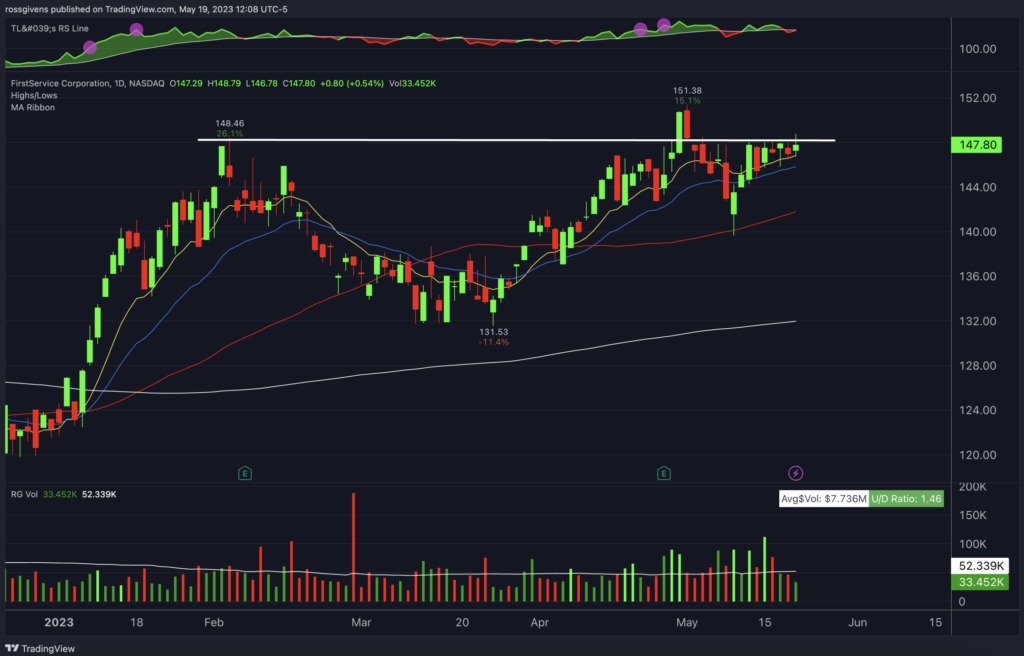
FirstService Corporation (FSV)

Charts don’t get much prettier than this.

After ripping through the 200-day moving average to make a new 52-week high, FSV pulled back and put in a series of shallowing retracements.

Resistance is clearly defined at the $148 level.

There was a failed breakout you can see at the end of April. But after a shakeout move to the 50-day moving average, shares rebounded quickly.

We have also seen nice buying volume over the last several weeks that has the fingerprints of institutional activity.

I took a position in this stock Friday morning. My stop loss is at $139.60, just beneath the swing low.

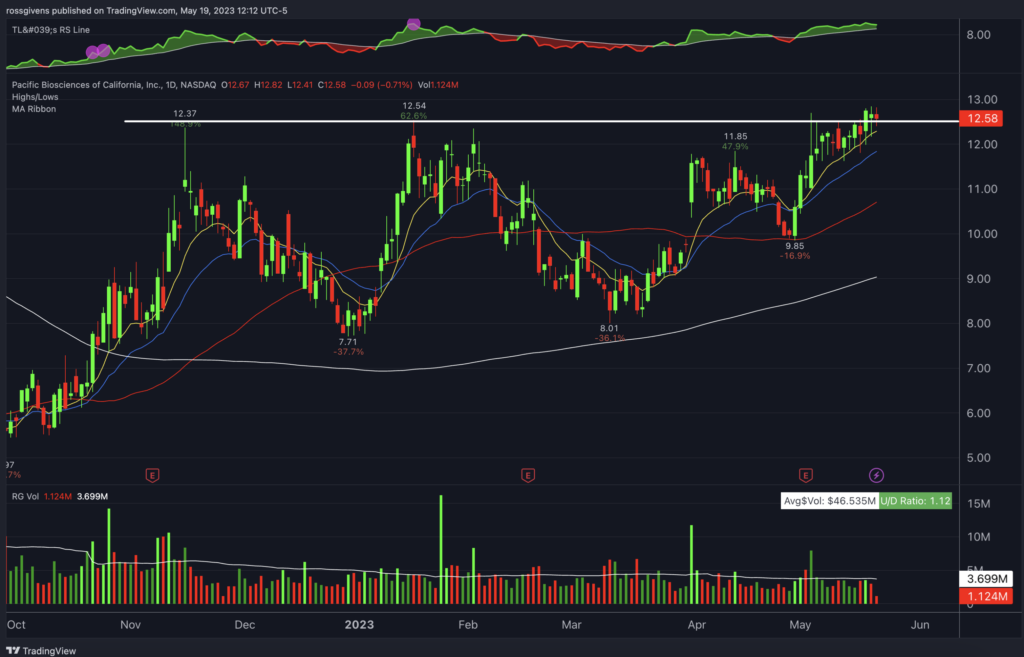
Pacific Biosciences of California (PACB)

PACB is another great looking compression pattern forming below the $12.50 area.

Notice how the pullback area has gotten very tight and trading has been contained to a narrow range over the last three weeks. This is what I like to see.

The stock is trying to break out here, but it hasn’t mustered the strength just yet. I bought shares of this stock today as well with a stop at $11.60.

If it is going to run, it should not get below its 21-day moving average (blue line).

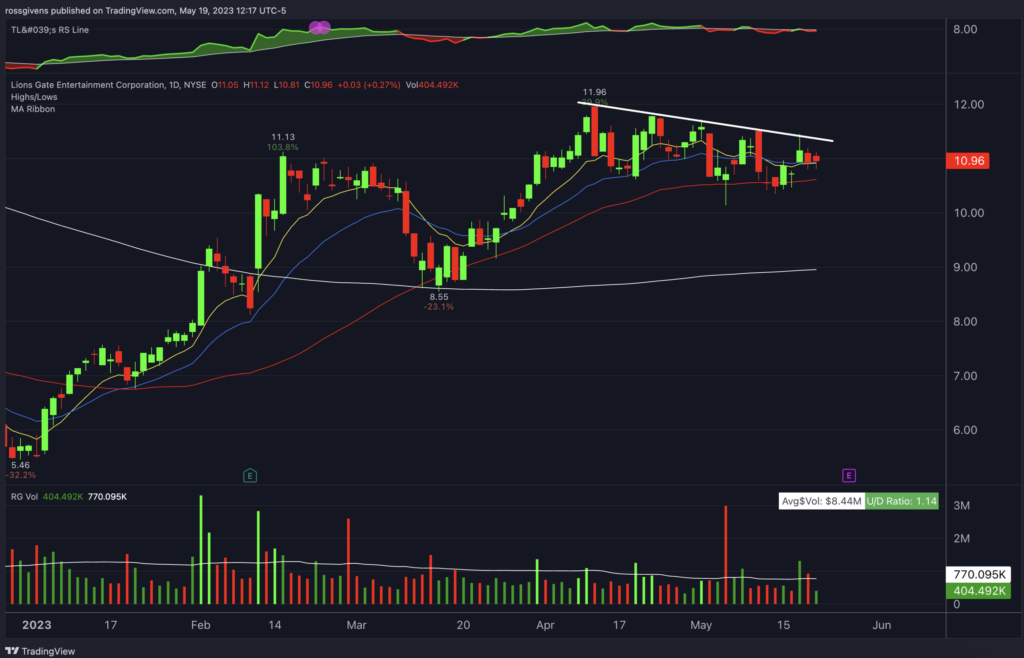
LionsGate Entertainment (LGF.A)

The LionsGate movie company looks very appealing here. The stock has already doubled this year, and it looks like it wants to run further.

This was a $20 stock two years ago, so there is plenty of upside still.

The 200-day moving average has turned up and is now trending higher. We also have our shorter-term 10, 21 and 50-day moving averages tightening up to provide support in what I call a “launchpad” setup.

If LGF.A breaks above the trendline I’ve drawn on the chart, I will consider buying. My stop loss would be at $10.30.

Best wishes for your trading,

Weekly Update: Bears Losing Ground and Tech Stocks Leading the Way

If this market moves any slower, it is going to get a parking ticket.

The S&P 500 index continues to consolidate in a tight range as it has been for the last six weeks.

This is not necessarily bad news, however. In fact, I believe it is just the opposite.

Excluding anomalies like the 2020 V-shaped correction, markets do not go straight up after a bear market.

There is a period of backing and filling that takes place as bulls and bears battle it out for direction.

Stubborn bears who are convinced we have lower to go sell into the initial rallies and cap the moves higher.

This causes pullbacks which are bought by bullish traders trying to build back the positions they sold in the bear market.

These conflicting forces cause range-bound action which can be frustrating to say the least.

But stocks are holding up well. And sellers are no longer in control.

We are nearing the end of earnings season and the results have been good overall. Bad numbers from any of the key players could have sent the major indexes tumbling. More dovish language from Powell at last week’s Fed meeting would have also been trouble.

But the market survived these potential landmines and held its ground.

It has been 214 days since the market made a low. Bears are steadily throwing in the towel, and we have seen a series of higher highs and higher lows.

CNBC is too scared to say it so I will… 

THE BEAR MARKET IS OVER.

Pullbacks should be bought, and investors should focus on market-leading stocks that have made the largest advances since the October low.

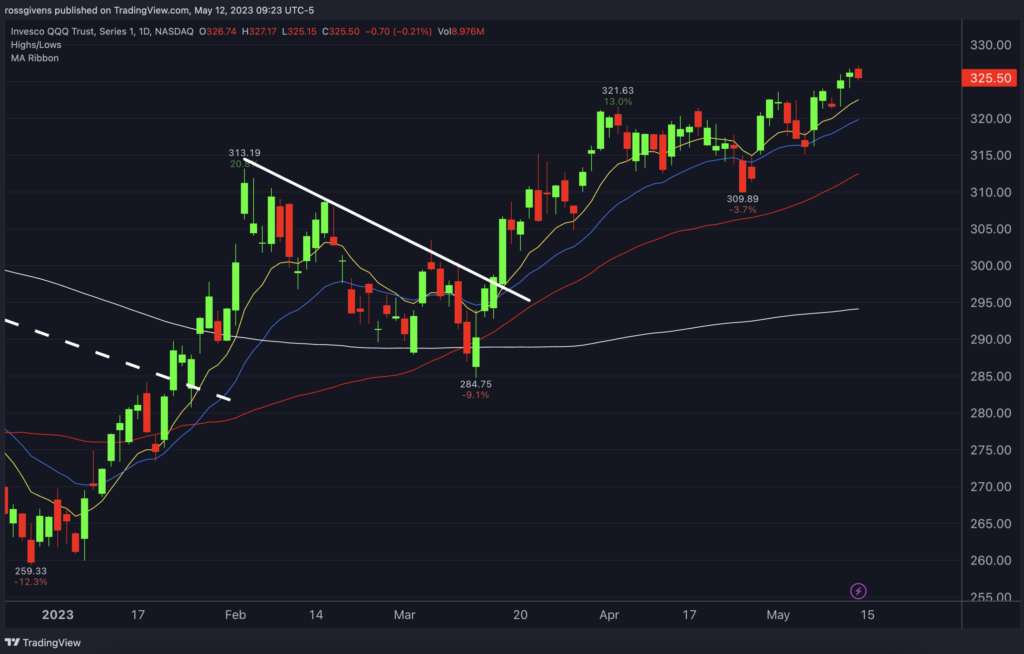
So far, tech is leading. The Nasdaq index is outpacing the S&P 500 – currently up 28% since October vs only 19% in the S&P.

The tech-heavy Nasdaq is also making new highs as you can see in the chart below:

Here a few powerful stocks to have a look at:

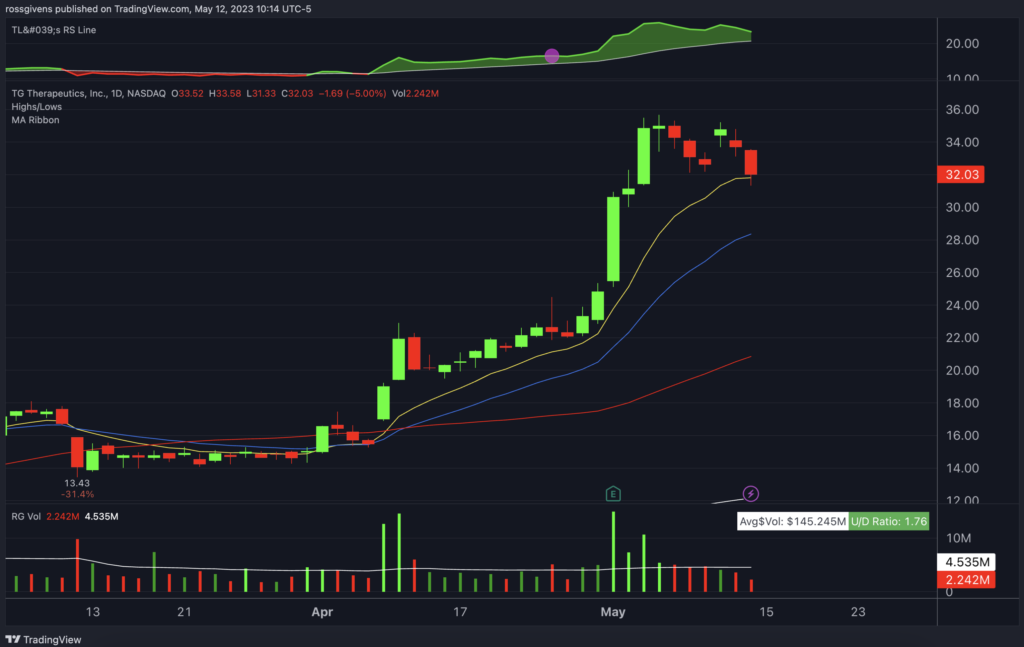
TG Therapeutics (TGTX)

Biotech stocks can make huge moves, and this one is no exception.

TGTX more than doubled in a month and is showing no signs of slowing down.

Slower-trending, blue chip stocks tend to ride their 50-day moving average (red line on chart) on the way up.

Stronger stocks tend to hold their 21-day moving average (blue line).

But with high-flying honey badger stocks like TGTX, you are lucky to get a pullback to the 10-day (yellow line).

TGTX touched its 10-day exponential moving average on Friday, making the first real pullback buying opportunity since the initial surge.

I would consider buying here with an 8-10% stop loss.

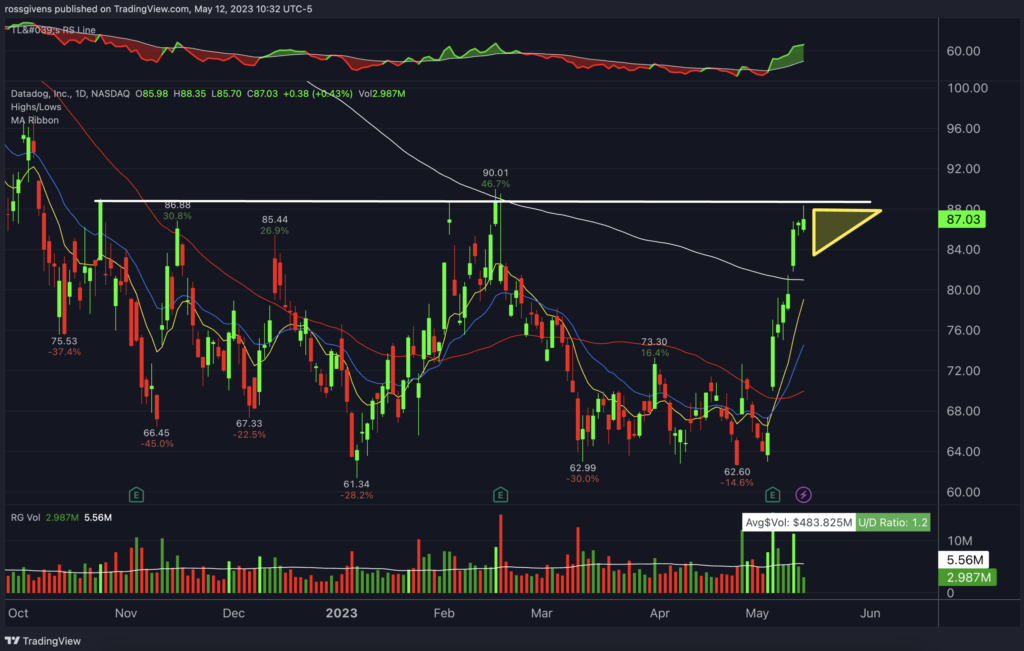
Datadog (DDOG)

Datadog is trying to put end to what has been a vicious Stage 4 downtrend.

The stock fell 68% in last year’s bear market but is now rising quickly off the lows.

DDOG has reclaimed its 200-day moving average (white line on chart) for the first time in over a year after reporting better-than-expected earnings numbers last week.

The stock has stalled just under $90 per share where it has seen resistance previously. I would like to see the stock consolidate for a few days in this area (yellow triangle) to digest any sellers and then break out to new highs.

A move through $90 on above average volume would be buyable for me.

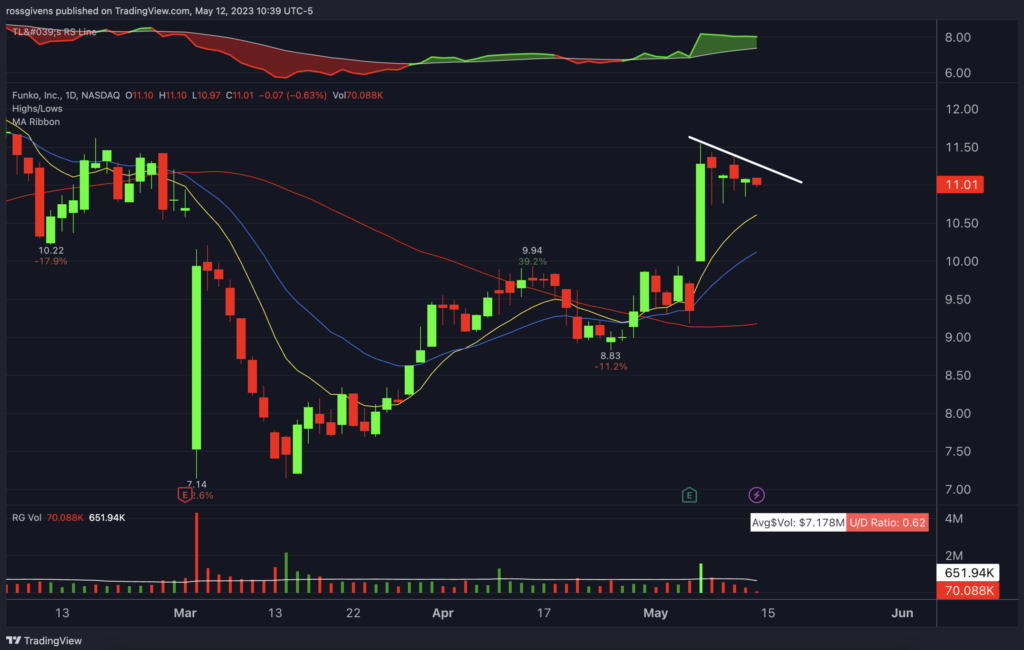
Funko (FNKO)

Much like Datadog, Funko took a beating in last year’s bear market.

But the stock is quickly coming back to life. FNKO surged on earnings last week and has given back almost none of the initial move.

Shares are barely retracing and doing so on minimal volume – a sign that no one is selling.

This trade is pretty simple – draw a trend line and buy when it breaks above it. 

A good breakout should not retrace to the low of this consolidation (currently 10.74), so you could take a stab at this one with very little risk.

Best wishes for your trading,
Ross Givens

Editor, Stealth Trades

Weekly Update: Fed Hikes Rates Again

Good evening, and welcome to this week’s edition of Stealth Trades!

After four ugly days to start the week, stocks ripped higher on Friday to finish the week roughly unchanged.

The market digested another 0.25% interest rate hike announced at Wednesday’s Fed meeting. This was followed by an hour of back-and-forth nonsensical rambling by Fed Chairman Jerome Powell who refused to say they would be raising, lowering, or pausing interest rates in the second half of the year.

If you haven’t been following, Powell is the same clown who printed more money than anyone in history to prop up markets after COVID. 

The enormous infusion of funny money into the economy caused rapid inflation. Powell said it was transitory (fancy word for temporary). 

It wasn’t.

Now he is embarrassed, along with the President and all the other politicians who do not know how the economy works and believed they could print and spend their way out of the problem.

My guess is that rates have now peaked. The CPI and PPI reports scheduled over the coming months will likely confirm that inflation is trending lower and not require additional interest rate hikes.

I expect to see the Fed begin cutting rates next year, possibly at the tail end of 2023. So, if you’re looking to refinance your mortgage, mid-2025 is probably going to be your best chance.

With the Fed announcement out of the way, we can return our focus to individual stocks.

We are right in the middle of earnings season, and so far, the numbers have been pretty strong. Most of the big names beat expectations and made nice advances.

Some have failed to impress, however. 

When that happens, and a company reports sales and earnings below analyst expectations, a stock can fall dramatically. 

Even if last quarter’s numbers were good, executives will sometimes lower guidance and suggest lower sales and earnings going forward. This can cause an even bigger dip in the stock price.

Because of the danger of holding stocks through earnings announcements, I try to only do it if I have a significant gain on the stock already.  I will risk my profits, but not my capital. 

Instead, I will wait until after the earnings report to initiate a position. 

Below are three of my favorite stocks reporting earnings in the next two weeks:

Hims & Hers (HIMS)

I have talked about this stock before. In fact, I recommended it in the April 14 weekly update, and the stock has risen another 23% since then.

HIMS is currently consolidating at all-time highs before its earnings announcement.

They are scheduled to report after market close on Monday, 5/9. 

If I were a gambler, my bet would be that they beat and surge higher. Personally, I’m not willing to risk it which is why I recently sold my position in HIMS.

But if Monday’s numbers are good, I will consider buying back in on Tuesday morning.

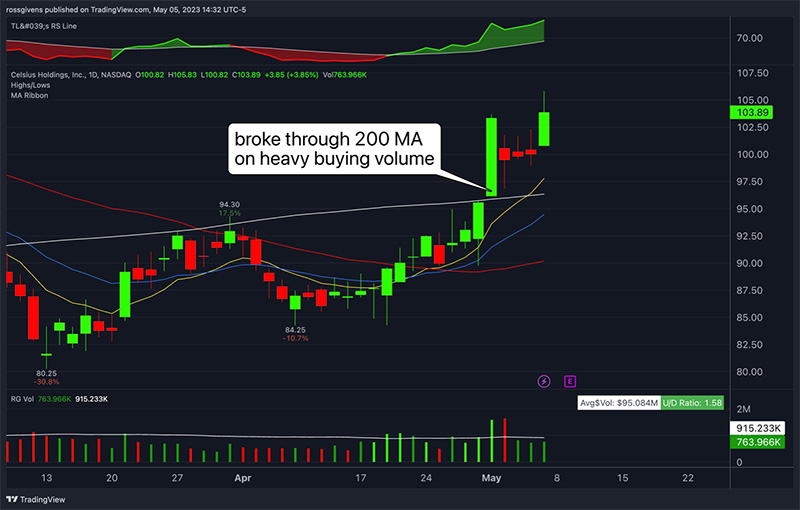
Celsius Holdings (CELH)

The energy drink maker has always been a mover. The stock trends well and routinely makes 50% moves in a few weeks or months.

The stock was a big leader in 2022 and actually rose more than 100% in the middle of the bear market. 

It has since pulled back, but it is again showing a lot of strength.

Shares ripped through the 200-day moving average to reclaim their long-term uptrend on heavy buying volume. And after three inside days, it pushed to new highs on Friday.

CELH reports earnings Tuesday after the close. All signs point to them beating expectations, but I still wouldn’t risk the farm on it.

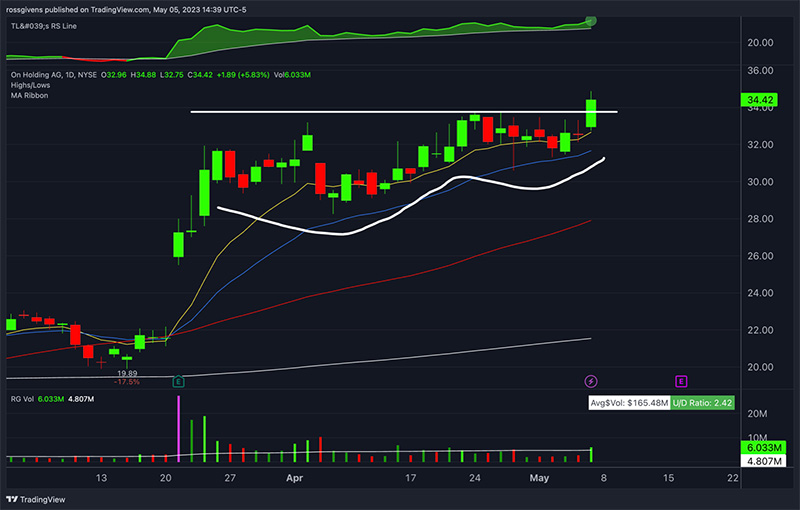
On Holdings (ONON)

On Holdings, the maker of OnCloud tennis shoes, is one of the hottest stocks in the market right now.

It went public in 2021, just in time to get hammered in the bull market.

But shares have come back with a vengeance.

ONON has already doubled this year and is making new all-time highs as I write this update.

Notice the textbook consolidation pattern followed by a pocket pivot breakout through resistance. This is healthy action and exactly what we expect from stocks under institutional accumulation.

We have a little time before this one reports earnings. The announcement is scheduled for a week from Tuesday on May 16th before market open. If I had a profit cushion of at least 10%, I’d probably hold this one through the report.

Best wishes for your trading,
Ross Givens

Weekly Update: Market Resistance and Three Stocks to Watch

Good evening, and welcome to this week’s edition of Stealth Trades!

Editor’s Note: Ross is out of town today on a 40th birthday trip to Kentucky. Our top analyst, Jean Fede, is writing this week’s update.

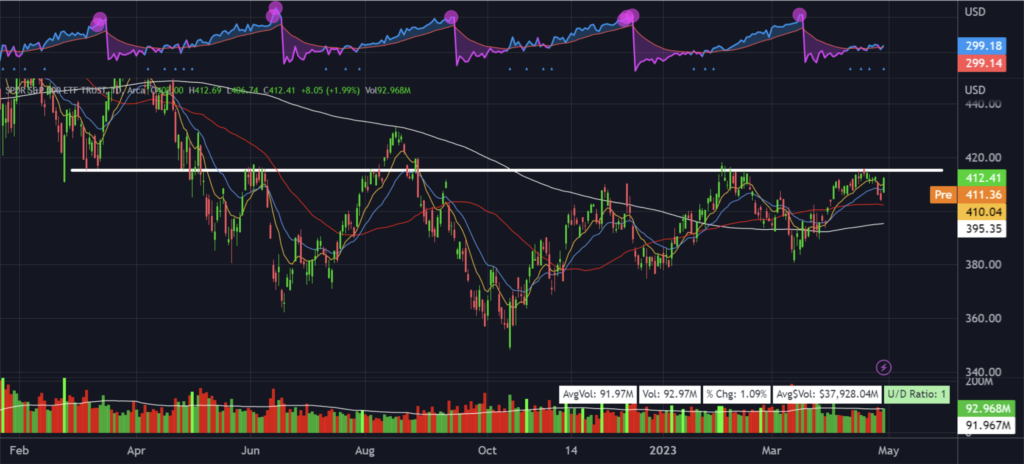
The market seems to have found previous resistance that has been tested multiple times in the past year.  This area acted as a support level when the sell-off started back in March of last year and it has now run back into it multiple times.

Every time we get nearby the market seems to stall out and begin to chop sideways, not really making any significant moves.

Honestly, it seems as if the market is preparing to have an aggressive break and finally hold above it.

As you can see from the chart above the 200-day moving average is now beginning to curl upwards and the deeper retracements we have created have all been higher than the previous, i.e. higher lows.

The current prediction would be a break above this level, and we can possibly see a run into the 430 area again as we did in August of last year.

At the time of writing this, we are only a few percentage points below the level, and we are right above our 50-day moving average.

Here are a few stocks I am watching right now:

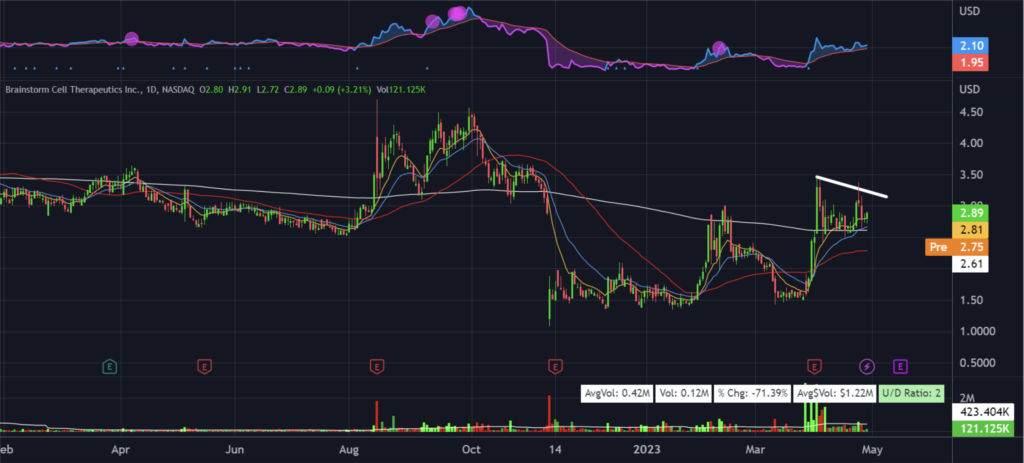
Brainstorm Cell Therapeutics, Inc. (BCLI)

BCLI is a biotechnology company that develops and commercializes autologous cellular therapies for the treatment of multiple neurodegenerative diseases.

The company has had its leg cut from under them from the highs made in October 3 years ago, all the way down to where we are now.

Shares were trading at roughly $18 and are now trading at roughly $3.

But the stock is showing signs of a possible new breakout to the upside.

The 10-day and 21-day moving averages are both above the 200-day moving average. The 50-day moving average is currently being angled upwards.

I would personally want to see a break above the $3.30’s area to look for any sort of entries.

Brookdale Senior Living Inc. (BKD)

BKD’s main business model is the operation of senior living communities.

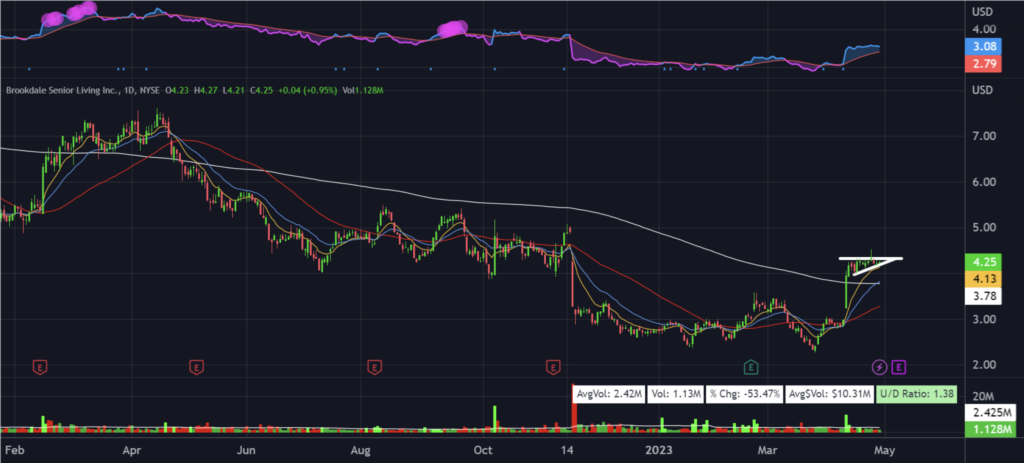
The company has recently had a spike in price, increasing by over 90% in only 31 days.

Last month’s earnings report was a beat on both ends and we did not really see a continuation of that move. However, prices have shot up before earnings this time around, and now we are basing right above the 200-day moving average.

Since this recent run up, the candlesticks have been small and tightening in this wedge formation.

If we take a look back at the current price, then we can see that the decline in price came all the way back down to those lows of COVID before making this significant move higher.

As of Friday morning, I believe that once we break the $4.30 area that we can possibly look to take an entry there with a stop loss just beneath the 10 EMA roughly at $4.10.

Cardlytics, Inc. (CDLX)

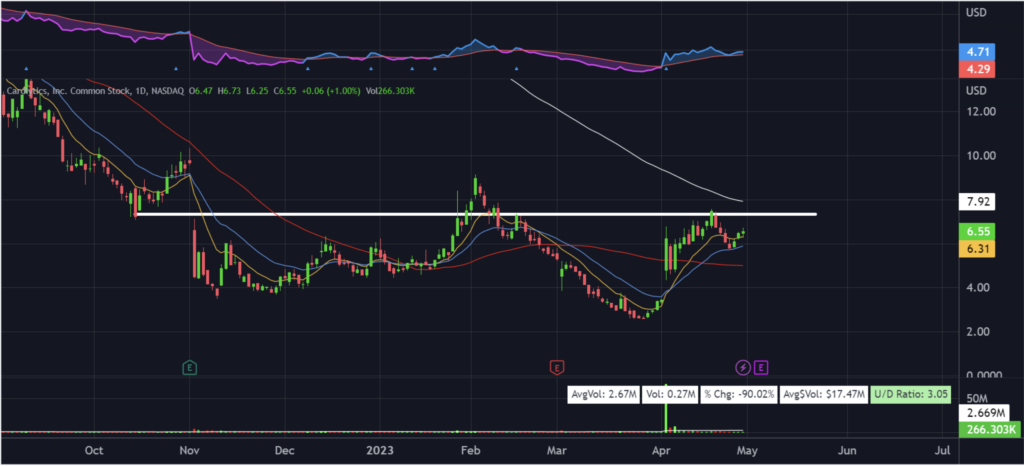
Cardlytics Inc. had a spike just a few weeks ago that was over 25x the average volume.  That rally led us to a resistance area that previously acted as a support level a few months ago.

Up 190% from the lows last month, we could be in for another ride on this one. We can see here that price was previously trending below all 3 moving averages and each retracement into them usually led to lower prices.

This is a sign of buyers’ intent because they have previously bought the price above the moving averages and we saw an aggressive rally higher. Now it has occurred again, if we can see another rally above and break of this level then we can be in for another ride.

CDLX is also respecting our 10-day and 21-day  moving averages so far, as it has retraced and it is currently still above them.

I think a break above $7.40’s would be an ideal entry point. 

Best wishes for your trading,
Weekly Update: Remaining Bullish for the Market

Good evening, and welcome to this week’s edition of Stealth Trades!

​​Hopefully you took some of the trade ideas I gave you in last week’s update.

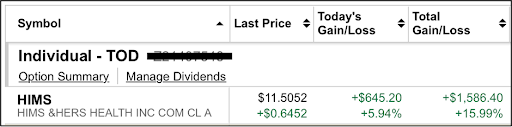
HIMS is up over 17% since outlining it in last Friday’s email and ONON is up almost 6%. Those are solid gains in a week where the indexes went nowhere.

I bought 1,000 shares of HIMS last week, and I’m kicking myself for not buying more.

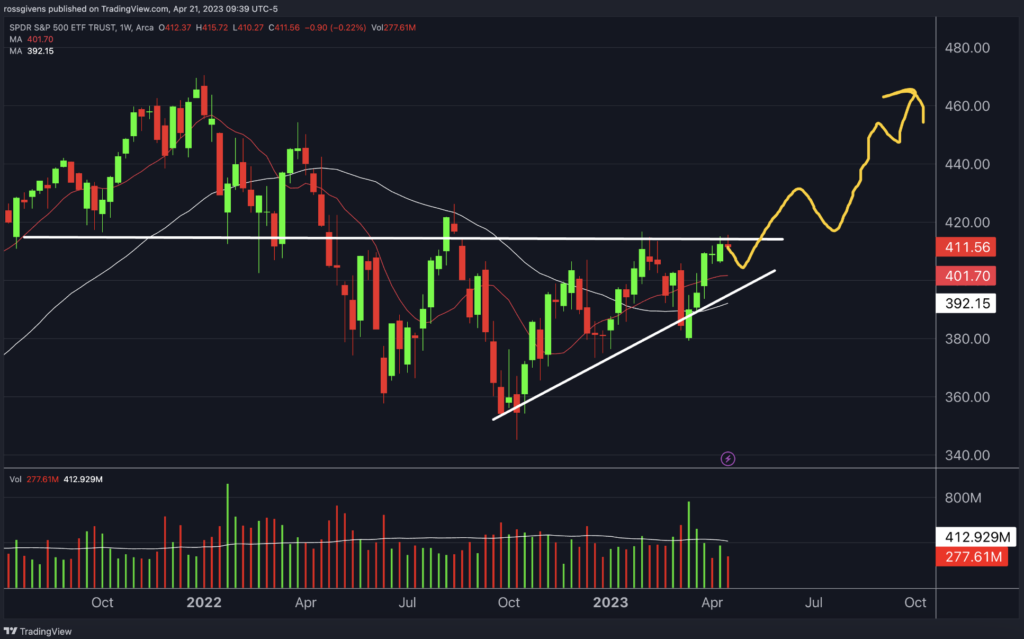
For the overall market, I remain bullish and expect stocks to move higher over the next few months.

In the weekly chart of the S&P 500 below, I’ve drawn in yellow what I expect to see.

Notice the wedging action we have seen since markets bottomed in October. This is constructive action.

Stocks have done the usual “backing and filling” to carve out a bottom and set up for the next leg higher.

In order to achieve above average returns, however, we must continue to focus on the best stocks in the best groups. This is where we tend to find the biggest winners.

Right now, some groups look better than others.

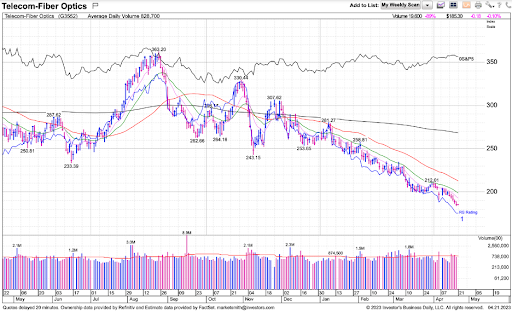
Fiber Optics stocks, for example, are being massacred:

I would not buy a stock in this group no matter how good the chart or the numbers looked.

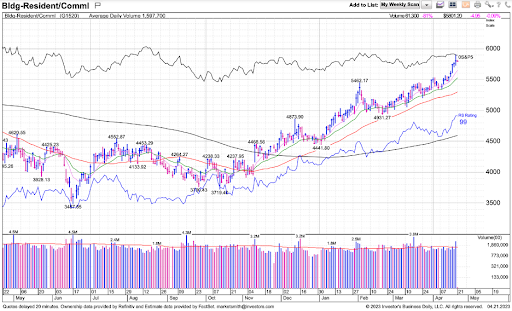
Residential builders, on the other hand, are trending upward:

Stocks in this group like DHI, TPH, PHM, MHO, and MTH are all advancing nicely and in confirmed uptrends.

My favorite trade setup, when I can find it, is a group or sector setting up in a breakout pattern and a top stock within that group setting up at the same time.

This combination of a group move and an individual stock within that group can lead to a strong advance higher.

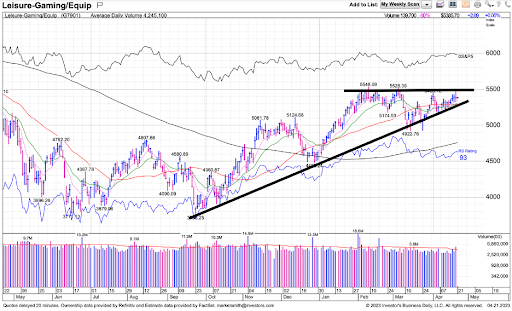
One group that looks appetizing to me here is leisure gaming.

The chart above is from MarketSmith, and it shows the combined price action of all stocks in the group.

Here are 3 favorite gaming stocks in the group:

DraftKings (DKNG)

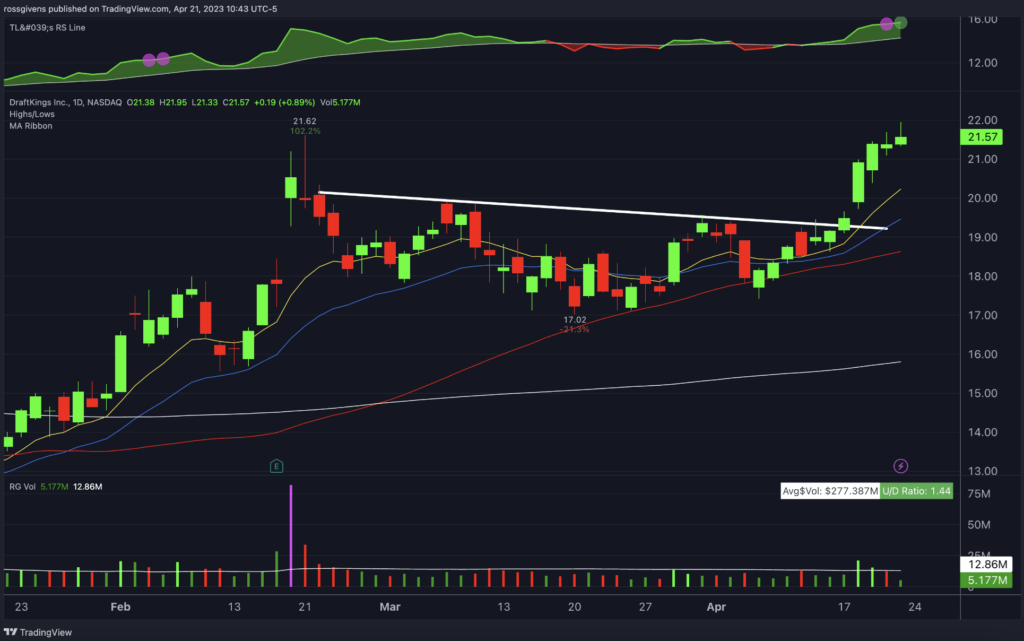
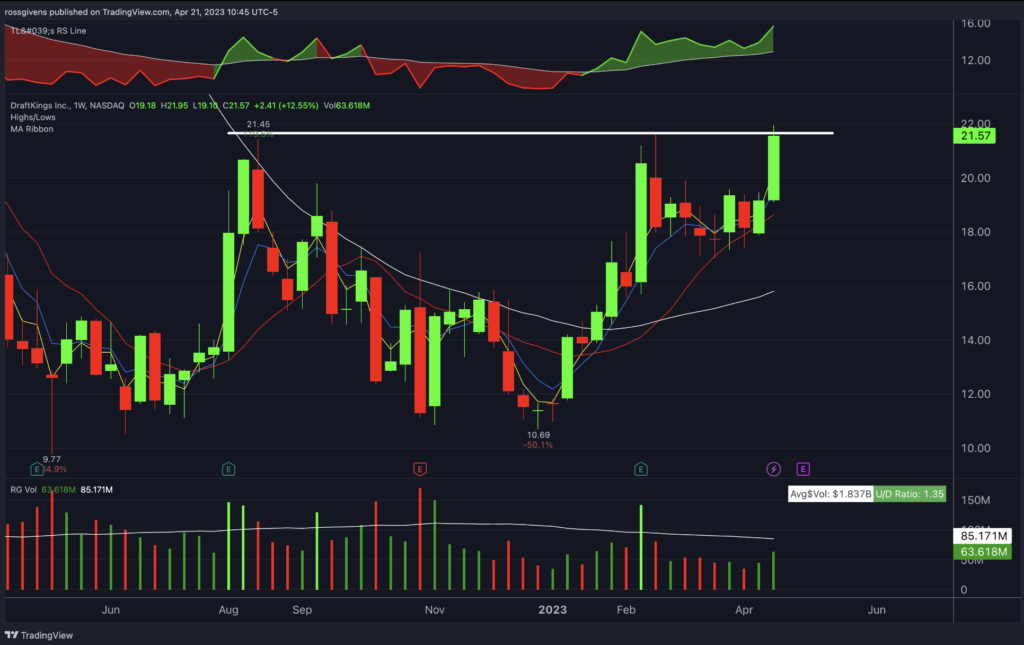
DraftKings is breaking out of a clean base in the beginning of a new Stage 2 uptrend.

The stock is up 13% this week but running into longer term resistance.

It is clear in the weekly chart below:

Ideally, DKNG would consolidate for a few days in the $21-$22 range to absorb any supply from sellers looking to exit near 52-week highs.

There are 2 places I would consider buying this stock…

First would be a breakout to new highs above $22 on above average volume. This would signal to me that funds are still buying heavy, and I would want to be along for the ride.

The other potential buy point would be a pullback into the moving averages and this week’s breakout area.

At $19-$20 a share, I would be a buyer in DKNG with a sell stop just beneath the 50-day moving average.

International Game Technology (IGT)

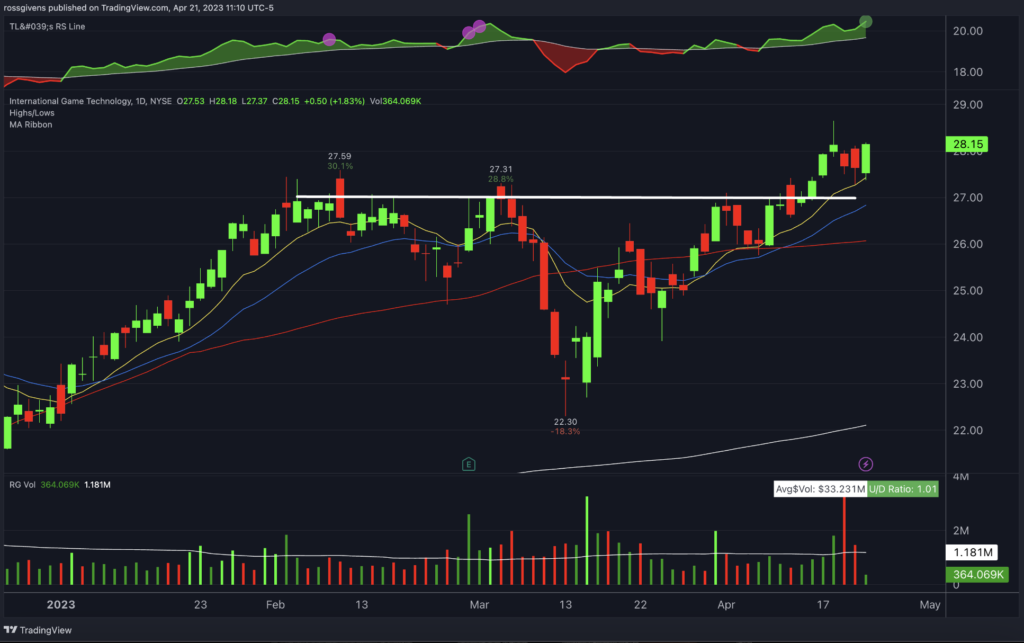
IGT just made new 52-week highs.

After a shakeout move in mid-March, the stock completed a textbook cup-with-handle pattern and broke out through resistance at $27.

The 200-day moving average has turned up, and all other key moving averages are trending higher and supporting the stock.

Depending on one’s risk tolerance, IGT could be bought here.

My stop would be at 25.75, just below the 50-day moving average and the recent swing low. That would equate to a risk of 8.4% on the trade.

If IGT pulls back to the $27 area, that would be a great place for a pullback buy or to add on to the position.

Studio City International (MSC)

Studio City is a Hong Kong-based resort and casino located in Macau.

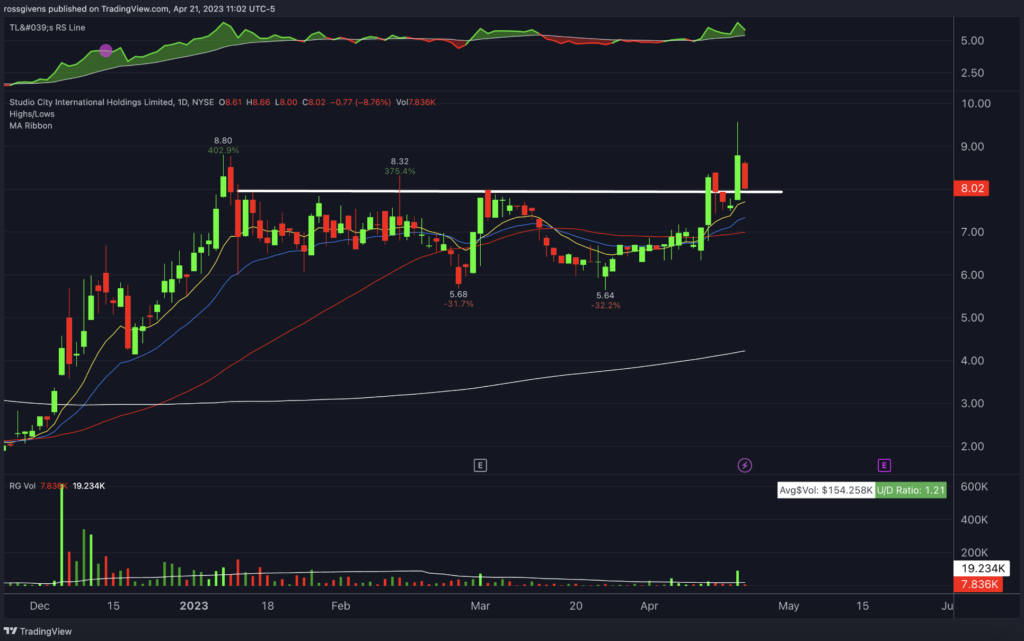
After finding support at the $2 area last year, the stock emerged from its slumber to advance in just two months.

It has been consolidating since January and now appears ready to go another leg higher.

This is a low-priced, thinly traded stock and as such, carries more risk. So, we want to be precise with our entry on this one.

Active traders might consider buying near $7 with a stop loss at 6.30.

Best wishes for your trading,
Ross Givens

Editor, Stealth Trades