Weekly Update: Stock Breakouts and Market Momentum
Good evening, and welcome to this week’s edition of Stealth Trades!
“A watched pot never boils.”
My mom used to say that. And it’s as true for cooking noodles as it is for trading stocks.
Last week we talked about how quiet the market was and our growing frustration with the sideways action we have experienced for the last several weeks.
And wouldn’t you know it, the S&P 500 just made a new high for the year.
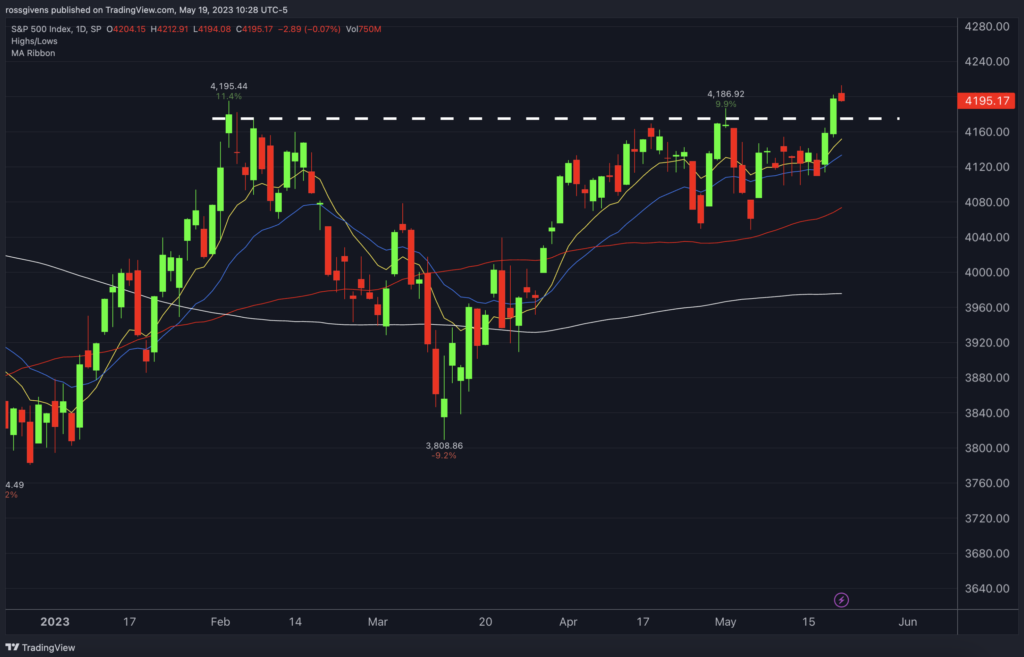
If you have been a member for a while, you should also see a textbook breakout pattern taking place in the index.
This is what we look for in individual stocks. When we get it paired with a broader market buy signal like this, I tend to get aggressive and take bigger trades.
Yesterday’s breakout higher pushed the index to 20% above the October lows, making this officially a bull market.
The Nasdaq has done even better – currently up 32% over the same period.
The indexes are, of course, market cap weighted. This means big stocks like Apple, Amazon and Google have far more influence on the numbers than small and medium-sized companies.
To confirm that the move is real, we want to be sure that the majority of stocks are participating in this rally.
Stocks in uptrends should, for the most part, remain above the 50-day. That’s my “line in the sand” that separates stocks going up from those going down.
So, I like to watch the percentage of stocks above their 50-day moving average.
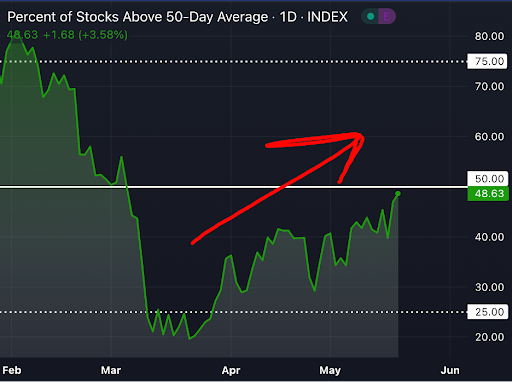
If you use TradingView, the ticker symbol for this reading is MMFI.
As you can see, we have progressed from having only 20% of stocks above to almost 50% over the last 8 weeks.
This is a good sign and confirms that mega-cap names are not masking weakness below the surface.
Notice how these stock breakouts lined up with the overall market:
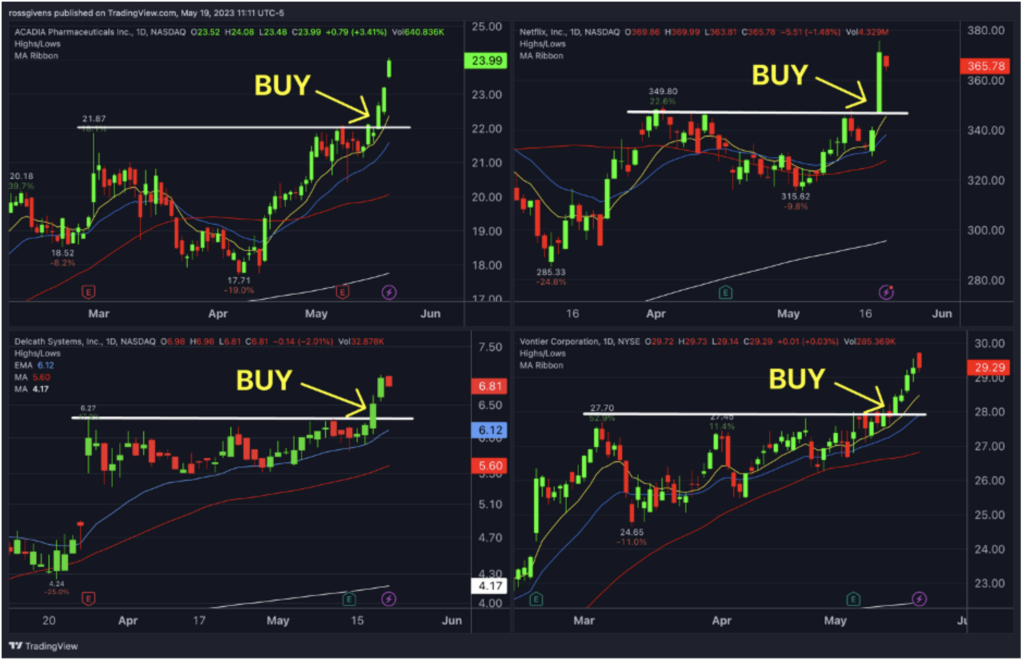
This is a powerful combination that can lead to huge returns.
I maintain an active watchlist of stocks at all times that look ripe for a move higher. Here are three I’ve got my eye on right now:
FirstService Corporation (FSV)
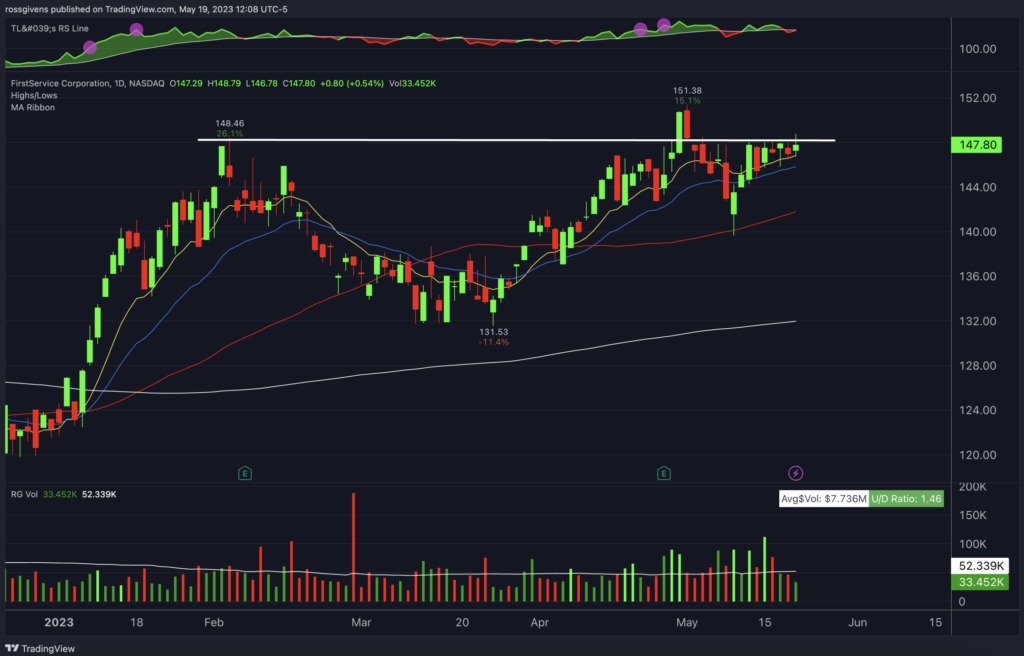
Charts don’t get much prettier than this.
After ripping through the 200-day moving average to make a new 52-week high, FSV pulled back and put in a series of shallowing retracements.
Resistance is clearly defined at the $148 level.
There was a failed breakout you can see at the end of April. But after a shakeout move to the 50-day moving average, shares rebounded quickly.
We have also seen nice buying volume over the last several weeks that has the fingerprints of institutional activity.
I took a position in this stock Friday morning. My stop loss is at $139.60, just beneath the swing low.
Pacific Biosciences of California (PACB)
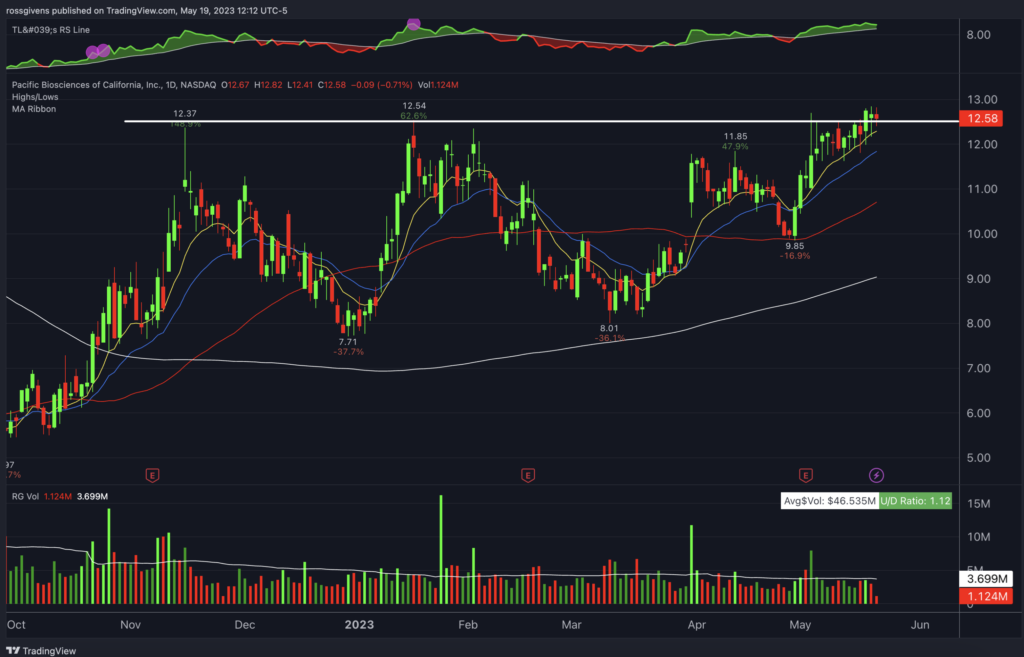
PACB is another great looking compression pattern forming below the $12.50 area.
Notice how the pullback area has gotten very tight and trading has been contained to a narrow range over the last three weeks. This is what I like to see.
The stock is trying to break out here, but it hasn’t mustered the strength just yet. I bought shares of this stock today as well with a stop at $11.60.
If it is going to run, it should not get below its 21-day moving average (blue line).
LionsGate Entertainment (LGF.A)
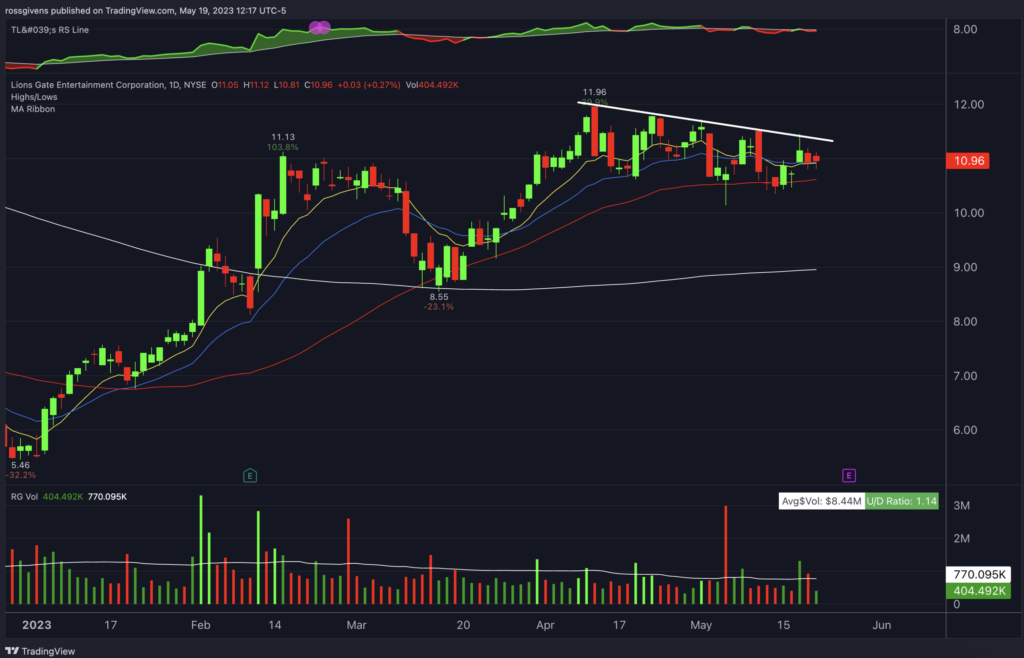
The LionsGate movie company looks very appealing here. The stock has already doubled this year, and it looks like it wants to run further.
This was a $20 stock two years ago, so there is plenty of upside still.
The 200-day moving average has turned up and is now trending higher. We also have our shorter-term 10, 21 and 50-day moving averages tightening up to provide support in what I call a “launchpad” setup.
If LGF.A breaks above the trendline I’ve drawn on the chart, I will consider buying. My stop loss would be at $10.30.
Best wishes for your trading,