Weekly Update: Potential Breakout Opportunities
Good evening, and welcome to this week’s edition of Stealth Trades!
The market has finally broken above the level that we can see it has reacted off of multiple times in the past year.
Everytime we traded near it and were below it, the market had a sell off that lasted a few weeks. Now that we are above it and have tested it multiple times we can look to see if it can replicate what it did on the downside to the top side.
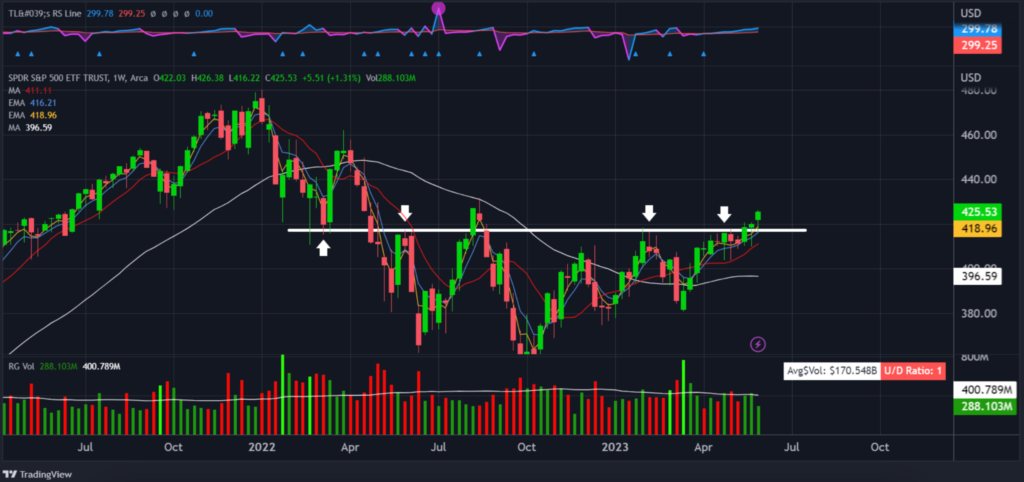
When in doubt, zoom out. Above we are looking at the weekly time frame because quite often we get caught aimlessly viewing the markets and aiming to force the market to show us what we want to see. Zooming out gives us an eagle eye view for us to base our analysis on.
Current prediction: The market closed above this resistance level 2 weeks ago. Last week the market traded below it as a test before ultimately trading and closing back above the resistance level. This week it seems we are closing strong above the level after we have tested it as support. If the market continues to rally then we should have a straight path to the 430 area as our next resistance zone.
Here are a few stocks I am watching right now:
Achieve Life Sciences, Inc. (ACHV)
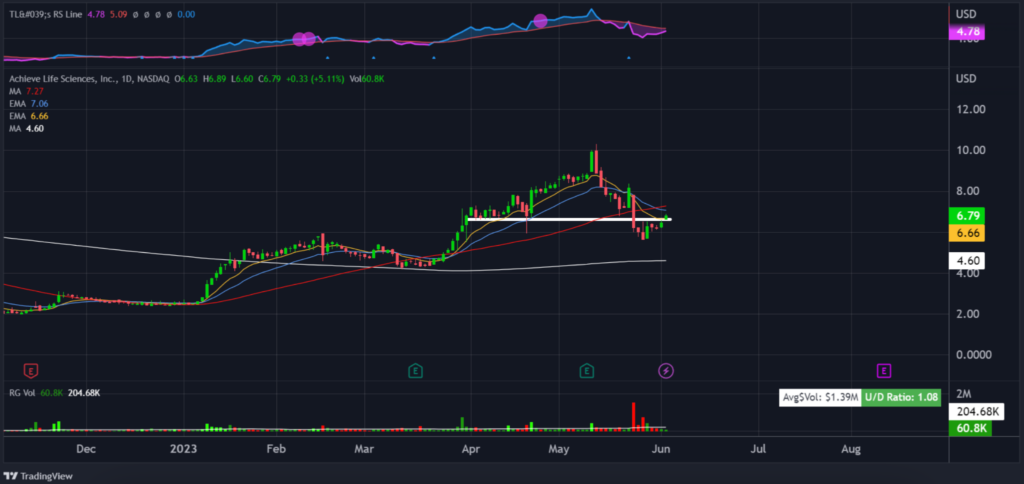
ACHV is a clinical-stage pharmaceutical company, which engages in the development and commercialization of cytisinicline for smoking cessation. Its products include cytisine, a plant-based alkaloid with a binding affinity to the nicotinic acetylcholine receptor.
The company has been in a steady downtrend however that does not mean there are no profit making opportunities. If you zoom out to the weekly chart then you can see that from this recent low that was created we have begun to make higher lows and higher highs.
A move trading back to the last higher high that was created would be roughly a 50% return.
So due to the stock showing signs of a reversal and continuation with higher highs and higher lows, I am watching it closely.
The price is trading right back above this support level that was tested for 18 days before price came back down and violated it. This is similar to the undercut and rally pattern we have seen where you have a low that is taken out in an uptrend and then the market begins to continue the trend higher after shaking out the weak handed traders.
I would personally want to see a closure at today’s highs that made me want to take an entry.
Kingsoft Cloud Holdings Limited. (KC)
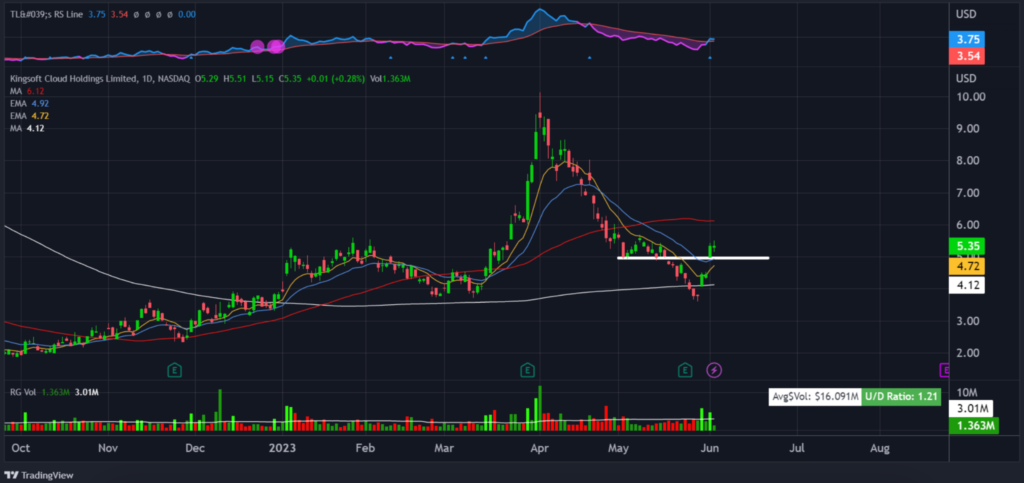
KC provides services such as cloud storage and cloud computation services. It is the web cloud service of China, so to speak.
The company has recently had a nice run in price where it was creating steady higher highs and lows after trading to the sub $2 lows. From those lows last September it ran 400+ percent.
Zooming out to the weekly chart as well, we can see that the initial sell off came all the way back down to the support level it made above the 200-day moving average before it held and started to rally higher.
Price is now trading back above the last support area it created in the sell off after rallying and gapping up so aggressively. I am not a fan of the gap with no retracements so because of that I am wanting a retest of this level as we saw so many times before it ultimately sold off.
I am writing this Friday afternoon, and if we can get a retest of the $5 area and then ultimately hold then this can be a nice runner to hold back to those highs and ultimately higher prices.
Aarons Holding Company, Inc. (AAN)
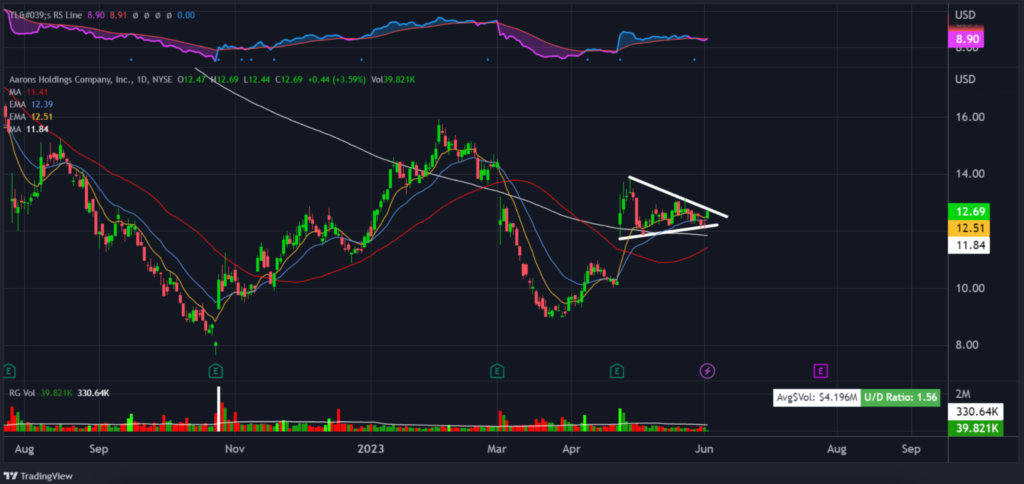
AAN is tightening in this wedge formation after making a higher low and holding above our long term 200-day moving average. Our last rally higher and move above the 200-day moving average failed to hold, however the move lower failed to continue to break the previous low and instead created a higher low that has brought us back above price.
Price made a move higher up roughly 55% before trading lower and tightening in this wedge formation. A break and closure above should be the signal needed to target the previous high, and then the failure from February and then higher prices from there.
This is a sign of sellers and buyers being exhausted because price is refusing to sell off lower and price is range-bound otherwise known as equilibrium. The fact is, however, that this is occurring above the 200-day moving average and the other moving averages are being held and respected. This tells me that there is further upside to go.
I would be interested in a break and closure above $13.00.
Best wishes for your trading,