Weekly Update: I Hate to Say I Told You So…
Good evening, and welcome to this week’s edition of Stealth Trades!
I hate to say I told you so. Buuuuuuut…..
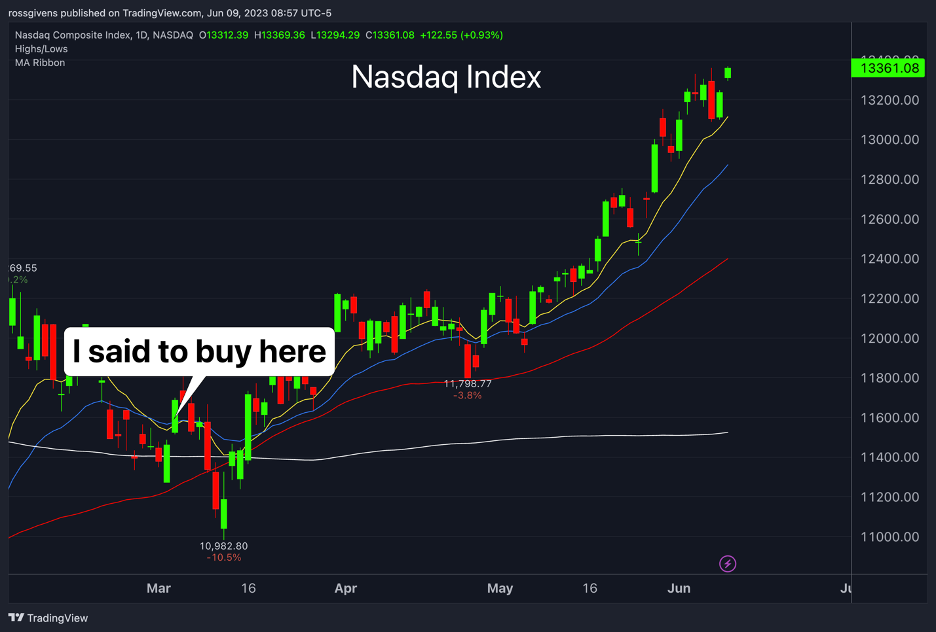
I have been pounding the table since March that this is a new bull market.
Week after week my message has been the same…
BUY. The bear market is over.
On March 3rd, in my Weekly Update email (which you are reading right now), I brought to your attention a bullish signal known as an “upside reversal.”
Here is a screenshot from that email:

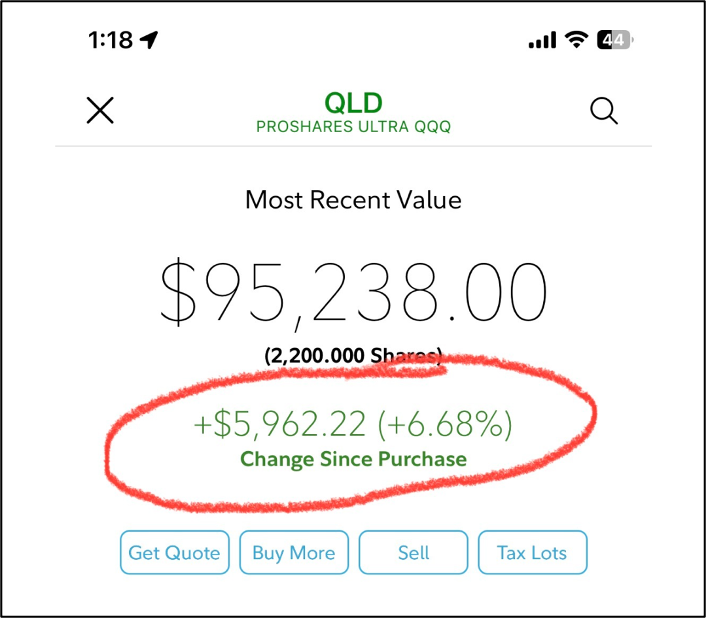
I even showed you the trade I took:
The upside reversal is one of my favorite buy signals.
Typically, I’m not a fan of buying stocks when they are at the lows. This setup is the exception.
The upside reversal works great on the indexes. It works even better on individual stocks.
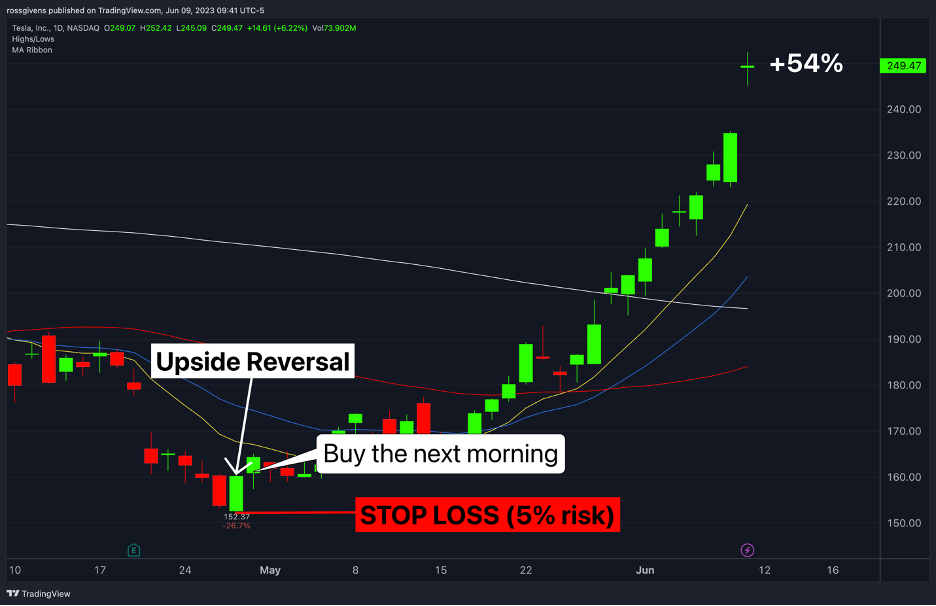
Here’s one that formed in TSLA back in April:

If you like buying low when stocks are “on sale” you need to know this strategy.
It is a way to buy right as a stock is reversing and, more importantly, a way to do it with limited risk.
Here are the rules…
On a daily chart (each candle is 1 day) the stock needs to make a new low. It doesn’t have to be a new 52-week low, but you want to see a downtrend of at least 6-8 weeks and the stock to trade below the low of that period.
Next, and this is the important part, the stock must rally back up and close the day in the green.
In other words, it made a new 2-month low in the morning, and then finished the day above the previous day’s close.
Here is a closer look at the TSLA example I mentioned earlier:
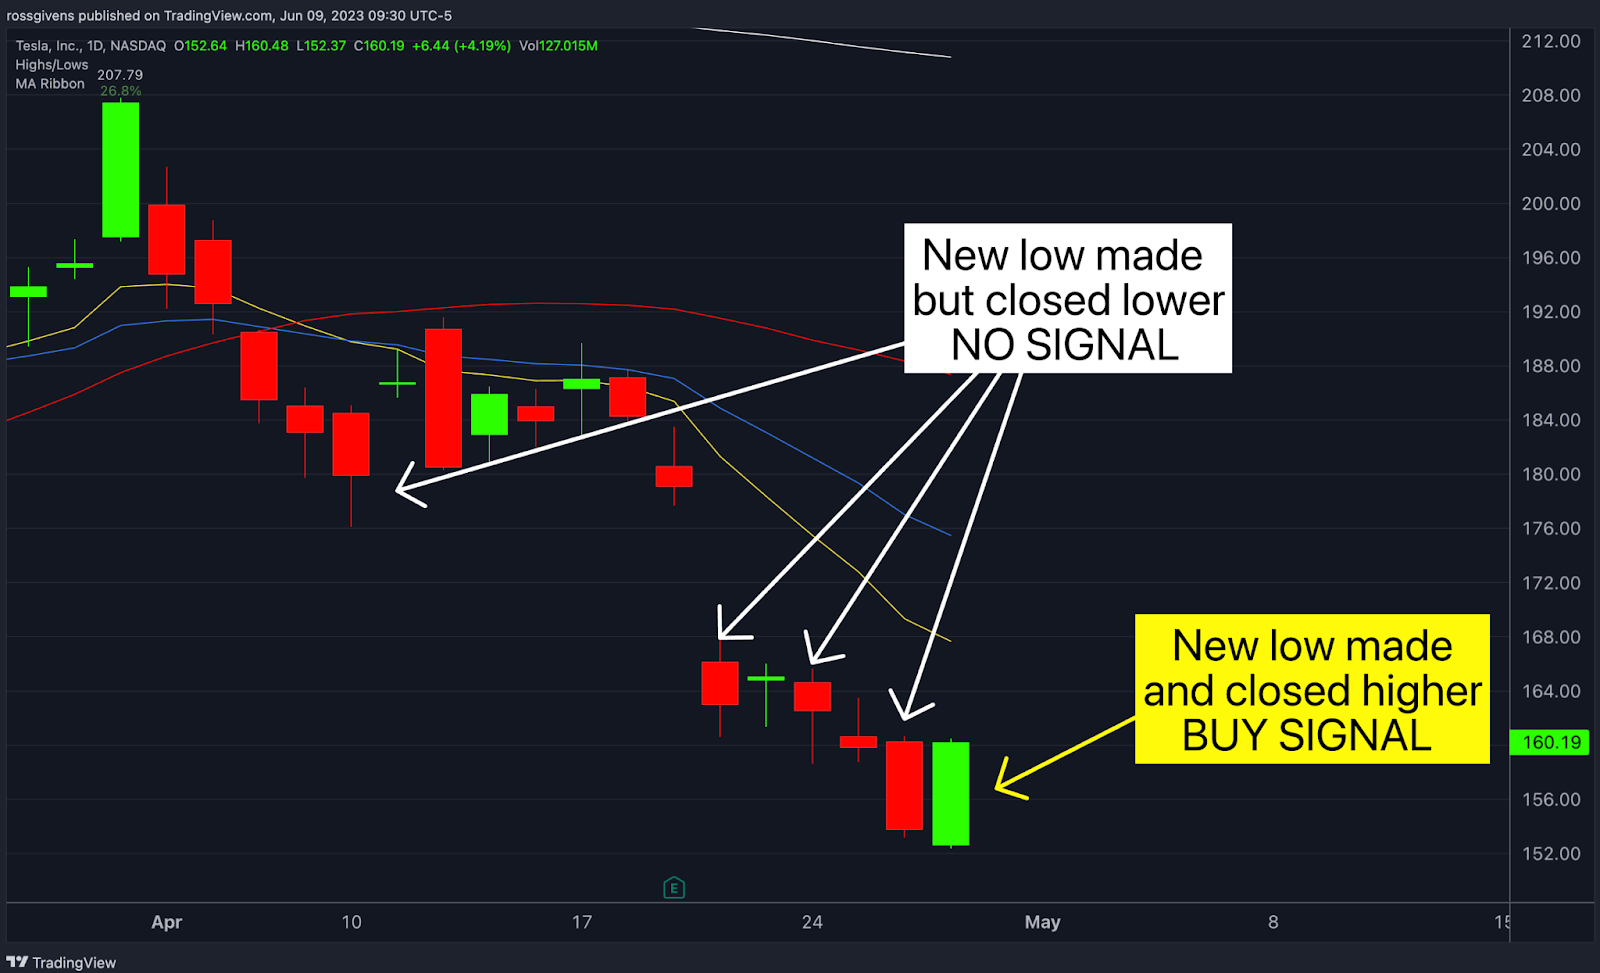
Notice how the first few times it made a new low it closed the day in the red – below the previous day’s close.
Then, in the last candle, TSLA made a new low but surged higher to finish the day up 4%.
That is a valid upside reversal buy signal.
The execution is simple…
Buy the stock the next morning.
Set a stop loss a few cents beneath the low of the previous day (see image below).
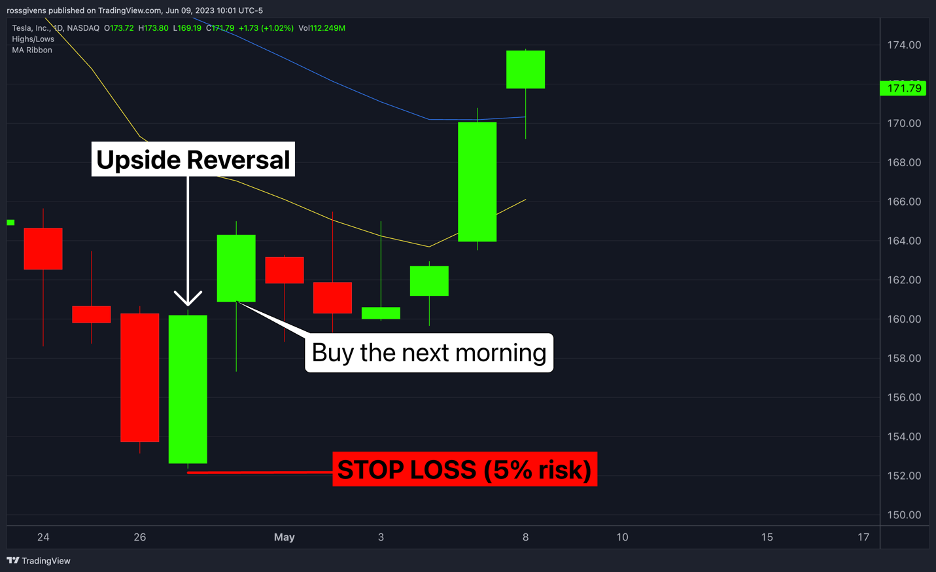
The risk is usually less than 10% on the trade.
It was only 5% for TSLA.
The upside was substantially higher…
It’s not going to work every time.
Nothing does.
But it is a low risk/high reward setup.
And you’re going to look pretty smart when you buy the next TSLA right off the lows like a freaking market wizard.
I ran a scan today to see if I could find any to take on Monday, but there were no setups.
Here are three other trade ideas I like though…
On Holding (ONON)
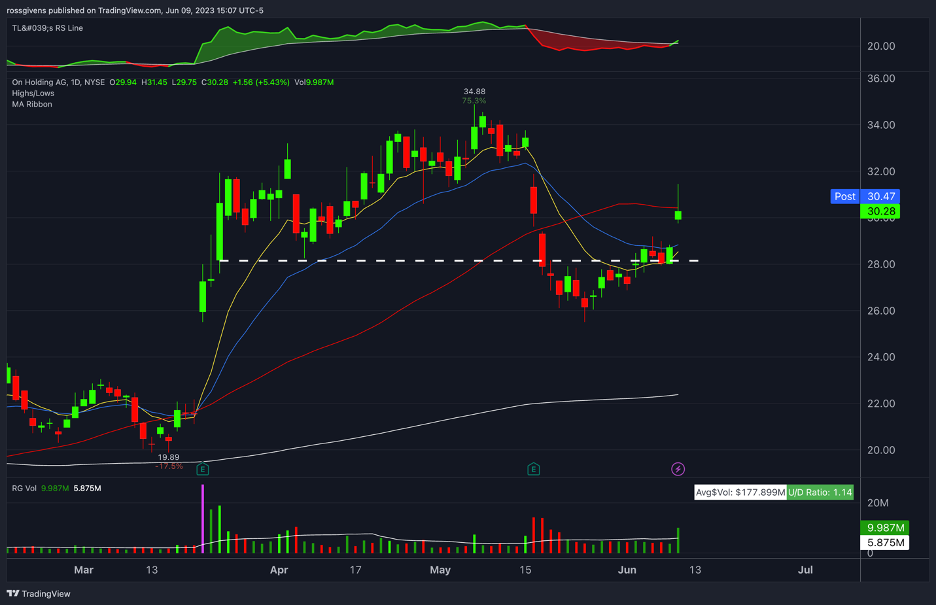
UBS analysts doubled down on its bullish view on the stock today. They have a buy rating on ONON and a price target of $42. Shares are up 5% today on the news.
This stock has been a favorite of mine for several months. It went public in late 2021. It performed great initially. But the 2022 bear market gave it a beating.
ONON has more than doubled off its 2022 lows and the company is growing sales at an astounding 80% quarterly rate.
Shares dipped below the 50-day moving average (red line on chart) in May and did an “undercut & rally.” This is where a stock will breach a previous support area triggering thousands of stop losses and taking investors out. Institutions often buy here and drive the price back above support (dashed line on chart) to continue the move higher.
Investors may consider buying here with a 10% stop loss near 27.25.
Hims & Hers Health (HIMS)
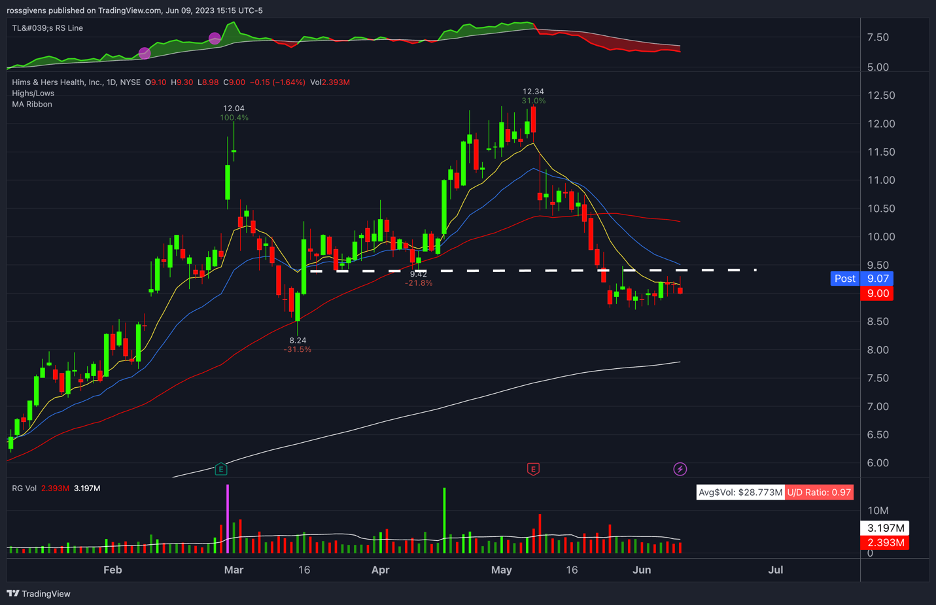
HIMS is another high growth name. Sales have nearly doubled in each of the last four quarters and losses are steadily declining.
Much like ONON, HIMS stock got overcooked after rising 195% between October and May, triggering a 30% retracement.
This stock also has an “undercut & rally” setup forming. Note the dashed line on the chart above. This was a significant area of resistance previously, so the move below this level last month likely took out a lot of investors.
Shares have consolidated in a tight range on low volume for the last two weeks. This is likely support buying as longer-term investors build or add to their positions.
I want to see a move above the support/resistance line at 9.50. A move above that price would be my buy trigger. My stop loss would be at 8.70 to risk 8% on the trade.
Krispy Kreme (DNUT)
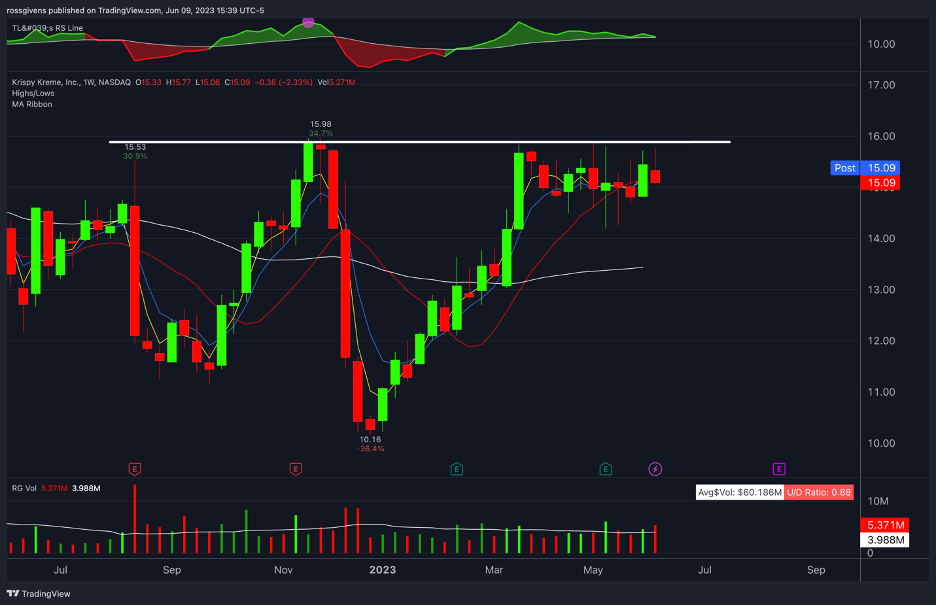
Who makes the best donuts on Earth? Don’t you dare say Dunkin’. Krispy Kreme is king, and I won’t hear anything to the contrary.
Regardless of who makes your favorite cream-filled pastry, take a look at the weekly chart of DNUT above.
This setup is fairly straightforward. The stock has not been able to breach the $16 level despite several attempts over the last six months. A close above $16, especially on above average volume, would be my trigger to buy.
DNUT is beginning a new Stage 2 uptrend here, and buying the first breakout of the second stage can often lead to a multi-month run. As a longer-term trade, I would consider risking up to 15% on it.
If it plays out as expected, DNUT should make new all-time highs.
Best wishes for your trading,