Good evening, and welcome to this week’s edition of Stealth Trades!
Anyone who reads my research knows my approach – identify the theme of the market and maintain a laser focus on the best stocks in those top-performing groups or sectors.
The 2023 bull market has been powered by the artificial intelligence theme. Super Micro Computer, Palantir, Nvidia, and other big-name AI stocks have been the key driver of gains this year.
When looking at the performance of various sectors this year, this AI theme is crystal clear.
Semiconductors, crypto and software have smoked pretty much everything else since January.
Energy, biotech, banks and solar, on the other hand, have been among the worst performers.
But some of these trends are beginning to shift.
Take crypto, for example – the hot pink line on the chart above. Although prices rose hard in the first few months of the year, they have been declining steadily since June.
The chart below zooms in a little closer to examine performance over just the last 30 days.
Now we see this more clearly.
The solar space continues to be an absolute dog, but crypto stocks have joined the party at the back of the bus. Semiconductors have also pulled back a few percent although not much.
Energy, on the other hand, is beginning to emerge and show short-term strength. We bought Tidewater (TDW), an oil and gas transport stock, in my Alpha Stocks service a few weeks ago and it is now making new all-time highs.
The clear winner, however, is software. Not only is this the best-performing group year-to-date, but it has continued to outperform all other areas of the market even during this short-term correction.
The message is clear… software is king.
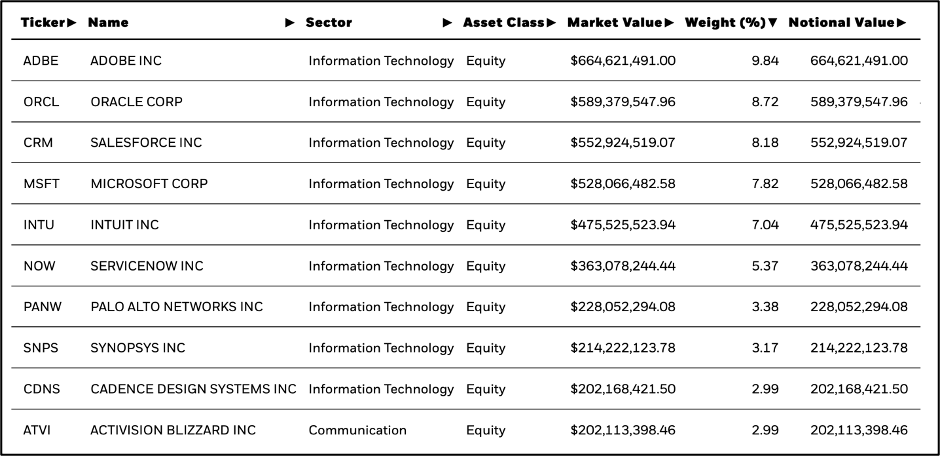
The exchange traded fund I watch to track the sector is IGV- iShares Expanded Tech-Software ETF. Its top 10 holdings are below.
Every one of these stocks is within spitting distance of its highs.
Faced with this mountain of evidence, I don’t see a reason to focus anywhere else. If our goal is outperformance, we need to focus on our bucket. And right now, that bucket is software stocks.
With that in mind, here are few of my favorites right now:
Vmware (VMW)
This is a weekly chart. And as you can see, VWM has not been able to clear the $170 level for the last four years. That is significant resistance.
A move through this area could finally trigger the next wave higher for the stock.
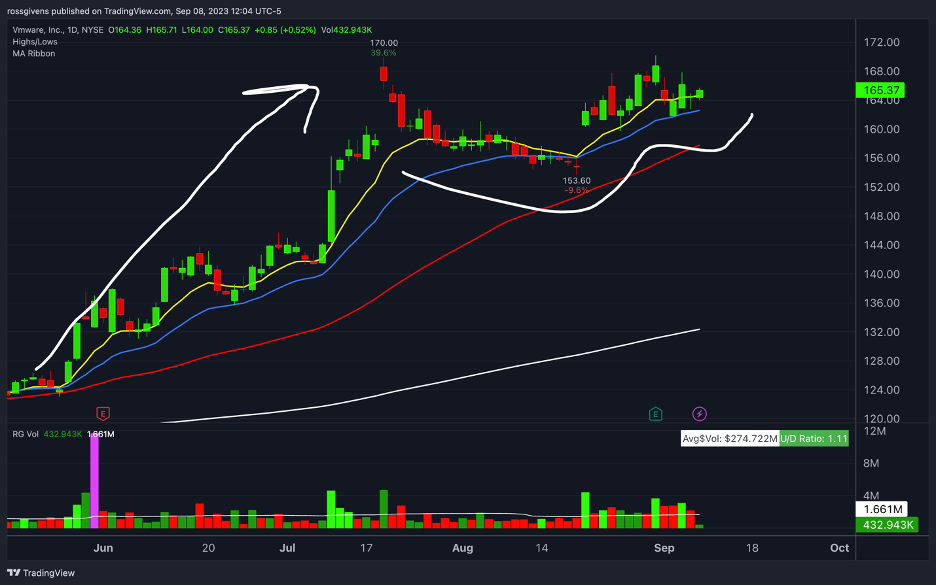
The daily chart below shows the most recent price action.
After a powerful move higher, shares have consolidated for the last few weeks in a compressing pattern above the 21-day EMA. This is very constructive action.
As long as VMW holds above its 50-day moving average (red line on chart) I would be bullish on this stock.
Kyndryl Holdings (KD)
KD is another stock pushing up against a big resistance level.
The enterprise software company went public in late 2021 just in time to get murdered by last year’s bear market. But KD is now trying to break out.
After carving out a bottom and putting in a textbook Stage 1 base, the stock is poised to begin its first Stage 2 uptrend. Historically, this is where the largest gains are made in newer stocks.
If KD can get above the 17.25 level and do so on above-average volume, I would absolutely consider taking a position in this stock.
Cardlytics (CDLX)
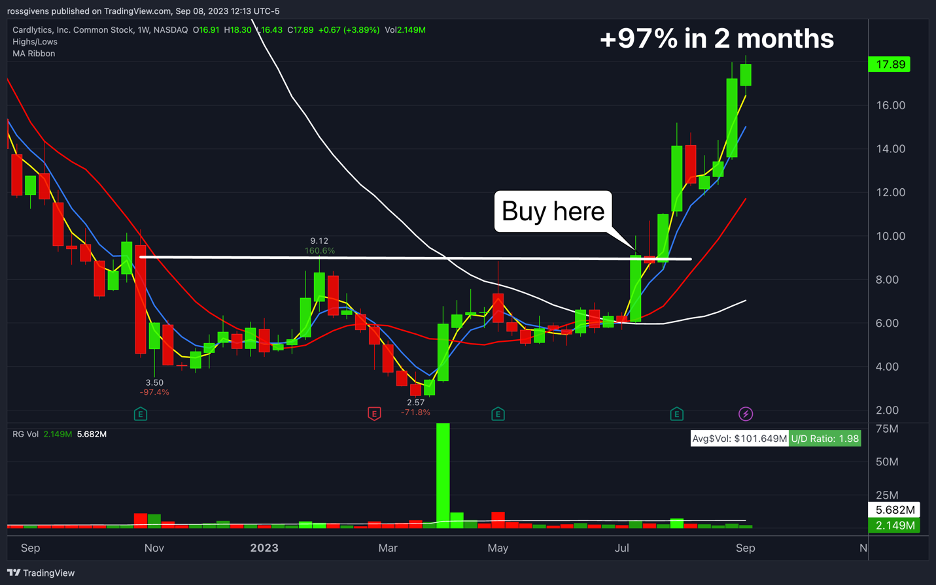
To give you an idea of what I am hoping to see from KD above, this is what it should look like.
The stock carves out a bottom over a period of 6-12 months, breaks through resistance (white horizontal line on chart) on high volume, and then doubles in short order.
CDLX is now trending nicely.
Dips to the lower side of the channel or pullback near the 21-day moving average are all buyable as long as momentum continues. I would use a stop loss to risk no more than 10-15%.
Good evening, and welcome to this week’s edition of Stealth Trades!
What a week. After several weeks of selling and pullbacks in just about every leading stock, the Nasdaq rallied this week to gain 3.5%.
The stock market has an uncanny ability to embarrass the greatest number of people. When everyone thinks prices are going higher, they collapse. The public is finally bearish? Stocks start to rise.
Trying to predict where the market will go week to week can be one of the most frustrating endeavors a person can undertake.
Last week, after the selloff in NVDA stock following a blowout earnings report and an accompanying decline in the Nasdaq, I was nearly certain the market would fall further this week.
It did not. I was wrong. And, unfortunately, that is part of the game.
Trading is a game of probabilities. You are going to pick losing stocks. There will be weeks when you are not in tune with the market. The trick is to be right more than you are wrong, and to make more than you lose.
There are two statistics every trader should be tracking – win rate and win/loss ratio.
Let’s start with the win rate…
This one is pretty simple. What percentage of the time are you right? Or what percent of your trades are winners versus losers?
If you made money on 6 trades and lost money on 4, your win rate would be 60% (6 out of 10 trades were profitable).
Most people focus on this stat exclusively. I get asked in webinars all the time, “what is the percentage of your winners to losers?”
But that is only half the equation.
I’ve seen traders with win rates over 80% that still lose money. There are charlatans in my line of work who tout huge win rates and claim to have “96% winning trades.”
Here’s the part they don’t tell you…
The other 4%? That tiny number of losing trades? They wipe out all the gains.
Why? Their win/loss ratio is horrible.
The win/loss ratio represents your edge. It is the ratio of your average profit against your average loss.
If your winning trades have an average profit of 12% and your losers average only -4%, your win/loss ratio is 3:1. In other words, you make three times as much money when you are right as you lose when you are wrong.
This is extremely important. Because your win/loss ratio dictates how often you need to win.
In the above example, a 3:1 win/loss ratio means you only need to be right 25% of the time. Every win offsets three losses, so as long as you can get 1 out of 4 right, you are not losing money. Any better than that, and your account balance is growing.
On the other hand, let’s pretend those numbers were reversed. Let’s say you have a bad habit of selling too quickly when things are going in your favor and holding too long when they are not.
If your average profit is 4% but your average loss is -12%, your win loss ratio would be 1:3. Now the equation has flipped. Since one losing trade wipes out three winning ones, you need to be right 75% of the time.
That’s harder to do.
Paul Tudor Jones is one of the greatest traders to ever live. His goal was a win/loss ratio of 5:1. He looked for opportunities where he could risk a dollar to make five.
Jones knows the power of a good win/loss ratio better than I ever will. That is his edge. He admits to losing far more often than he wins. Yet he still amassed a $7.5 billion fortune.
Below is one of my favorite Paul Tudor Jones quotes:
“The best profit-maximizing strategy is to own the fastest horse.”
I’m not Warren Buffett. I’m not looking for blue chips I can hold for two decades. I want to see my money grow quickly. So, I focus on the best-performing sectors and the fastest rising stocks within that sector.
I keep a watchlist of 62 sector ETFs. ITB represents home building stocks. IBB tracks biotechnology. There are others for basic materials, semiconductors, etc.
I flip through these charts every week to see what areas are showing the most strength. You can also sort them by 1-month relative strength score in platforms like Deepvue which I am playing with now.
Below is a screenshot of the top 5 groups today.
Uranium, cybersecurity, oil & gas, biotechnology, and software stocks are currently the best performers. So, I want to focus on the best stocks in those groups.
This simple process reduces 6,000+ publicly traded stocks down to a watchlist of 20-30. And that is where I focus.
Are they all guaranteed to go up? Of course not. But an object in motion tends to stay in motion. And stocks that are going up tend to keep going up.
So, once again, you are putting the odds in your favor.
The Global X Uranium ETF (URA) currently holds 43 stocks. Yet 24% of its assets are in one stock – Cameco Corp (CCJ).
I can see why…
This is a beautiful trending stock ripping to new highs. I like it.
The second-best sector over the last 30-days has been cybersecurity. A quick glance at the ten largest cybersecurity stocks (and one of IHAK’s top holdings) uncovered Vmware (VMW).
VMW is completing a 2-year cup and handle pattern that looks poised to breakout higher.
Heavy buying volume, support at the 50-day moving average, and high relative strength are all the things I look for in a fast-moving stock.
In a nutshell, this is my process. Focus on strength and buy the best. Stack the odds in your favor with as many variables as possible.
Trading is hard enough. Don’t make it any more complicated than it needs to be. Focus on the leading stocks in leading groups. You are almost guaranteed to be in some of the best performers.
Good evening, and welcome to this week’s edition of Stealth Trades!
As I write this on Friday morning, I am listening to Federal Reserve Chairman Jerome Powell speak at the annual symposium in Jackson Hole, Wyoming.
As usual, he has nothing useful to say. And investors do not like what is coming out of his mouth.
By now you know my opinion on this clown. Not only has he been wrong about everything since the pandemic began, but he also both caused record inflation with excessive money printing and then overcorrected to fix his mistake by raising interest rates at the fastest pace in history.
How this man still has a job I will never understand. But this is the hand the American economy was dealt.
To summarize his recent comments, Powell has taken an aggressive stance going forward. Most investors thought the Fed would begin lowering rates as early as next month. But if Powell is to be taken at his word, that is unlikely to occur.
The Federal Reserve plans to keep rates high for longer than initially expected to be sure inflationary pressures have been quelled.
So, for the time being at least… rates aren’t coming down.
As someone about to build a house, this is less than ideal. But that is their goal. They want to slow demand for goods and services in order to bring prices down – or at least stop them from going up more.
Macroeconomic issues aside, what matters is the stock market. How are stock prices reacting and where do we go from here?
For the last couple weeks, I have been advising readers to take caution. Not only has the market been pulling back, but many of the leading names that were driving this stock market rally have rolled over and lost momentum.
Yesterday, I sent a memo to the staff here at Traders Agency outlining my views. I would like to share that with you as well…
My View on the Market
2023 has been an incredibly strong year for stocks. The Nasdaq rallied 38% in the first six months for one of the best starts to a year in history.
This rally has been primarily led by an AI/tech theme that has been responsible for the bulk of these gains. That part of the rally is likely over, however… at least for now.
Every bull market has a “theme” with leading stocks that set the pace. In the late 90s that was the dot-com bubble. In the 2009-2020 bull market that was big tech like Facebook, Amazon, Netflix, Apple and Google (hence the FAANG stocks moniker). The 2020-2021 bull market was led by “work-from-home” stocks like Zoom, Teladoc and Peloton.
The 2023 bull market has been led by artificial intelligence. The leading stocks have been Meta, Microsoft, Dynatrace, MongoDB, Palantir, AMD, and the biggest leader of them all, Nvidia.
Over the last 4-6 weeks we have witnessed many of these leading names roll over and retrace beneath their 50-day moving average – a key level that generally supports top stocks through the move higher.
Despite the recent pullback in the market, Nvidia has held at its highs.
Wednesday after the close, Nvidia reported earnings. And the results were better than anyone could have expected.
Earnings of $2.70 per share versus estimates of $2.08. Sales were $13.5 billion – 20% above expectations. And the company raised forward guidance (how much they expect to bring in next quarter) from $12 billion to $16 billion.
They also announced a $25 billion share buyback which should act to propel the stock price even further. Investors got everything they wanted and then some. NVDA stock shot up 10% after hours. The news was so good, the entire Nasdaq index shot up 1% on the news.
But Thursday, in the first few hours of trading, all of those gains were gone. The Nasdaq opened higher, and immediately began selling off. It fell 3% during the session. And NVDA was back where it closed the day before.
This, to me, is a clear signal that the 2023 rally in tech stocks is over. The high was likely made on July 19th, and I doubt we will see that level again this year.
In a bear market, like we had in 2022, what you want to see is the market going UP on BAD news. This is the sign that the low is in, and buyers are coming back in.
We saw this on October 13, 2022. After a government inflation report revealed the worst numbers yet – far worse than expectations – the market gapped down and opened a full 3% lower than it was the day before. However, stocks immediately began to rally, and the index surged 5% that day. This was the signal that the low was in.
On the other hand, in a bull market, we want to watch for times when the market goes DOWN on GOOD news. This often signals a top. And I believe we saw that on Thursday.
Nvidia was the only stock that could have reversed this pullback. The earnings report was better than even the most optimistic investor had hoped. This should have absolutely put an end to the pullback and caused the market to rally higher. Instead, we saw the opposite.
So, what does this mean?
First of all, and let me be clear on this, I am NOT saying the market is about to crash. I simply believe the “easy money” stage is over.
I expect to see fairly choppy conditions for the next few weeks or months, and investors can no longer rely on the bull market to push everything higher.
I believe tech stocks have seen their highs for 2023. Those with large open gains in stocks like Meta, Amazon, Apple, Google, Nvidia and the like may consider selling to lock in those gains here.
There will still be stocks that go up, some of them by substantial amounts. I issued a new buy recommendation on Precigen (PGEN) to my Insider Effect members this morning and the stock is up 12% already. But I believe this is now a more selective stock picker’s market.
I sold the index funds in my long-term account and moved to cash. As of yesterday, those funds were up 37% year-to-date. That is a phenomenal year, and I do not want to risk giving those gains back.
To me, this is a low-risk decision. The worst-case scenario is that I am wrong or something material changes that propels stocks higher.
If this happens, and the Nasdaq makes new highs this year, I will simply buy those funds back. All I will have missed is a 6% move.
My goal with this weekly update is not to instill fear. In fact, just the opposite. I want to do everything in my power to help you grow and protect your wealth. And I would be doing you a disservice not to share this information with you.
I am not a financial advisor. I was for many years, but I let those licenses expire to do this… to help everyday people become more profitable and knowledgeable investors. This is not official financial advice. I am simply telling you what I see and the actions I am taking to protect my money.
Here are a few trade ideas I am watching for the coming week. It won’t surprise you they are all short trades in the tech sector.
Apple (AAPL)
Apple has been a top performer all year. The uptrend has been a thing of beauty – steadily marching higher since January.
But that ride is over. The stock fell 10% in a week and still failed to attract buyers. It finally broke down last week before reversing higher.
But that rally failed. And AAPL is again breaking through short-term support.
Traders may consider selling short AAPL stock here in a bet that it will go lower still. This is a very low-risk trade since you could place a buy stop at $182 and risk less than 3% on the trade.
Given the high price of the stock, it may be easier to simply buy a put option, like the AAPL $175 put that expires on October 20.
Upstart (UPST)
Talk about a fall from grace…
After rallying 460% from May to August, the high-tech automotive finance company fell 57% in a week!
The stock was murdered.
Yet, even at half off, investors are not enticed to buy. UPST cannot rally – a clear sign that institutions have no interest in the stock.
This is Stage 3 action, and I would be shocked if the stock did not continue lower in a prolonged Stage 4 decline.
Nvidia (NVDA)
A few weeks ago, I could not have imagined shorting NVDA. It has been the #1 stock in the market all year.
But, for the reasons I outlined above, I think the party is over. If this stock cannot go up following one of the best mega-cap earnings reports I have ever seen, I don’t know what would do it.
As the saying goes, “When the whore house gets raided, even the piano player goes to jail.”
NVDA will be the last to roll over. But I expect to see it break down over the coming weeks. Traders may consider shorting the stock or buying a put option to profit from this move.
If NVDA defies the odds and gets above $500, abandon the trade.
Good evening, and welcome to this week’s edition of Stealth Trades!
The market continued its sell-off this week. The major indexes fell roughly 3% on steady selling over the last four days.
I commented last week that “leadership was failing.” The big-cap names that had been leading this rally were rolling over one-by-one. Apple (AAPL), Nvidia (NVDA), Super Micro (SMCI), MongoDB (MDB), Broadcom (AVGO) and several others had breached their 50-day moving averages and failed to bounce.
This week, the graveyard got bigger. Micron Technology (MU), Palantir (PLTR), On Holdings (ONON) and even Bitcoin joined the ranks of broken leaders.
Even Alphabet (GOOG), which has arguably been the strongest name during this pullback, is beginning to give up ground and break the low of its base.
None of this is reassuring. What started as a shallow retracement is quickly becoming a full-blown failure in growth stocks.
The culprit? Take your pick.
Some say the rise in 10-year bond yields is to blame. Others are pointing their finger at China and the real estate bubble bursting over there.
I even read an article this morning saying the sell-off to excess trading activity in zero-day-to-expiration stock options (commonly referred to as 0DTE options) was forcing market makers to rapidly sell equities in order to remain market neutral and hedge their bets.
At the end of the day, it doesn’t really matter why stocks are falling. All that matters is they are.
The stock market is always in one of three states – an uptrend, a downtrend, or range bound chop.
Below is a weekly chart of the Nasdaq for the last three years highlighting the fluctuations between uptrends, downtrends, and sideways action.
As you can see, there were a few periods of beautiful trending action. I call these “power trends” and this is where the most money is made.
Market conditions will not be good at all times. In fact, most studies I’ve seen estimate that stocks only trend roughly 30% of the time.
Our job, therefore, is to identify these trends as soon as possible and press firmly on the gas.
We did that in May and June. And the results were phenomenal. We bought stocks like NKLA which went up 87% in 2 days, COIN which soared 46% in 7 days, HIVE climbed 51% in 15 days, NIO surged 44% in 23 days, and at least half a dozen other blockbuster wins.
All of these trades took place in that last green box on the chart.
That uptrend, however, is over. At least for right now. I expect to see another start within the next 4-6 weeks. Until then, we want to protect our hard-earned gains.
There are a few things I watch as clues that a new rally is about to begin. One of them is the Net New Highs/Lows.
The indicator in the middle of the chart below takes the net new highs (how many stocks made new highs that day) and subtracts the number of stocks that made new lows. If that number is positive, it paints a green bar. Red bars mean the opposite.
In almost every good trend, the market has more stocks that will be making new highs than new lows on balance. This also tells me there is broad participation underneath the surface.
As you can see, the indicator began painting green in mid-May, right as the new uptrend was getting underway.
For the last 11 trading days, however, we have seen more net lows. When the market bottoms here and finds its footing, we should see that trend reverse.
Another thing I like to watch is the Put/Call Ratio. In TradingView, you can plot this on a chart using the ticker symbol “PC.”
Most option traders lose money. They get bullish and buy calls when the market is at its highs, and they usually buy puts right as the market is bottoming.
This is known as a contra-indicator. If everyone thinks the market is heading lower, it’s probably about to rally.
I look for a reading of 1.20 or better during short-term pullbacks as a sign we could be at the low. And a reading of 1.40 or higher is a screaming buy signal for me.
Notice the huge spike at the end of 2022. This is one of the key indicators that had me shouting from the rooftops that this was a new bull market.
Long-term, I am still bullish. Based on what I am seeing, I expect this to be nothing more than a bull market retracement.
Once buyers step in, there will likely be a choppy tug-of-war in the markets for 4-6 weeks followed by a new rally as the bull market resumes its trajectory.
Until then, I encourage traders to be cautious. Trade small, if at all, until you start seeing progress in your trades.
Given the uncertain environment, I will refrain from giving specific trade ideas like I usually do in these weekly updates. But I will tell you where I am seeing strength right now, and a few stocks to keep an eye on as the market finds its footing.
The areas holding up the best are construction and energy.
For construction, this includes home builders like Dream Finders Homes (DFH), Toll Brothers (TOL) and M/I Homes (MHO) as well as manufacturers of building products like Simpson (SSD) and Apogee (AGOP). If these continue to hold up throughout this pullback, look for them to make new highs as soon as the market begins turning back up.
In the energy sector, particularly the offshore space, I like Tidewater (TDW), Archrock (AROC), and DHT Holdings (DHT).
I suggest keeping these stocks on your watchlist as potential new buys.
Good evening, and welcome to this week’s edition of Stealth Trades!
The indices were on a tremendous uptrend and they have paused right at the resistance in February and March of 2022.
Investors have become spooked and we saw a sell off in the varying sectors this week, especially in what was leading this bull market trend: AI and crypto stocks.
The question is what to do now.
So far today we have seen some of the losses created by the gap down on Wednesday get shrugged off. Now, some of the stocks regained some of the ground lost, however it is also earnings season so that is something to be mindful of.
We saw various stocks gap down on earnings even when it was a beat on earnings. This occurred more than likely because the rise before earnings was the market predetermining that the earnings would be a beat, so the rally before the news and then the drop.
Now we can dive into this week’s POSSIBLE trade ideas.
Adtalem Global Education Inc. (ATGE)
ATGE has finally broken out of this range that it was stuck in since November of last year.
ATGE is a education program that offers a variety of segments for individuals seeking education in healthcare, counseling, and more. With over 100 online certificates, this is the perfect program for those interested in an online education seeking opportunity.
Price was stuck between the $35-$44 mark. With each tap to resistance it would fall and each drop to support it would rise. Now, as most seasoned investors would know, nothing ranges forever and trying to trade within the range is like playing blackjack.
The bad news here is that earning are scheduled to be released on August 10, 2023 so we’ll have to wait another week to see what plays out. However, depending on what happens, this could set up to rally to all time highs from a few years ago.
So the game plan is we need to wait this one out and see. It has the volume and the market cap behind us and it has broken out and is trending above our short and medium term moving averages.
When earnings are released, if price can remain within this breakout range or possibly even retest the breakout level then this could set up as a buy at the $43.75 mark. A possible tight stop below the wedge low would be a safe bet for the stop loss.
Gray Television, Inc. (GTN)
GTN is a broadcasting company that operates in the United States that also owns digital assets (i.e cryptocurrency).
The company has not been able to rally with the rest of the market as the indices have reversed and this stock has been stagnant until now.
With this earnings beat we can see that the stock was already heading higher and broke above all of our moving averages. We can see that was enough to get price to finally break above the 200-day moving day average which means this could be the start of a stage 2 market uptrend mark up stage.
The bullish case scenario would mean that the stock makes it back to all time highs and we see a nice run and trend over the 200-day moving average.
This could potentially set up to be a longer term play that can be held for months and you simply trail up the stop loss.
There are two ways one could play this. The riskier way would be to buy now with a bigger stop loss beneath the breakout range area at $8.70. The safer solution would be to wait for a retracement and wait for the market to range before taking a trade and setting a stop loss below the 200-day moving average.
Robinhood (HOOD)
HOOD is the broker used for the GameStop, AMC, Dogecoin fiascos of 2020. Some people love it, some people hate it, but we are not here to judge the ethics of the company, only the trade set up.
HOOD definitely changed the industry with the creation of commission free investing. A broker that first started as a joke quickly began to gain traction and take the industry by surprise.
The company had a huge rup up after IPO and then as others had, we saw a sell off occur. Price then began to range for over a year.
May of this year seems to be the month that started this recent rally in price and possibly starting a stage 2. All of the moving averages are on top of one another and this recent drop was due to earnings.
Now depending on your style, earnings misses or beats may play a vital role in your trading, however we are not going to focus on that. Now there are also 2 ways to play this trade here. You can simply buy now as well with a stop loss below the 50-day moving average because if it closes below it the sell off will probably continue. The other option is setting an order to buy above the high of Thursday at $11.80 with a stop right beneath Thursday’s low.
Good evening, and welcome to this week’s edition of Stealth Trades!
The Fed raised interest rates another 0.25% this week. Americans now have the highest borrowing cost they have seen in 22 years.
Powell and his clown squad continue trying to squash growth in order to combat the inflation caused by all the money they printed in 2020 and 2021.
As of this week, interest rates are the highest they have been since 2001.
So far, investors have shrugged this off, however. The 25 basis point move was already priced in, so stocks moved little on the news.
If I had to bet, I would say Wednesday was the last rate hike we will see for a while. Powell has made his point. And he has proven that he would stick to his plan until inflation was tamed.
Now sit down and let the markets work Jerome.
I have a flight to catch in a few hours, so I will jump straight into my trade ideas for next week:
Traeger (COOK)
My fellow barbecue enthusiasts will recognize this name.
Traeger changed the game a few years ago with its easy-to-use, app controlled, pellet smoker grill. The meat smoking trend grew tremendously popular doing COVID, allowing the company to rapidly grow its market share.
Several competitors have attempted to dethrone the BBQ king, but Traeger is the original and as such, sells at a premium. This is how the company is able to maintain gross margins of over 30%.
COOK went public in mid-2021 at $22 per share. It then fell 90% in last year’s bear market to less than $3.
But price has now stabilized, and the stock appears to be nearing the end of its Stage 1 basing process.
Volume is drying up nicely, the moving averages are turning upward, and volatility has come way down. If COOK can get above the $4.50 area, it could trigger a new Stage 2 uptrend and a perfect buy point.
CAVA Group (CAVA)
CAVA is a hot new restaurant chain with 263 locations across 22 states. The company plans to open 44 more this year.
The company went public in May and, so far, has shown a lot of strength.
The stock was offered at $22 in its IPO, and it hit double that number in its first trading day.
The bull case is that this could be the next Chipotle. I haven’t eaten at one so I can’t weigh in on the quality, but I would call that overly optimistic.
But I’m not looking for a stock I can hold for a decade – just something capable of delivering a quick gain.
There are two ways one could play this. The first would be buying a break above $54 to see if the stock surges when it hits new high ground.
The other trade would be buying here in the $48-$50 range with a stop loss below the initial breakout area of $46. This coincides with the 21-day moving average and should offer support if CAVA is to continue moving higher.
On Holding (ONON)
The popular athletic shoemaker has been a favorite of mine since the beginning of the year.
Hot retail brands have been some of the biggest success stories in the stock market, so I am always in search of a budding name with big sales growth like OnCloud.
The company is growing revenue at around 80% per quarter so this stock is in play until those numbers start slowing down.
ONON made new 52-week highs this week before falling 6% in Thursday’s selloff. I would consider buying on this pullback to the 21-day moving average which has supported this stock for most of the current rally.
A trader could risk 10% by putting his stop loss below the 50-day moving average.
Good evening, and welcome to this week’s edition of Stealth Trades!
After a big move higher last week, stocks traded mostly flat this week. The Nasdaq fell 2.3% on Thursday which wiped out the gains from the first half of the week.
You likely saw some of your positions pull back this week. Let me reassure you…
This is normal.
Stocks do not go straight up. Even in the best conditions, they stairstep their way higher in a series of higher highs and higher lows.
That means there are multiple pullbacks within the uptrend.
The market has gone pretty much straight up for the last four months. The Nasdaq index has gained over 30% since March.
That is an incredibly powerful rally which, at some point, needs to be “digested.”
Stocks get extended, prices get ahead of themselves, and FOMO pushes retail investors to pile in near the top of big moves like this.
It is both healthy and necessary for growth stocks to occasionally pull back and “reset” before continuing their move higher. Investors trading on excessive margin and impatient amateurs who are chasing gains need to be stopped out so that supply and demand can again even out.
Wildly speculative activity leads to crashes (look at the 2000 dot-com bubble to see what I mean). And that is the last thing we want to see.
Take a look at the weekly chart of the index below:
Note that we are trading up against the final supply zone.
When I say “supply” I am simply referring to areas where a large number of sellers are likely to sell. They are offering shares for sale and thus creating supply.
Anyone who bought at the end of 2021 has been underwater for a year and a half. The thought of getting out at break even is going to be appealing, especially after such a hard and fast run.
I wouldn’t be surprised to see the market struggle here for a few weeks while these sellers are digested.
Since the market bottomed in October, we have not seen a pullback greater than 12.5% in the Nasdaq (9.0% for the S&P 500).
In my opinion, 10-15% pullbacks are the norm in a healthy bull market, and I look at them as opportunities to buy leading stocks that are holding up the best.
I expect to see a shallow pullback in the next 2-3 weeks. I could be wrong. But based on past bull markets, this would be more than warranted at this level.
Some members may have noticed the number of new trades slowing down over the last 1-2 weeks. This is not an intentional action, but a result of fewer trade setups in an extended market.
We don’t chase stocks. We look for low-risk, high-probability buy points in the top stocks of the best-performing groups.
When we see a lot of those, we make a lot of trades. When fewer opportunities arise, we trade less. It really is that simple.
My FIRE Trader Club service is a great example of that.
In May we initiated 14 new trades. Our watchlist was lighting up like a Christmas tree and entry points were being hit left and right.
In June, only 7 FIRE trades triggered.
And three weeks into July, we have only seen 3 actionable setups this month.
Again, this is not our analysts being lazy. It is a result of a cooling market and speculative activity slowing down.
If investing for the long-term, I would stay the course. Stocks are likely to be higher by the end of the year and much higher in years to come.
In the near-term, however, I am getting more cautious. This does not mean going to cash. But I am taking profits more aggressively and nailing down some of my open gains to remove unnecessary risk.
If you have been following our ideas, especially in the Alpha Stocks and FIRE Trader Club services over the last few months, you have had a very profitable start to the year.
My advice is to continue to be picky. Demand the best stocks in the best groups at ideal entry points. Don’t get sloppy with your trades and give back your hard-earned profits.
If stocks keep setting up, we will continue taking the trades. If they don’t, we will wait for low-hanging fruit.
Here are a couple trades I’m watching right now:
Redfin (RDFN)
RDFN is a stock we bought in my Alpha Stocks service on June 27 when it broke out above resistance at 11.50.
It rallied 50% over the next three weeks but has now pulled back to a level where I would consider adding to or taking a new position.
Redfin is a powerful stock, but it also has a history of 15-20% pullbacks throughout its up moves. As of Friday morning, the stock is 20% off its high with support at the 21-day exponential moving average which has contained this surge thus far.
Traders may consider buying here with a stop loss near $13.
NIO Inc. (NIO)
NIO is basically a Chinese Tesla. They are an electric vehicle manufacturer with seven models in production and have so far delivered around 400,000 units.
I don’t typically like Chinese stocks, but this one looks poised for a breakout higher.
Below is my stage analysis for NIO stock on a weekly chart covering the last four years.
The first breakout into a new Stage 2 uptrend is, without question, the best place you can buy a stock. If NIO can hold above its 200-day moving average and breakout higher, this could be a near perfect entry on this growth stock.
Hims & Hers Health (HIMS)
This is a potential short trade that could deliver a nice gain if the market pulls back. I am still focused on buying opportunities, but it never hurts to be prepared for the other side.
Some of you may remember this as a stock I was looking to buy a couple months ago.
Oftentimes, the best short ideas come from stocks on my long watchlist that fail.
HIMS tripled from October to April but began rolling over after a poor earnings report at the beginning of May.
Not only did the stock fall on above-average volume, but even a 33% discount has failed to attract buyers.
HIMS has formed a support shelf near the $8 level. A move below that would trigger a lot of stops, making it an ideal place to sell the stock short.
Good evening, and welcome to this week’s edition of Stealth Trades!
This was one of the strongest weeks for stocks I can remember.
The indexes performed very well. The Nasdaq gained roughly 4% and the S&P was up 2.5%.
But there were some huge movers in the areas we have been focusing on.
AI continues to be the theme of this bull market. Stocks with exposure to artificial intelligence are by and large outperforming other names.
We have been cherry picking this basket of stocks to find setups within this leading group, and the results have been tremendous.
My analyst and I also noticed a lot of money flowing in the crypto space over the last couple weeks.
Look at the huge increase in trading volume in the Grayscale Bitcoin Trust (GBTC) over the last several weeks (see chart below).
Bitcoin has been flying which triggered a group move.
Mining stocks, crypto brokers, and even payment processors who accept Bitcoin all began surging together.
We bought a few of them in my Alpha Stocks service from low risk buy points and saw quick profits.
The first two are cryptocurrency mining stocks. The last one is Coinbase – the preferred custodian for most of the new crypto ETFs under development.
I show you these charts not to boast, but to show you what is possible in a good market by simply focusing on leading groups and buying those stocks when they break out of consolidation.
You don’t have to stick to leading groups. Winning trades can be found in other areas as well.
Redfin manages a residential real estate database. And Nikola makes battery and hydrogen-powered semi trucks.
Both of these stocks delivered big gains as well:
But if you want to make things as easy as possible, focusing on the best-performing groups and sectors will greatly increase your odds of success.
Another factor that helped propel stocks this week was a weak dollar.
All things being equal, stock prices tend to move inverse of the US dollar.
Note the dollar’s performance during last year’s bear market in the chart below:
Today that chart has flipped, and the USD just broke down through support.
The market has been on fire. A collapsing dollar added diesel fuel to that fire.
Will the dollar keep falling? I don’t know. From a technical perspective, it looks to be heading lower. And news stories about BRIC nations creating their own currency and moving away from the US dollar are only making things worse.
The market is extended, yes. And we could see a pullback any day. But I plan to buy into that if it happens.
Look for the best-performing stocks. Focus on the ones within 5-10% of new highs when the rest of the market is pulling back.
That is how you find winning stocks.
Here are a few I am watching right now:
Unity Software (U)
Unity looks really attractive to me. We talked about this stock in Thursday morning’s live War Room session, and I bought a few hundred shares at that time.
Pull up a weekly chart of U and you will see a stock trying to break out of a 14-month Stage 1 base.
Shares ripped through the 200-day moving average (white line on chart) in early June and have held above the 21-day (blue line) ever since.
A series of shallowing retracements show the market working through supply at what has been resistance for many months.
Growth stocks pulled back on Friday, giving traders a second chance to buy this one near the $44 mark.
Do not risk more than 10% on the trade.
Shopify (SHOP)
Shopify is emerging from a beautiful Stage 2 base.
SHOP is up more than 100% since the start of the year – a clear sign this is a market leader.
Notice how volume is higher on the rallies up and lower when the stock pulls back. This is a subtle clue that buyers are in control and the smart money is building a position.
The breakout on Thursday came on 2X its average daily volume and the stock closed at the high of the candle – both good signs of a legitimate move.
I want to see SHOP stay above the breakout level or, at a minimum, above its 21-day moving average.
SmartRent (SMRT)
SmartRent offers a home automation platform for property managers and renters.
While this is not a pure play on artificial intelligence, it somewhat fits into the AI/tech /software theme we see playing out.
It is only about $4 a share, but the company market cap is $770 million. This is not a longshot penny stock with no sales.
After consolidating in the $2-$3 range for 8 months, SMRT started moving in May. Shares rose by 75% in three weeks following a strong earnings report.
It is now trying to break through resistance.
Friday’s candle had a 10% range from low to high showing something of a tug-of-war at new highs.
If SMRT can close above $4.00 on above average volume, I would consider buying this stock.
Good evening, and welcome to this week’s edition of Stealth Trades!
As of Friday morning, stocks are down roughly 1% for the week. After hitting a double top on Monday, the indexes pulled back slightly into their 10-day moving average.
The S&P continues to hold above the 21-day EMA, however, so this uptrend is more than intact. The bull market we called for in January remains in full effect.
Pullback days like Thursday can be a great stress test for the market. Did the market sell off all day and close near the day’s low? Or did it rally back in the afternoon and “reject” the selling pressure like we saw yesterday?
For individual stocks that pull back, was the selloff on heavy above average volume? Or did it take place on lighter volume?
The latter is what I want to see from market leaders (more on that in a moment).
A quick look at the leading stocks tells me leadership is still intact.
Nvidia, Meta, Palo Alto, Dynatrace, Marvell and Microsoft are all holding up well near their highs.
Unless they start rolling over, the bull market is intact, and the AI theme we have seen play out over the last six months will continue to be where we focus our efforts.
One thing I like to do when stocks are down in the morning is look for names bucking that trend.
I keep a watchlist in TradingView with 49 AI stocks on it. An hour into Thursday’s session, 48 of those stocks were red.
1 was green – DigitalOcean Holdings (DOCN).
Despite the bloodbath taking place, DOCN was actually up 4% on the day.
It was also breaking above a short-term pivot point at $41.
We immediately recommended this stock as a buy to our Alpha Stocks members.
DOCN surged and we are up 14% on the stock in less than 24 hours.
Nothing is guaranteed. And if the market had continued to sell off, the trade may not have played out as well as it did.
But in trading, you always want to focus on the strongest names –stocks showing the greatest strength, especially when things are ugly.
Earlier I said that I want to focus on those whose pullbacks are showing the most promise. I want to see shallow retracements on light volume. This is my clue that the big players are not selling, and the stock has a good chance of pushing higher.
Below are a few that I like right now:
Dynatrace (DT)
Dynatrace is a software company developing intelligent platforms that allow customers to modernize and automate IT operations.
Their secret sauce? You guessed it… artificial intelligence.
Now only has the pullback been shallow (only 6% from its highs), it took place on decreasing volume.
The stock is breaking through its $52 pivot point as I type this, making it an actionable trade.
I just picked up a few hundred shares with a stop loss at 49.80 to risk just under 5% on the trade.
Datadog (DDOG)
Datadog is another AI name that has come back to life in a big way.
After falling 68% in last year’s bear market, the stock has surged 58% in just the last two months.
The shallow base formed over the last few weeks took place on lower-than-average volume – a hint that institutions are not selling, and the stock is becoming harder to buy.
DDOG just pushed through the $100 century mark which has acted as resistance for the last five weeks.
Traders could buy here with a stop just beneath the 90.88 swing low to risk 10% on the trade.
Marvell Technology (MRVL)
This isn’t another AI stock, is it Ross?
Yes. It is.
Marvell is a leading semiconductor stock whose products are used heavily in artificial intelligence applications.
The stock surged 40% in two days following a good earnings report and shares have consolidated in a tight range ever since.
MRVL tried to breach the low of the base on June 23, and we saw nice buying to support the price.
Volume remains low and price action is shallowing out nicely.
I will consider buying on a break above the short-term pivot (dashed line on chart) at 61.50.
As long as the stock does not make a new low before then, you can use the June 23 low for a stop loss to risk roughly 8% on the trade.
Good evening, and welcome to this week’s edition of Stealth Trades!
2023 is now half over.
And those sitting on the sidelines have missed some nice gains.
As of Friday morning, the Nasdaq is up over 30% year to date.
Hopefully you have been taking my advice and participating in the rally.
I have been bullish since January when the market gave us a breakaway momentum signal. I alerted members to it in the January 13 update:
I shared how statistics showed we were likely to see a big year in stocks.
And that signal has played out as expected…
I continued urging members to buy throughout January…
And February…
In March I brought your attention to the upside reversal in the Nasdaq…
This proved to be the best buying opportunity of the year.
And I have remained steadfast in my view that this was, in fact, a new bull market…
My outlook has not changed.
We are at the beginning of a powerful bull market that will continue to propel stocks higher for likely the next couple years.
Many investors make the mistake of waiting for the macro outlook to improve before investing. They are under the false impression that the economy leads the stock market.
Nothing could be further from the truth.
In fact, it is just the opposite.
Go back and look at every bear market throughout history. Stocks have ALWAYS bottomed long economic conditions improved.
As legendary investor John Templeton once said, “Bull markets are born on pessimism, grow on skepticism, mature on optimism, and die on euphoria.”
In other words, once the general public is finally optimistic, the bull market is coming to an end.
During the great financial crisis, stocks bottomed in March 2009 – right when things were at their worst. By the time employment and GDP numbers were healthy, the market had already doubled.
It was the same with the COVID selloff of 2020.
The low came right when things were at their worst… at the start of the lockdowns when unemployment numbers were the highest on record.
And the current rally began in October of last year – on the very day we saw the highest inflation report in modern history.
If you want to make money in stocks, turn off the TV, put down the newspaper, and focus on how stocks are moving.
The price action is clear… This is a power trend.
Bull markets make it much easier to make money in stocks.
And if you want to make BIG money, the trick is to focus on leading groups and tap into the “theme” of the market.
Right now, the theme is AI. Focusing on stocks with exposure to artificial intelligence will vastly improve your odds of success in this market.
In a Saturday webinar two weeks ago, I shared my favorite stock to buy on Monday – SoundHound (SOUN), a small-cap AI stock in a perfect breakout setup.
Many of you bought that stock with me, right before it shot up 50% in 9 days. If you are one of those people… well done.
After being up just over $9k, I sold half of my position on Wednesday and plan to add back in on a retracement.
If you missed the trade, don’t chase it. There will be more opportunities.
Here are a few other trade ideas that caught my eye:
JFrog (FROG)
JFrog is a supply chain software company out of California.
This mid-cap stock formed a base over the last twelve months and is now breaking out on above average volume.
This looks good for a buy with a stop loss at $26.00.
Unity Software (U)
Unity is a big player in the metaverse space since the company specializes in real-time 3D content.
The company is also deep in AI development which is a space I want as much exposure to as possible.
The stock has had a hard time getting above the $43 level, but the recent surge in volume looks like the fuel it needed to power to new highs.
You can also see the cup and handle pattern I have drawn on the chart.
U looks buyable to me here or on any pullback to its 21-day moving average.
Shopify (SHOP)
Shopify needs no introduction.
If you bought anything online from anywhere other than Amazon, the sale probably ran through Shopify.
The stock is up 175% since October and proving to be a market leader.
The recent action shows shallowing retracements on declining volume – a textbook breakout pattern.
I would consider buying on a move above $66.35 with a stop loss at $61.45 to risk 7% on the trade.