Weekly Update: Trump Tanks the Market

Good evening, and welcome to this week’s edition of Stealth Trades!

President Trump just wiped out $4 trillion of wealth in 48 hours. His tariff plan – announced Wednesday afternoon – led to a 10.5% decline in the Nasdaq index in less than 48 hours.

That is the biggest 2-day drop since COVID in March 2020.

It was an absolute bloodbath for stocks this week, and Donald Trump is 100% to blame.

Now look… I am not a Trump hater. I voted for him. I have supported all of his economic policies. But what I saw this week was one of the most reckless actions a US president has ever taken.

The premise was simple – other countries impose bigger tariffs on us than we do them, so we are going to level the playing field. You have a 20% tariff on American goods, so we will put a 20% tariff on your goods. 

Perfect. Completely agree.

But Trump did not follow this logic.

During the rose garden press conference, President Trump held up this chart showing each country’s tariff on US goods in one column, and the rate we would be charging them in return.
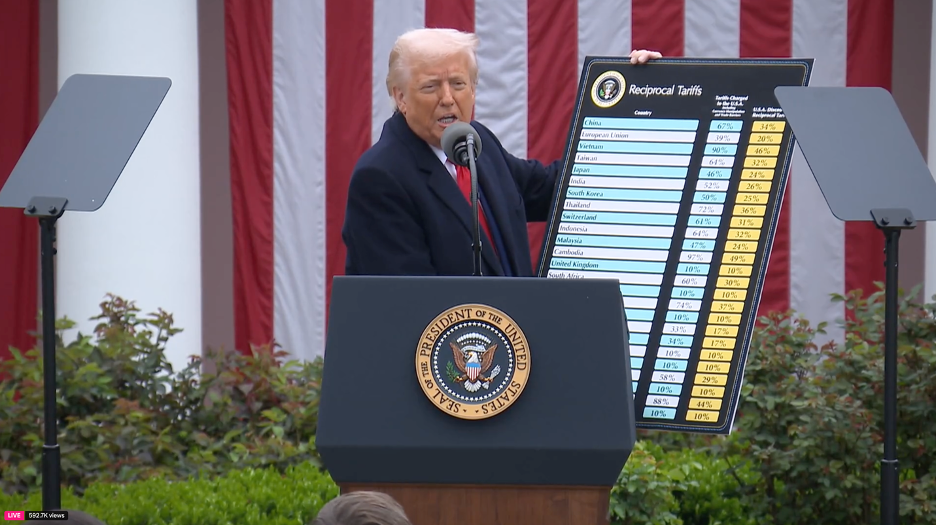
Retaliatory tariffs from the US were to represent 50% of what that nation charged on US imports.

But here’s the problem…

He made up the numbers.
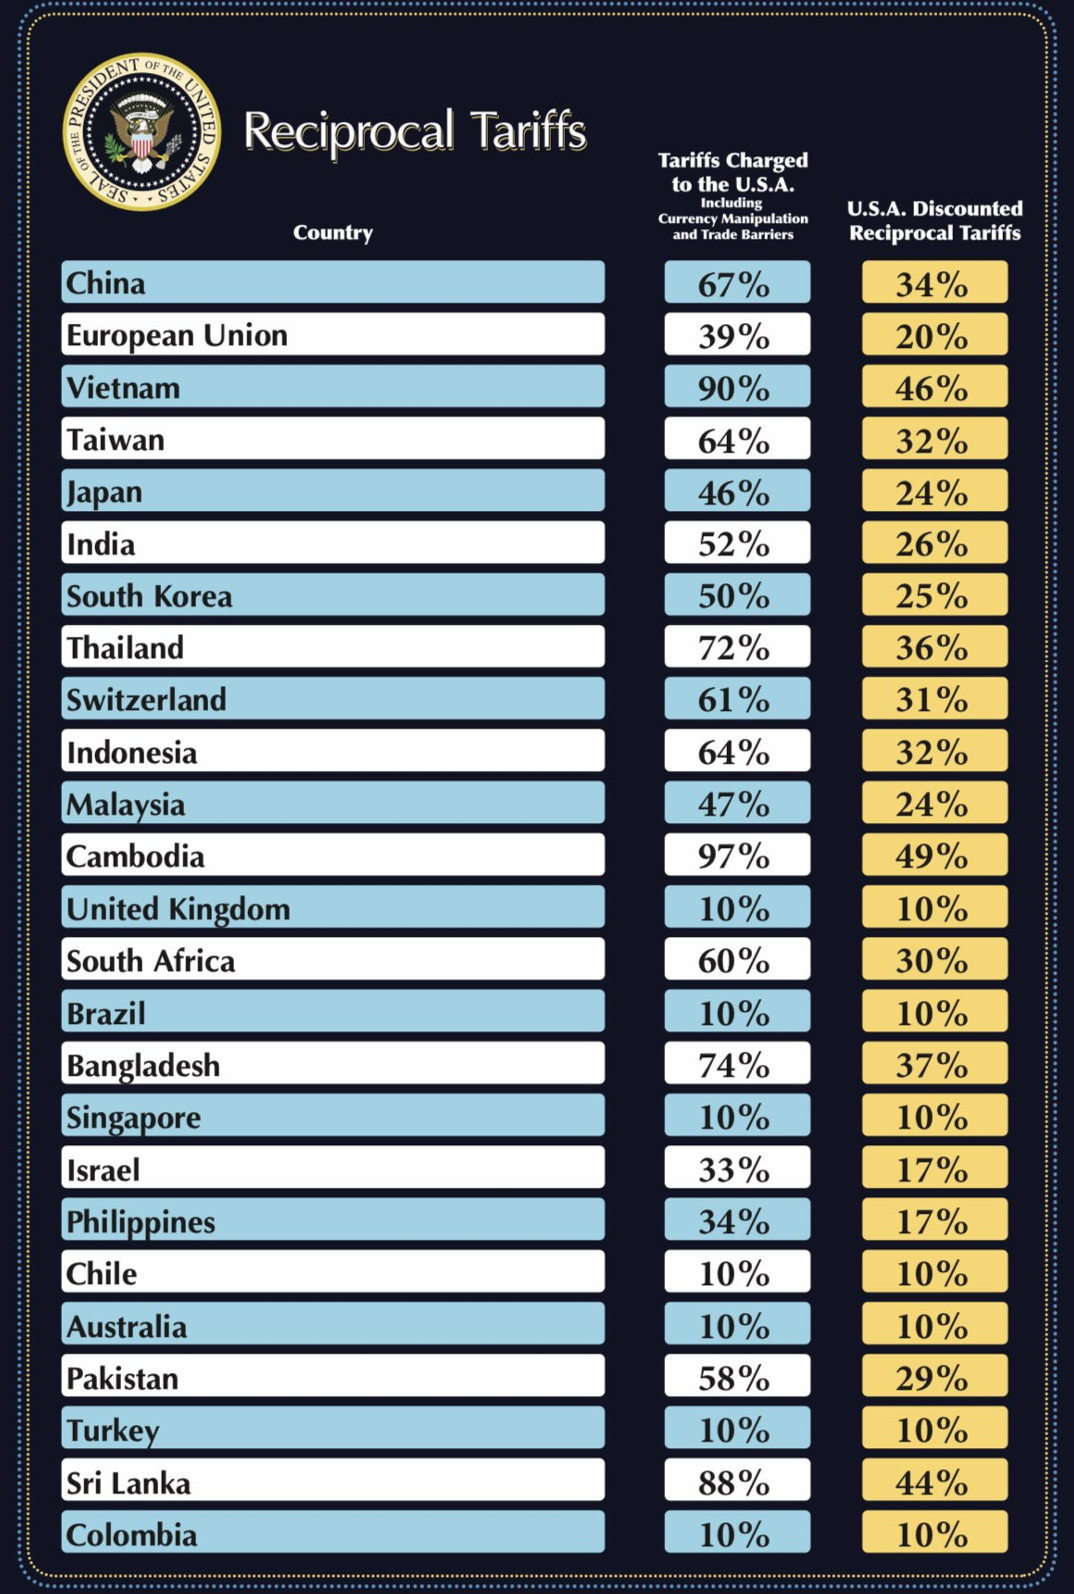
China does not have a 67% tariff on US goods. The blended rate is just under 20%.

The EU does not impose a 39% tariff on us. They charge 2.5% and 10% on cars.

And Vietnam certainly does not slap a 90% import fee on us.

So, where did these numbers come from? Here is Trump’s formula for determining a country’s “tariff” on US goods:

Trade deficit / US imports

President Trump is trying to penalize countries that export more goods to the United States than they import from us. Here’s the math:
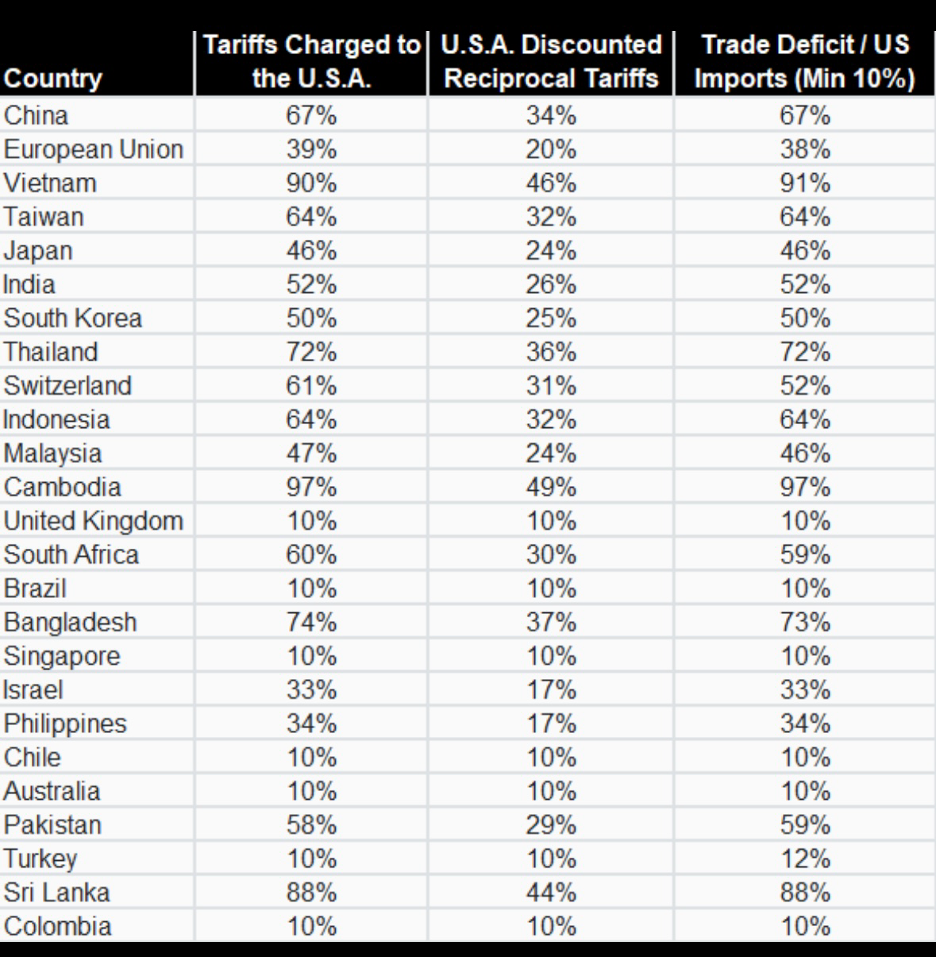
In my opinion, this logic is flawed. Of course we are going to have a trade deficit with Vietnam. The per capita GDP in that country is $4,282. The average Vietnamese factory worker earns $1.22/hour. That is the entire reason American companies have clothing, shoes and other goods made there – it’s cheaper.

By contrast, the per capita GDP in America is $82,769. We have immensely more disposable income. And naturally, we are going to purchase more goods than our Vietnamese counterparts.

So, Trump’s plan is to slap a 46% tariff on these goods when they enter the US.

Look… I’m a capitalist. I am not some bleeding-heart softie hoping the whole world will hold hands and sing Kumbaya.

But this plan just doesn’t make any sense. And no one saw it coming…

This is what happened to stocks after it was announced Wednesday afternoon.
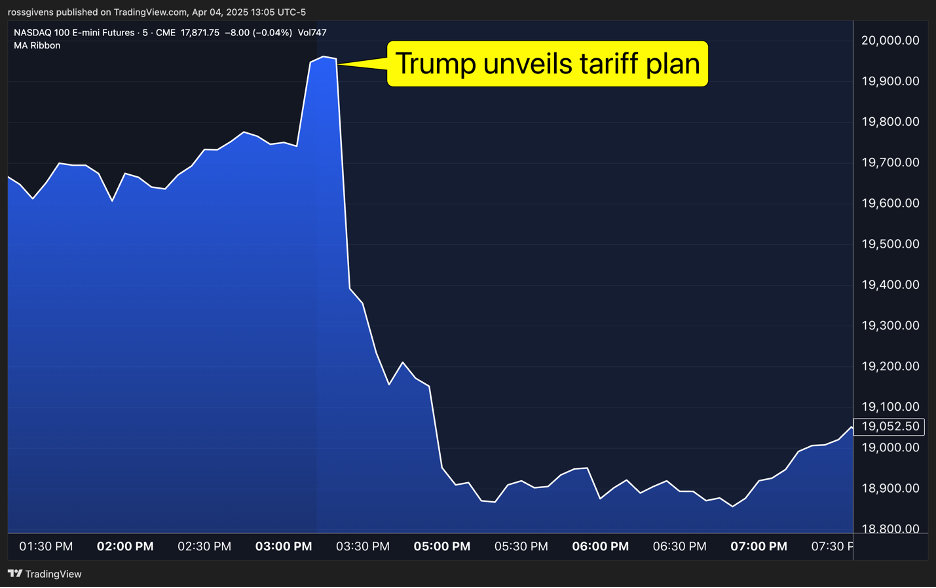
The indexes were down 5% in just over an hour. When the market opened up Thursday morning, it sold off some more.

Friday morning, China announced a retaliatory tariff of 34% on US goods.

Trump claimed China charged us 67%. Clearly, they do not. Because this news triggered another massive selloff.
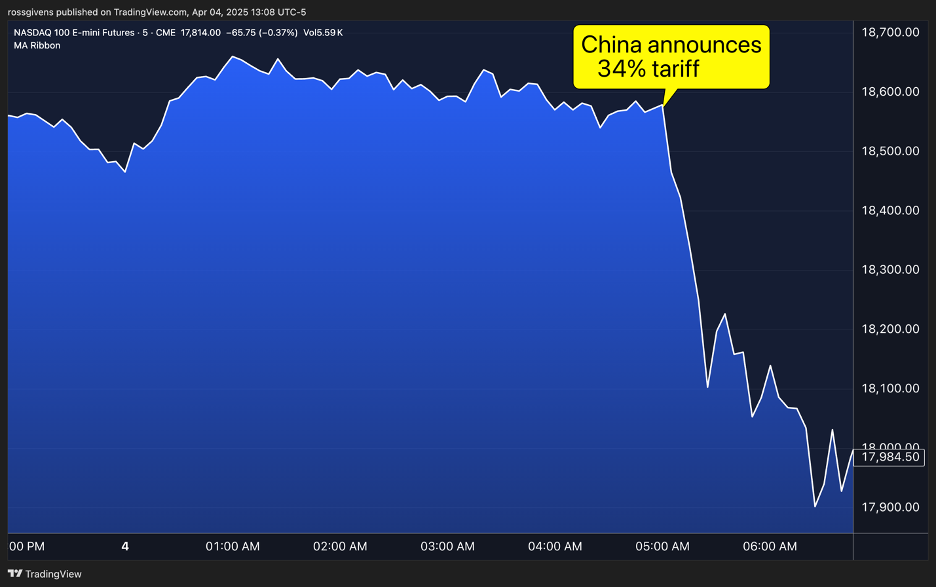
This is one of the ugliest environments for investors in years.

Will big opportunities be waiting on the other side? Absolutely! But in the meantime, this is a lot of pain.

I hope this is part of a bigger plan for the president. I want to believe that this is a calculated move, designed to either drive rates down and refinance the national debt at lower rates or bring world leaders to the table.

If his plan is the latter, this seems like the wrong way to go about it. But that’s just my opinion.

Hopefully we will see a resolution sooner than later. Once this uncertainty is behind us, the market will no doubt resume its march higher. But until I see signs that conditions are improving, my long exposure will remain minimal.

I held a special webinar Monday night covering the tools I use to time the market. I walked viewers through the metrics and indicators that signal healthy conditions.

If you missed that presentation, you should have received the recording. Please watch it. The model should be a big help to you both now and into the future.

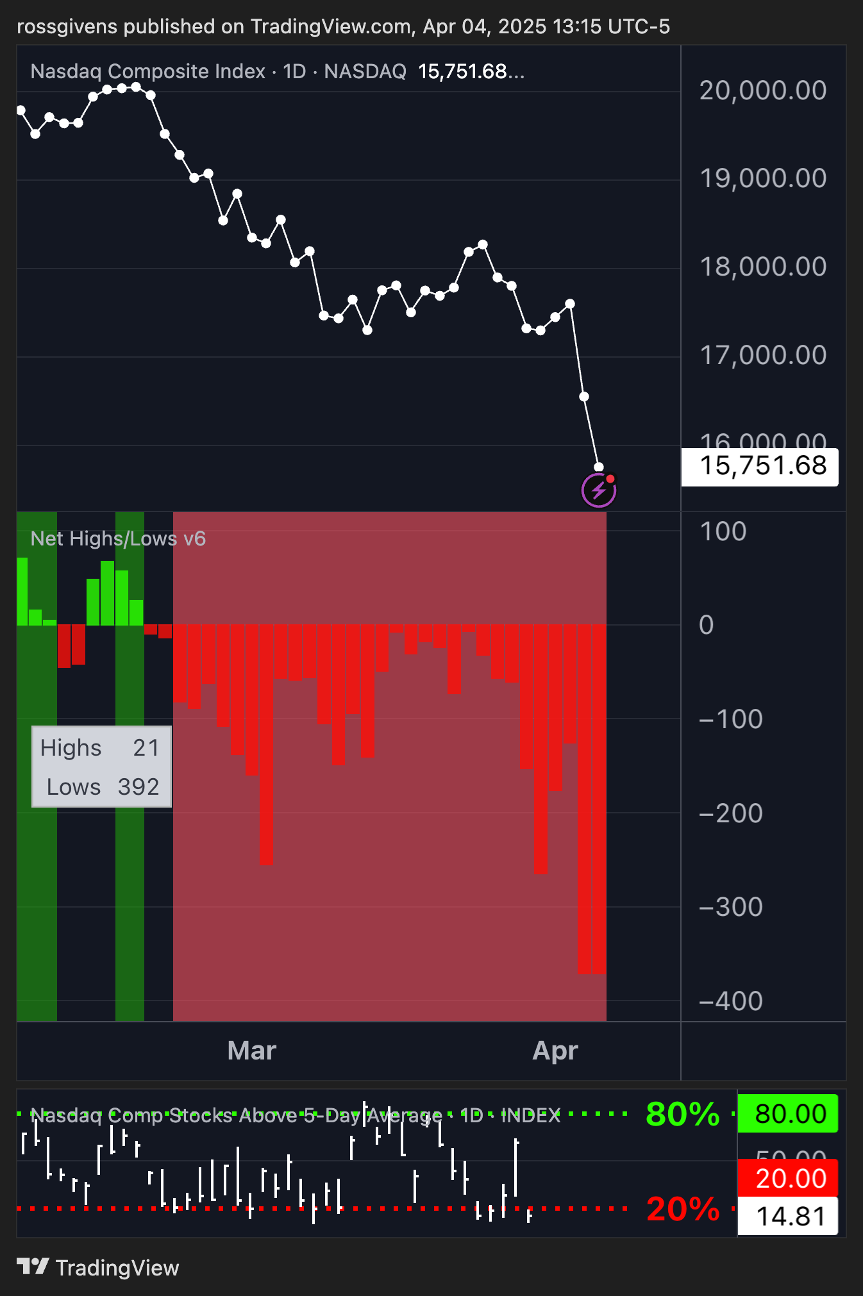
To update those in attendance, the net new lows indicator remains deep in the red:
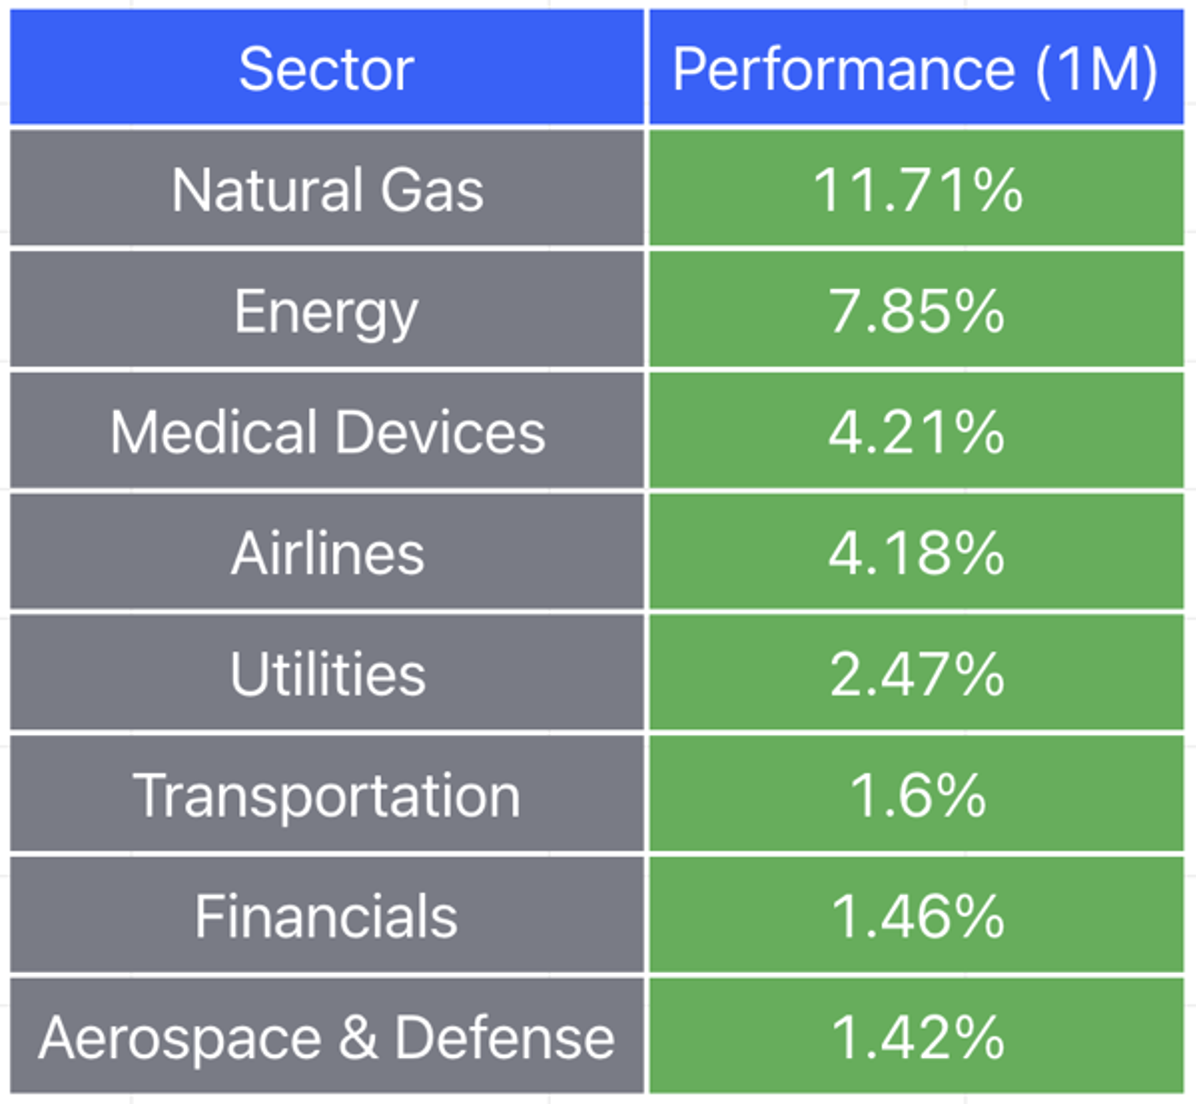
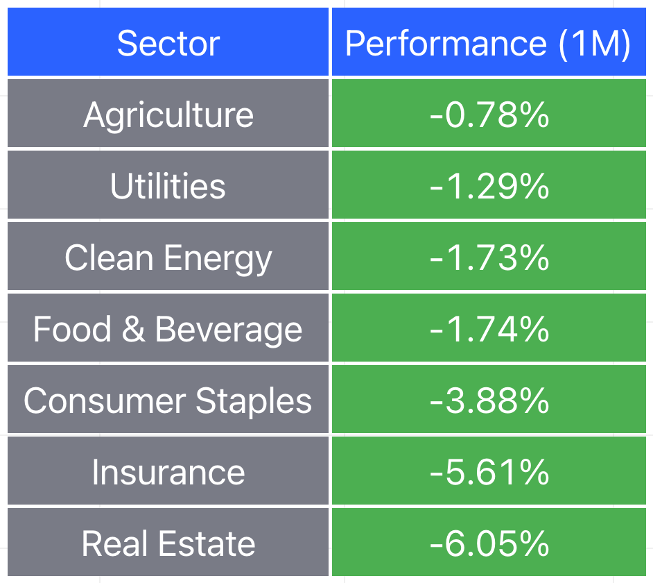
The best-performing sectors are still defensive areas:
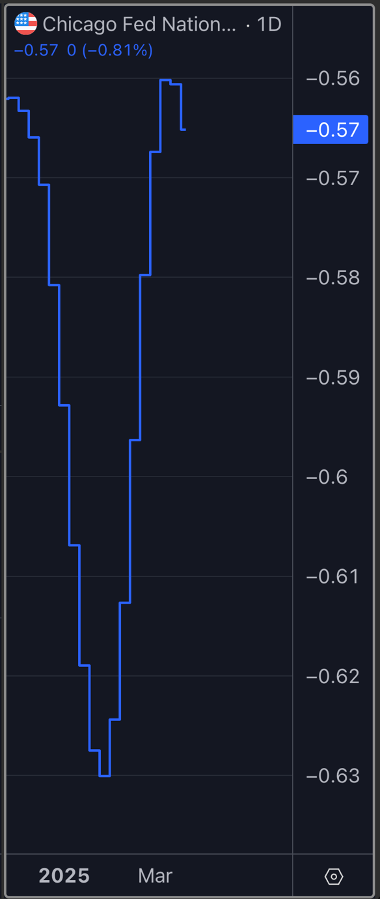
And although NFCI did tick down on Wednesday, I will be shocked if it doesn’t jump substantially this week.
Do not be in a hurry to get back in the market. It is an hour until market close at the time of this writing, and the Nasdaq Composite is down 5% on the day, holding near the lows. That is NOT the sign of a market on the verge of recovery.

Best wishes for your trading,

Weekly Update: ​​5 Ugly Charts

Good evening, and welcome to this week’s edition of Stealth Trades!

I do not want to be the bearer of bad news.

I am an optimist by nature. I want to be bullish on the stock market whenever possible.

But right now, it’s not pretty.

There are 5 charts I look at to assess the health of the stock market. And right now, all of them look bad.

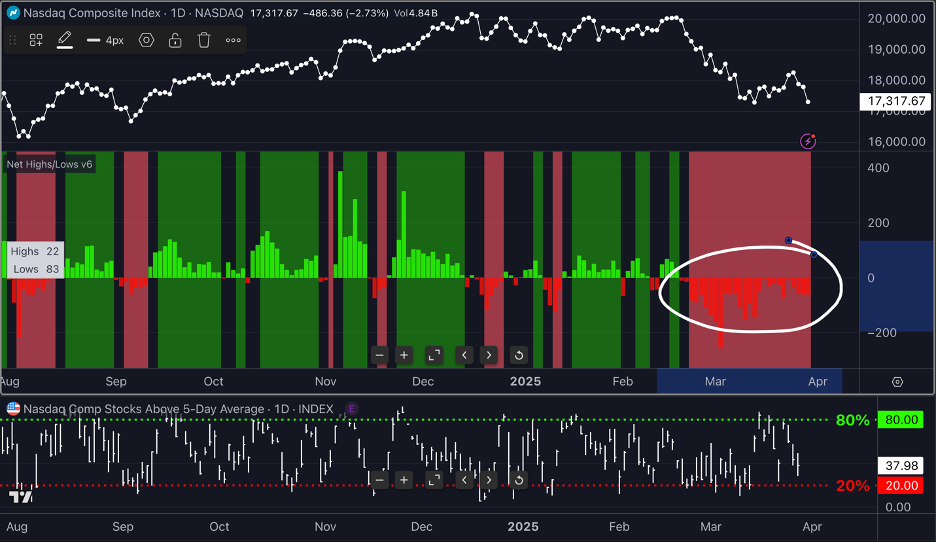
The net new highs/lows chart below shows how many stocks across a given index are making new highs vs new lows for the day. If the net number is positive, more names are making new highs which is typically reflective of a healthy market.

But right now, that is not the case.

For the last 27 trading days in a row, this metric has been negative – a clear sign of an unhealthy market and steady selling on Wall Street.

I also like to keep an eye on the NFCI reading. This indicator, which I detailed in last week’s email, reflects the liquidity of the market. A declining reading indicates loosening financial conditions and a rising one shows tightening.

Released once a week by the Chicago Fed, this number was unchanged this week. As can be seen in the blue line below, the National Financial Conditions Index continues to reflect a poor environment for equities.

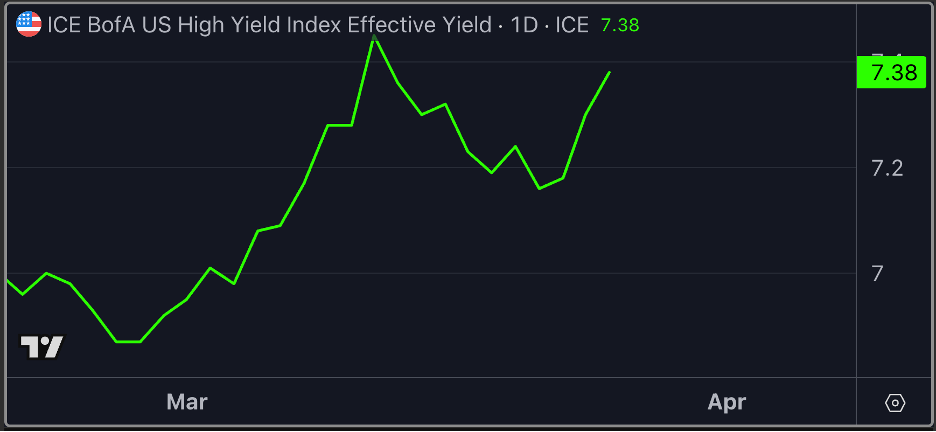
The high yield index is another thing I like to keep an eye on. Unlike traditional interest rate yields, this index reflects risk as well. This is the rate typically charged to less secure firms where lenders are not guaranteed a return of their capital.

And as you can see, it continues to climb higher…

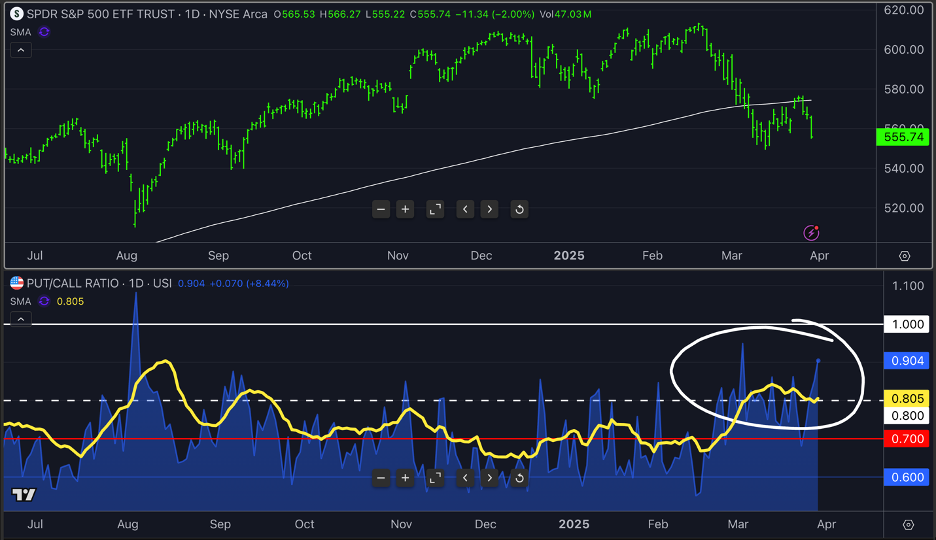
The put/call ratio is not delivering any hope either. Consistently high readings mean investors are increasingly bearish and buying put options at a higher-than-usual rate compared to calls.

While a short-term spike in the P/C ratio can indicate a potential turning point, steadily higher readings show broad bearish sentiment.

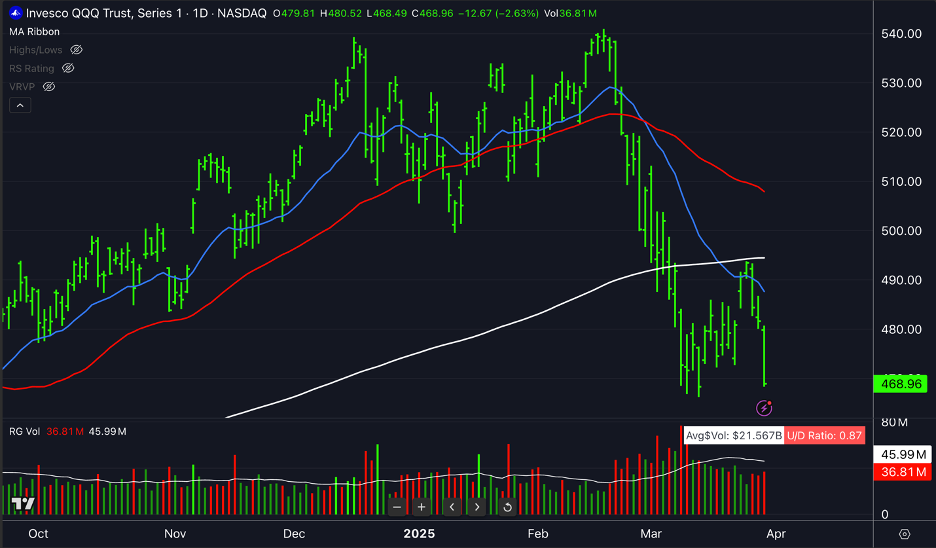
And finally, there’s the stock market itself. The chart of the Nasdaq index ETF below shows the rapid February selloff.

While it appeared that we could be finding a bottom, stocks collapsed this week to finish Friday with a nasty 2.8% decline.

Periods like this are unavoidable. Dips, pullbacks and bear markets are part of the game. I have no doubt that prices will be higher 6, 12 and 18 months from now.

But as traders, we must recognize when conditions are favorable and when they are not. And right now, they’re just not.

In my long-term account, I am 65% invested in cash. The other 35% is a mix of stocks and a few commodity ETFs holding gold (GLD), silver (SLV), copper (CPER) and natural gas (UNG). 

As soon as conditions improve, I will quickly and aggressively move more into stocks and buy at these reduced prices. But until then, I will remain conservatively positioned.

Best wishes for your trading,

Weekly Update:  ​​How to Time the Market (Seriously)

Good evening, and welcome to this week’s edition of Stealth Trades!

Most people say it is impossible to time the market.

I disagree.

You’ll never get it perfect, but there are proven indicators that, more often than not, have identified turning points in the stock market.

I want to talk about one of those today.

It is called the NFCI which stands for National Financial Conditions Index. This figure, published weekly by the Chicago Federal Reserve, measures how readily money is available in the financial system.

It combines over 100 indicators like credit costs and loan activity into a single reading. A rising NFCI indicates tightening conditions while a falling value suggests easing conditions and better liquidity.

The higher the NFCI, the worse it is for stocks and the economy.

The chart above shows this reading dating back to the 1970s. Recessions are highlighted in grey and coincide with above average NFCI numbers.

But this index can also alert investors to short-term shifts in the market.

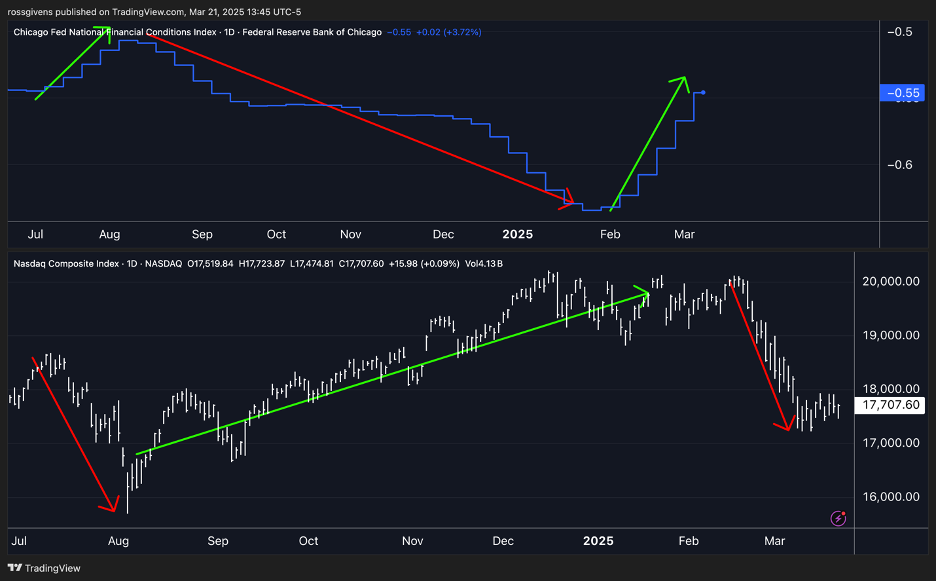
Here is a comparison of the last 8 months…

On top in blue is the NFCI. The Nasdaq Composite Index is displayed below in white.

Notice how periods where the NFCI Index was rising (tighter money conditions) led to dips in the stock market.

The opposite is also true. From August of last year through last month, loosening conditions led to higher stock prices.

Things flipped again in February, leading to a selloff over the last 6 weeks.

This inverse relationship has been maintained for several years…

A surging NFCI reading in 2022 coincided with the bear market.

And when this trend reversed lower, the stock market screamed higher.

The National Financial Conditions Index is not the holy grail. There are a few false signals here and there.

But when we combine this with other metrics like the net new highs indicator and the percentage of stocks above key moving averages, we get a pretty good idea of when we need to step on the gas and when it might be best to move money to the sidelines.

I won’t get too far in the weeds in this email, but I will be going over this in more detail in Monday’s LIVE Stealth Trades meeting over Zoom at 9am ET.

If you are reading this email, you have access to that session. You’ll get an email Monday morning with a link to join.

I’ll see you there.

Best wishes for your trading,

Weekly Update: My Top 3 Stocks

Good evening, and welcome to this week’s edition of Stealth Trades!

Stocks surged on Friday for some welcome relief after a vicious down week.

Is this the bottom? Is it time to start buying stocks?

I think it is worth a shot. And here are my 3 favorites right now.

Each of these stocks has it all – good technical setup, strong sales and earnings growth, and high relative strength.

If these trades don’t work, nothing is going to.

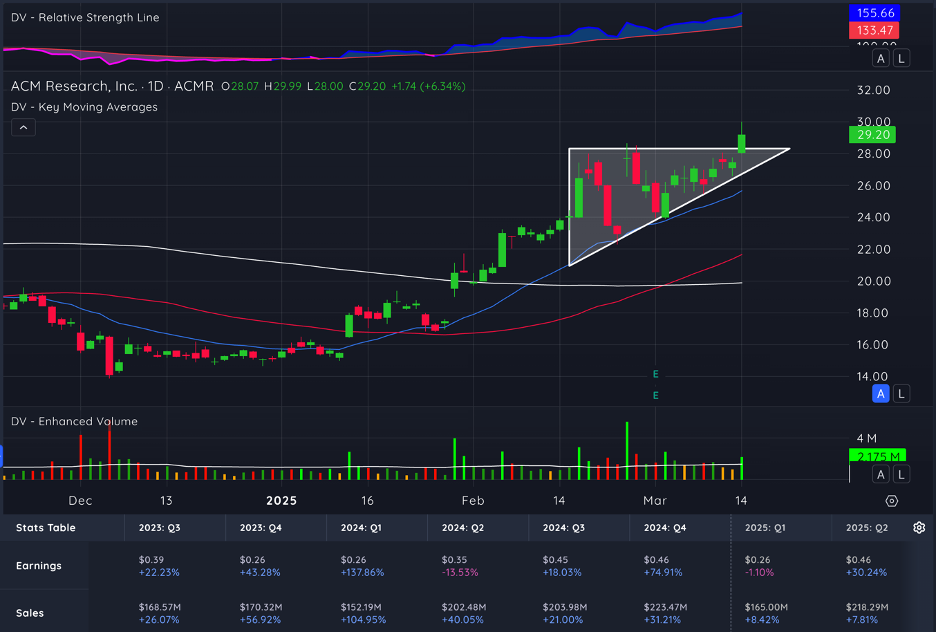
ACM Research (ACMR)

This semiconductor stock has held up better than any other over the last three weeks. Not only is it not going down, but it is in fact rising.

ACMR carries a 3-month relative strength rating of 97/100, and it just broke out hard from a consolidation wedge on above average volume.

This stock wants to keep running.

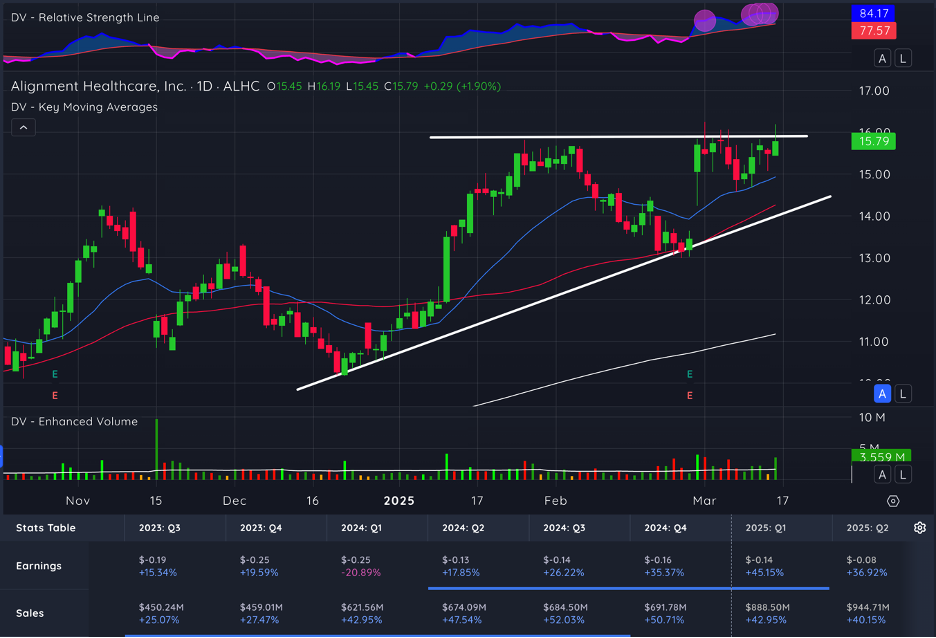
Alignment Healthcare (ALHC)

The indexes may be down this month, but no one has been selling ALHC. There is clear resistance at the $16 level following a 3-month shallowing pattern.

Big sales growth, big earnings growth, and an RS line making new highs before price…  This is exactly what I want to see in a breakout setup.

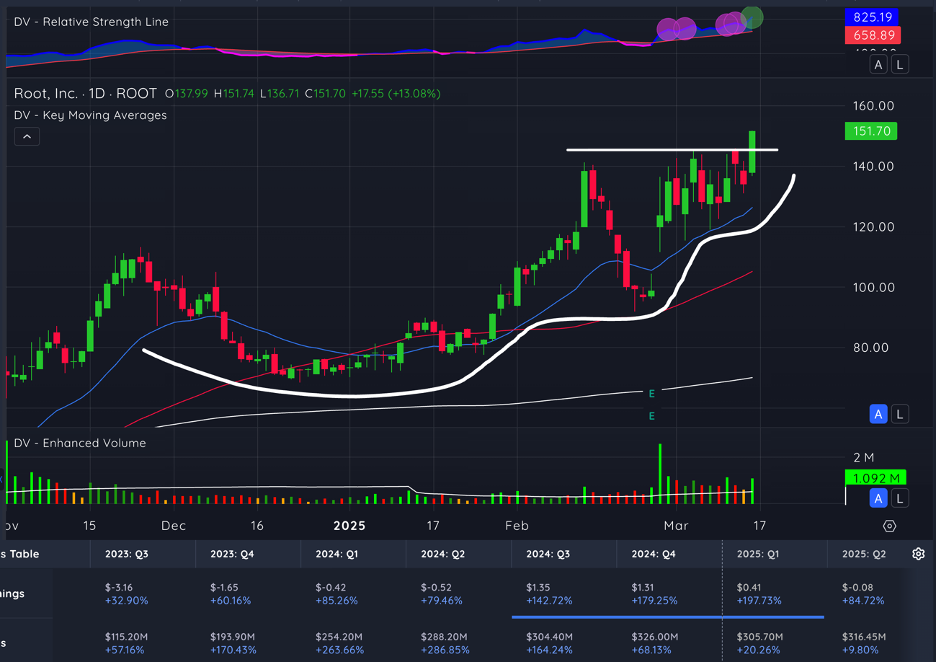
Root, Inc (ROOT)

ROOT is an insurance company, which is one of the top performing sectors right now. The stock is emerging from a classic cup-and-handle pattern.

Shares gained 13% today on above-average volume and closed at the high tick. This is exactly what you want to see on a breakout.

The fundamentals are mind-blowing as well. The firm is growing sales and earnings by more than a hundred percent a quarter. It is no wonder the stock has been a 98th percentile performer over the past 12 months.

ROOT is up 250% over the last year and showing no signs of slowing down.

Best wishes for your trading,

Weekly Update: The Bloodbath Continues

Good evening, and welcome to this week’s edition of Stealth Trades!

Trump’s tariffs continue to wreak havoc on the stock market.

Over the last three weeks, the Nasdaq. Index is down more than 10% – officially putting, making this a market correction.

Out of 654 stocks with a market cap of $10 billion or more, only 23 were up at least 5% on the week.

Those stocks are listed below.

Several of these stocks are headquartered outside the United States. Chinese companies like Alibaba, Baidu and Sea Limited are unlikely to be affected much by Trump’s new tariffs against Mexico and Canada.  PDD is a department store chain based in Ireland.

But domestically, many of the biggest growth names of the last two years have been taken out behind the woodshed.

Nvidia is down 28% from its January highs, wiping out nearly a trillion dollars in value in two months.

Astera Labs (ALAB) – which also peaked in early January – is down 57%. Applied Optoelectronics (-65%), Intuitive Machines (-64%), NuScale Power (-54%), Applovin (-49%), Marvell Technology (-45%) and countless other 2024 leaders have been pummeled.

One of the hardest things to do as an investor is to buy in the face of a selloff.

Walter Deemer is one of the best technical analysts who ever lived. And he has a quote that I love. In fact, it is the title of his book…

“When it comes time to buy, you won’t want to.”

Right now, I don’t want to buy. But historically, that is the best time to do it.

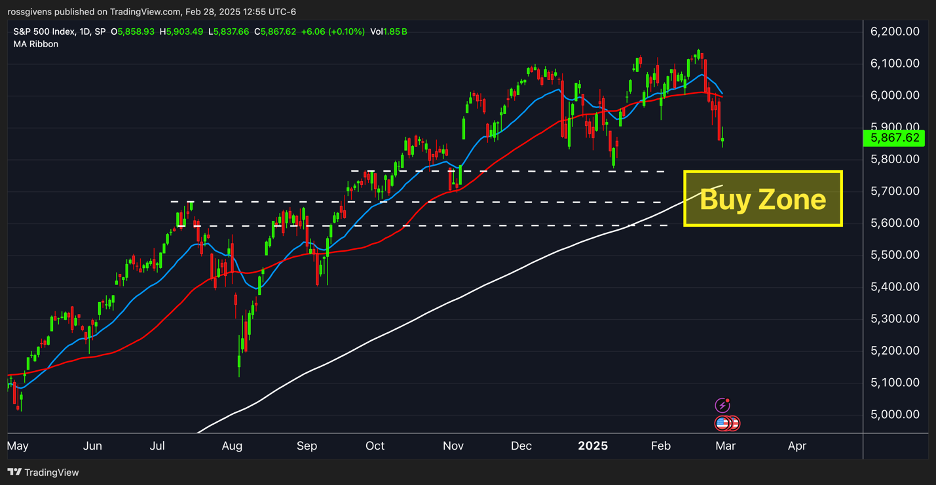
Last week I shared a chart of the S&P 500 highlighting where I wanted to buy the market. Here is an updated version:

The index is right in the middle of my Buy Zone. And despite my inclination to do otherwise, I plan to add money to my longer-term accounts here.

After such a rapid selloff, the market is highly oversold. I expect to see a big bounce next week. Only time will tell if that turns out to be short-lived.

Have a great weekend.

Best wishes for your trading,

Weekly Update: Where to “Buy the Dip”

Good evening, and welcome to this week’s edition of Stealth Trades!

It was a bloody week on Wall Street.

On the heels of a nasty selloff last Friday, stocks continued to push lower all week. In 6 of the last 7 trading days, the S&P 500 index broke the low of the prior session.

Declines like this or normal. In fact, they are part of the process.

Stocks don’t go straight up. After strong bursts higher, there tend to be short-term declines while the market is digesting the move and weak-handed investors take profits.

This creates the stair step pattern we often see on stock charts. It is also the reason so many investors love to “buy the dip.”

Dip buying is easier said than done. While it may look easy in hindsight, buying in the midst of a vicious decline is anything but easy.

So, instead of trusting my gut when emotions are high (never a good idea), I like to map out buy levels in advance. These are pre-determined price zones where I am committed to adding to my account if and when that price is hit.

But where do you buy?

Right now, we are in a clear and undisputed bull market. The average bull market “dip” is usually 8-12%. But I want to find some sort of technical level that could serve as support to back up my buy.

Here’s what I’m looking at now…

In the daily chart above, I have drawn a box around my Buy Zone for the S&P 500 index. My goal is to add on in the 5600 – 5750 range if given the opportunity.

This level is significant for a few reasons. First, it coincides with the 200-day moving average (white line on chart) where stocks tend to defend their uptrend.

There are also several previous support and resistance levels in this region which I have drawn as dashed lines.

Look at the middle of the three lines. See how there was resistance in July and August, preventing the market from going higher? Once we broke through, it then served as support in September, October and November.

This is telling us that the area is significant. It is a magnet for buyers and sellers and, if reached again, will likely see buyers stepping in once more.

Buying the dip is more of an art than a science. Don’t try to nail it to the penny. But the simple exercise of establishing where you will buy… in advance… before the market gets there will make it much easier to pull the trigger when the time comes.

Best wishes for your trading,

Weekly Update: The Hottest Sector No One Is Watching

Good evening, and welcome to this week’s edition of Stealth Trades!

What is the hottest sector of the market over the last quarter?

It’s not semiconductors… or AI… or cloud computing…

The best-performing sector right now is eSports.

Gaming is an often-overlooked corner of the market since most of us are well past our video game days. But there is an entire generation spending billions in the online gaming space. Even the world’s richest man – Elon Musk – has professed his love for online multiplayer games.

The chart below shows ESPO – the VanEck Video Gaming and eSports ETF – against the Nasdaq 100 index over the past twelve months.

The outperformance is staggering.

Even in a strong bull market year led by the tech sector, ESPO delivered more than double the gains.

A lot of this performance came from a single stock – Applovin (APP). APP stock is up over 700% since last February.

Full disclosure, I hold a position in APP. My quantitative model began buying the stock in my personal account last January at just under $38 per share. It added more in March at $63 again last month at $310. As of this morning, it was trading for $450.

But Applovin is not the only big mover in this under-the-radar group.

Take-Two Software (TTWO) – the video game developer behind Grand Theft Auto and Red Dead Redemption – is also seeing upward momentum.

Sea Limited (SE) is also on a tear…

You could also look at Tencent (TCEHY) which is the dominant name in the China market, but personally, I try to avoid Chinese stocks.

Call me crazy, but buying stocks in a socialist economy with a history of nationalizing successful firms is a little too risky for my taste.

The previous names I mentioned (APP, SE and TTWO) are all in nice clean uptrends with no signs of slowing down. But if you wanted to be more tactical, there are two others you might consider.

Roblox (RBLX) is a stock we have been bullish on since mid-2022. The share price has doubled over the last couple years and is now in a confirmed Stage 2 uptrend.

Thanks to disappointing numbers released earlier this month, the stock pulled back to the $60 area. It now sits on the previous break level from December as well as its 50-day simple moving average.

This, to me, is a low-risk entry point. This is where buyers should step in and support the stock if the uptrend is to resume. Traders should be able to risk less than 10% by buying here for a great pullback buy.

Another stock to keep on your radar is Electronic Arts (EA). “E… A.. Sports… It’s in the game.” (If you know you know.)

This stock has been a laggard in the gaming sector, but it is showing signs of coming back to life.

After a hideous start to the year, EA seems to have found a bottom in the $115-$130 range.

The stock is now forming a base as shown in the yellow box above, and a strong move through the top of this range could be the start of a new trend higher.

The AI theme is getting a bit long in the tooth. And while we are still in the early stages of application in the real world, the investment angle has gotten a bit overcooked in my opinion.

This is a good time to be looking for new, emerging sectors, and eSports is a clear standout to me.

Best wishes for your trading,

Weekly Update: Market Setting Up for A Breakout Higher

Good evening, and welcome to this week’s edition of Stealth Trades!

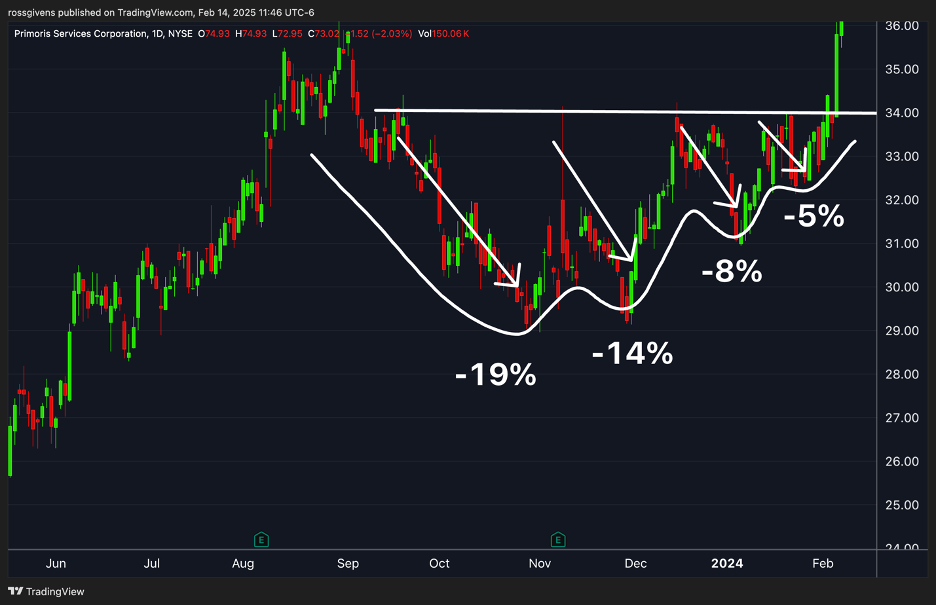
Take a look at the stock chart below.

This pattern is my bread and butter. It is my go-to setup when looking for explosive gains in a short time.

And right now, the entire stock market is setting up in this pattern.

This shallowing pattern, drawn in white on the chart of PRIM stock above, identifies precise breakout levels where supply and demand dynamics work to our advantage.

As you know, stocks don’t go straight up. Even in strong stocks, there are periods of rapid acceleration followed by shallow pullbacks and consolidation.

This is normal. In fact, this is necessary.

Stocks that are allowed to run too far too fast are more susceptible to a crash.

Instead, you want to see this “basing” action periodically as shares advance. Why? To get the selling out of the way.

Investors have different time horizons and different objectives. One investor may be happy to sell when his position rises 10% in value. Another may be targeting 50%. The dreamer may be eying a 500% move. The point is, they will all sell if the price gets high enough.

Primoris – the stock I showed earlier – was up 124% over the prior 10 months. Everyone who bought shares in the last year had a big open profit. That means there are a lot of jittery owners who would likely sell if the stock reverses course in order to lock in some of their gains.

You want to get those people out of the way. The last thing we want to see is a big wave of selling to drive the price lower. This selling is SUPPLY. These are the shares held by weak-handed investors who will quickly cash out if and when the tide turns.

The pattern I drew on white is the process of shaking out those investors.

Here is a more detailed look:

Four waves of selling that became shallower each time.

What you are seeing is this shakeout process where investors are taking profits, having their stop losses hit, and slowly running out of patience.

Over the same time, longer-term institutional investors are buying up those shares and building up their positions.

The stock is being consolidated from weak hands to strong. The “supply” is diminishing until, eventually, everyone who wants to sell has.

At this point, there are no more shares being offered in the $32-$34 range. And once that stock exceeds $34 (the resistance level over the last few months) we know we have moved through this supply zone and buyers must now pay up to acquire additional shares.

The stock is now free to move higher, and it can do so without additional demand.

You will see this pattern repeat again and again in high momentum stocks. There are typically 3-5 clean buying opportunities during a Stage 2 move.

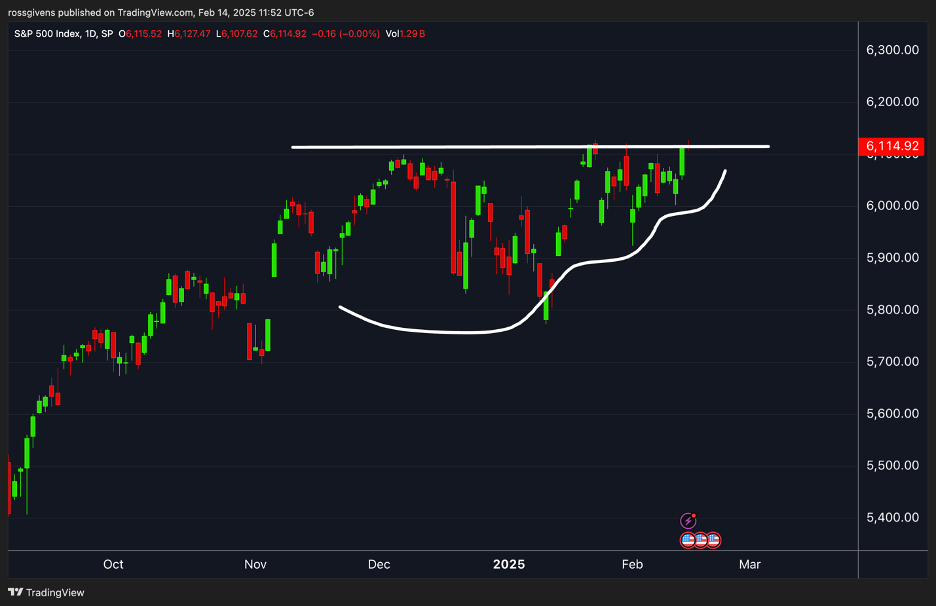
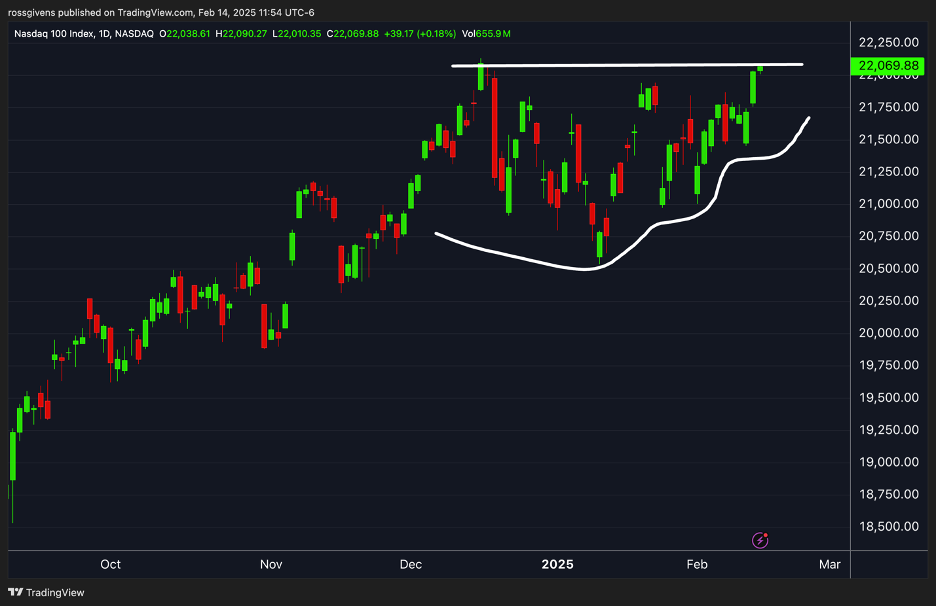
But right now, the indexes are setting up in this same pattern.

Here is the S&P 500…

The Nasdaq looks about the same…

And while nothing is guaranteed, this is extremely bullish to me.

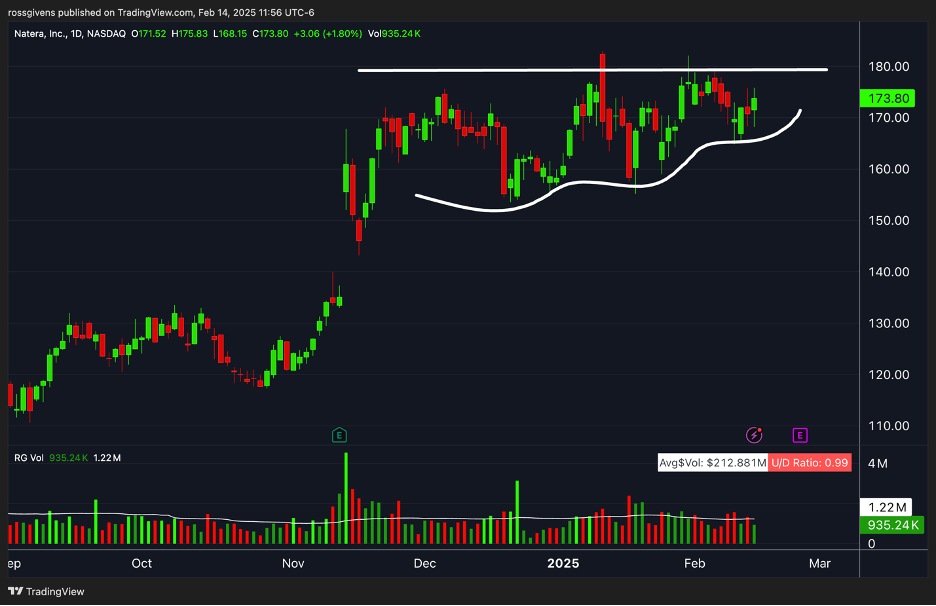
One stock I am keeping an eye on is Natera (NTRA) – a medical technology company that specializes in non-invasive prenatal genetic testing.

Look at the setup on the daily chart below…

A move above $180 could trigger the next leg higher.

I will consider buying this stock if it can get above $180. Thanks to how tight the consolidation has become, I don’t need to risk a lot of money on it either.

My stop loss would be at $164.50 for a risk of just 8% on the trade.

Best wishes for your trading,

Weekly Update: Markets Pump into Inauguration Day

Good evening, and welcome to this week’s edition of Stealth Trades!

Stocks had a strong week with the S&P 500 gaining more than 3%.

Markets are rising on fresh optimism surrounding President Trump’s inauguration on Monday which many believe could lead to a new golden age in the stock market.

Never has there been a more pro-jobs, anti-regulation President. Trump wants to aggressively cut government waste and spending, lower personal and corporate taxes, remove the red tape and unnecessary bureaucracy, open our oil and gas reserves for new exploration, enact tariffs to encourage fair trade deals with other nations, and make it quicker and easier to start new businesses in America

Love him or hate him, there is no denying that Donald Trump is good for the economy.

I expect to see a flurry of executive orders coming out next week. Many of these will have huge impacts on specific companies and sectors and will likely lead to significant moves in a number of equities.

This is when you want to be paying attention.

Institutions will also be positioning themselves as news comes out. They spend tens of millions to analyze the impact new government policies will have on various businesses. And I expect to see them quickly deploy capital to take advantage of these opportunities.

Watch what stocks and sectors lead in the coming weeks. This will tell you where money is flowing, and which areas are likely to lead the market during Trump’s first 100 days.

The leading subsector over the past month has been energy which is unsurprising given Trump’s known “drill baby drill” stance on American energy.

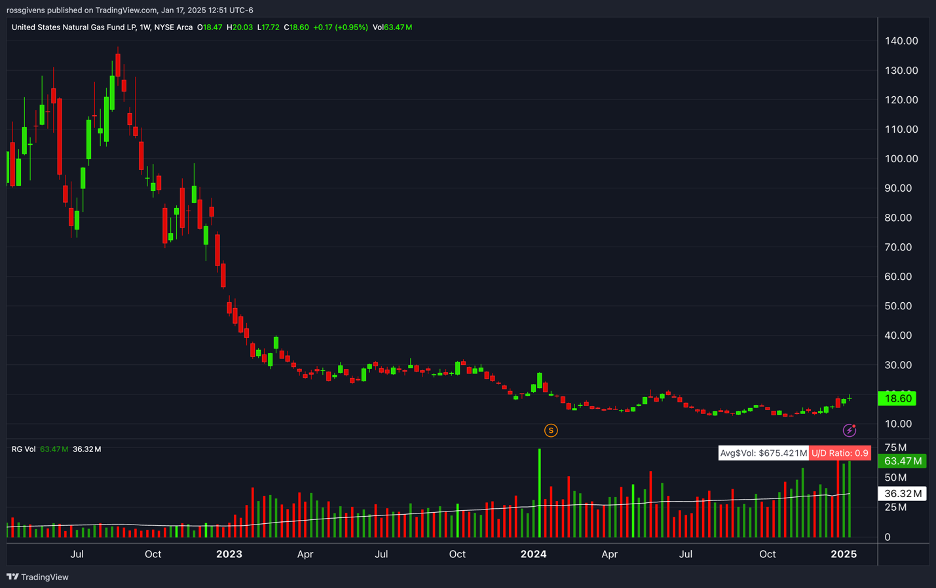
Natural gas prices, which are down 85% from their 2022 highs, are now beginning to rise.

The United States Natural Gas Fund (UNG) is up 43% since December and climbing.

Nuclear stocks like SMR, NNE and OKLO are also holding their ground. A lot of smart people have Trump’s ear. These people know that nuclear is the only viable long-term solution for our energy problem. So, if the President takes decisive action toward a nuclear future, these stocks could easily double or triple again.

I will be keeping a close eye on the markets in the coming week. The major exchanges are closed Monday in observance of Martin Luther King Jr Day, but be prepared for a wild Tuesday.

Best wishes for your trading,
Weekly Update: Bitcoin Looking Bearish

Good evening, and welcome to this week’s edition of Stealth Trades!

Bitcoin showed a lot of strength at the end of last year. 

The cryptocurrency doubled between September and December on the back of President Trump’s newly adopted pro-crypto stance.

But the momentum has run out. And to me, it looks like it is about to roll over…

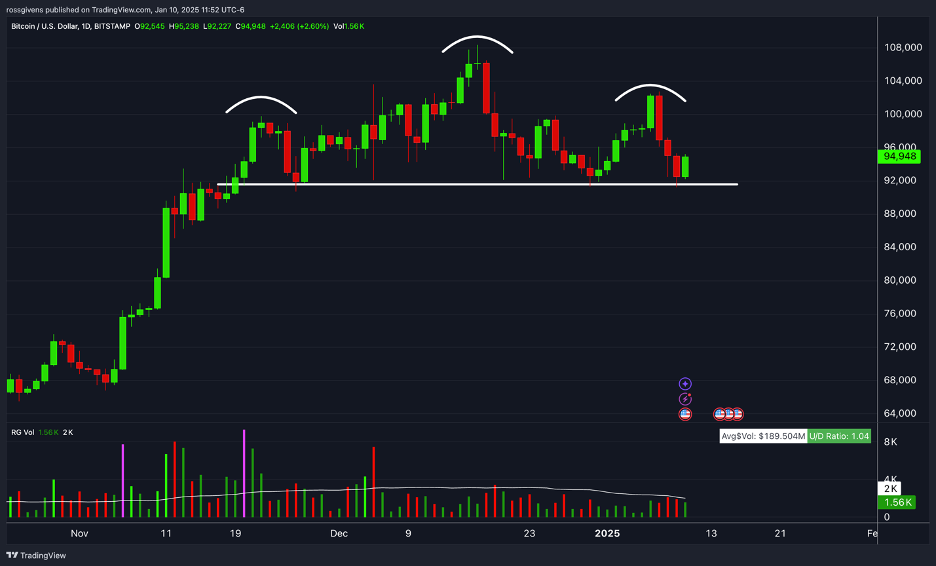
Above is a daily chart of Bitcoin. Notice the clear head and shoulders pattern that has formed over the last five weeks.

The white arches on the chart mark the head (middle) and shoulders (outsides) of the pattern.

The white horizontal line is the “neckline.” Typically, when price breaks below this level… look out below.

I believe the BTC pump was based largely on hopes of Trump building a federal strategic Bitcoin reserve. This would mean massive buying with federal dollars that is all but guaranteed to push the price higher.

I’m not one to count Trump out. But this seems like a lesser pet project or off-the-cuff interview remark more than a thought-out plan.

Trump has a lot to get accomplished in D.C. I don’t see this being something to waste political capital on – especially with so much focus on DOGE and efforts to cut government spending. This would be a move in the opposite direction.

Anything could happen, of course. But this looks like a short-term top in Bitcoin to me.

Best wishes for your trading,