Weekly Update: 5 Ugly Charts

Good evening, and welcome to this week’s edition of Stealth Trades!
I do not want to be the bearer of bad news.
I am an optimist by nature. I want to be bullish on the stock market whenever possible.
But right now, it’s not pretty.
There are 5 charts I look at to assess the health of the stock market. And right now, all of them look bad.
The net new highs/lows chart below shows how many stocks across a given index are making new highs vs new lows for the day. If the net number is positive, more names are making new highs which is typically reflective of a healthy market.
But right now, that is not the case.
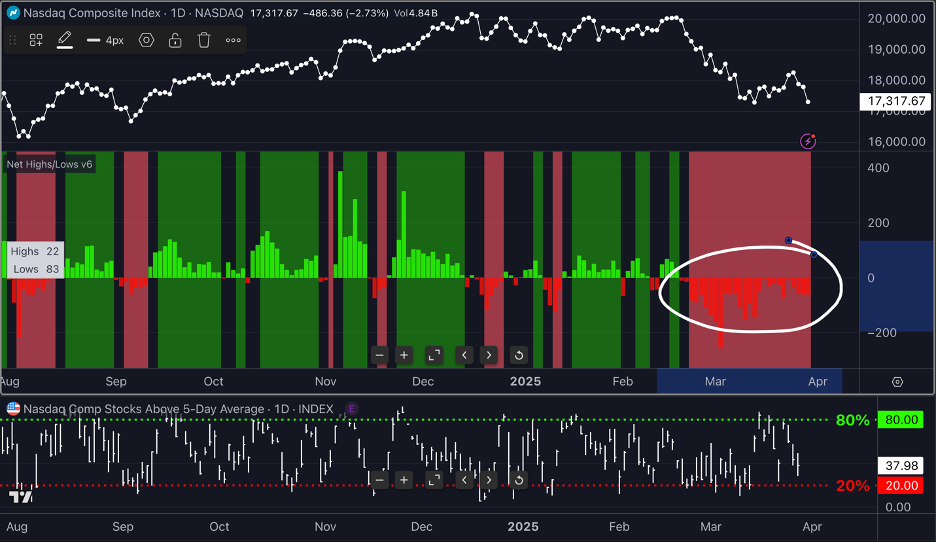
For the last 27 trading days in a row, this metric has been negative – a clear sign of an unhealthy market and steady selling on Wall Street.
I also like to keep an eye on the NFCI reading. This indicator, which I detailed in last week’s email, reflects the liquidity of the market. A declining reading indicates loosening financial conditions and a rising one shows tightening.
Released once a week by the Chicago Fed, this number was unchanged this week. As can be seen in the blue line below, the National Financial Conditions Index continues to reflect a poor environment for equities.

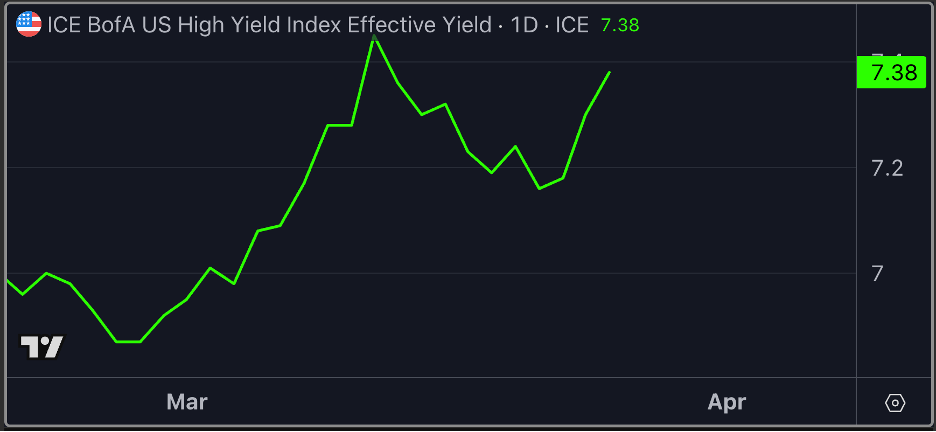
The high yield index is another thing I like to keep an eye on. Unlike traditional interest rate yields, this index reflects risk as well. This is the rate typically charged to less secure firms where lenders are not guaranteed a return of their capital.
And as you can see, it continues to climb higher…
The put/call ratio is not delivering any hope either. Consistently high readings mean investors are increasingly bearish and buying put options at a higher-than-usual rate compared to calls.
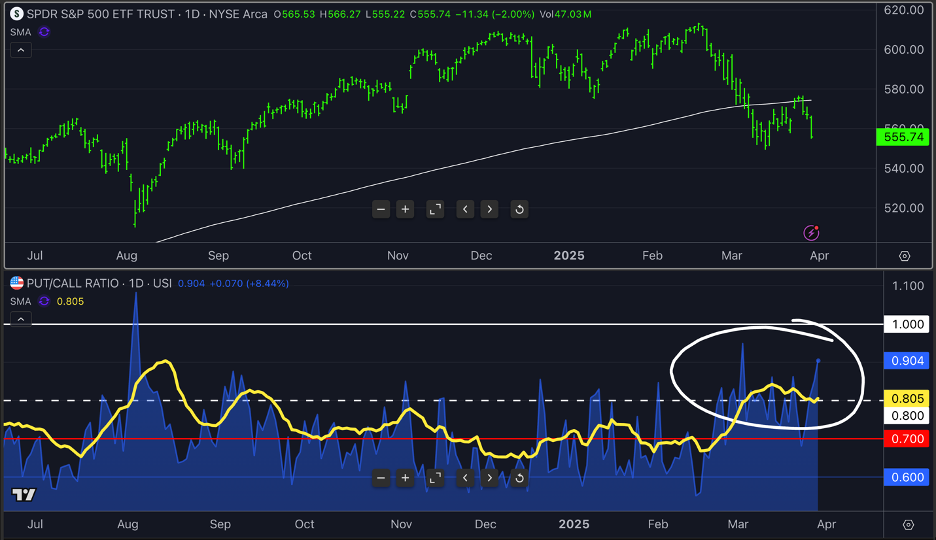
While a short-term spike in the P/C ratio can indicate a potential turning point, steadily higher readings show broad bearish sentiment.
And finally, there’s the stock market itself. The chart of the Nasdaq index ETF below shows the rapid February selloff.
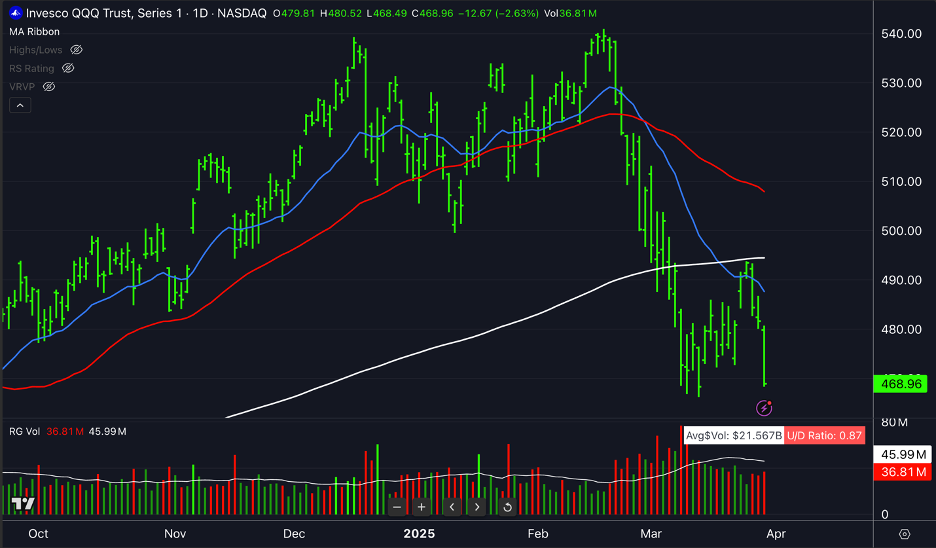
While it appeared that we could be finding a bottom, stocks collapsed this week to finish Friday with a nasty 2.8% decline.
Periods like this are unavoidable. Dips, pullbacks and bear markets are part of the game. I have no doubt that prices will be higher 6, 12 and 18 months from now.
But as traders, we must recognize when conditions are favorable and when they are not. And right now, they’re just not.
In my long-term account, I am 65% invested in cash. The other 35% is a mix of stocks and a few commodity ETFs holding gold (GLD), silver (SLV), copper (CPER) and natural gas (UNG).
As soon as conditions improve, I will quickly and aggressively move more into stocks and buy at these reduced prices. But until then, I will remain conservatively positioned.
Best wishes for your trading,
