Weekly Update: Nuclear Stock Poised to Breakout

Good evening, and welcome to this week’s edition of Stealth Trades!

I apologize for not getting this update out on Friday like usual. I took my kids to Disney World for a short vacation and did not get back until late Sunday night.

It was an exhausting three days of humid mid-90-degree heat. But the kids loved it. Especially my daughter, Georgia, who got the full princess treatment (see below).

But while I was gone, nuclear stocks continued their dominance.

As of today, the nuclear sector is the top performer over the last 1, 2, 3 and 6-month periods. Its leadership in this market could not be clearer.

And while the entire market made a strong move off the April lows, this area is red hot.

Here’s what the top names in the space have done over that period.

I have 25% of my retirement account allocated to NLR – the VanEck Uranium and Nuclear ETF.

Buying leading groups in the early stages of a bull market is one of the most consistent strategies for delivering big long-term gains. I also have a large chunk in QTUM which is the quantum computing ETF.

Nuclear is an exciting sector. Up until two years ago, these stocks had been dormant for more than two decades.

But investors are starting to see the writing on the wall…

America has an energy crisis that, so far, has not been solved. Solar, wind, and other alternative sources have been tried, but none delivered any real results.

Nuclear, however, is clean, renewable, and safe. It could deliver endless power through both large power stations and also small modular reactors.

Given the big outperformance over the last two months, a lot of the top stocks in this group are fairly extended. They could keep running, but they are also at risk of a steep pullback.

But one name looks primed…

Below is a chart of Nano Nuclear Energy, ticker symbol NNE.
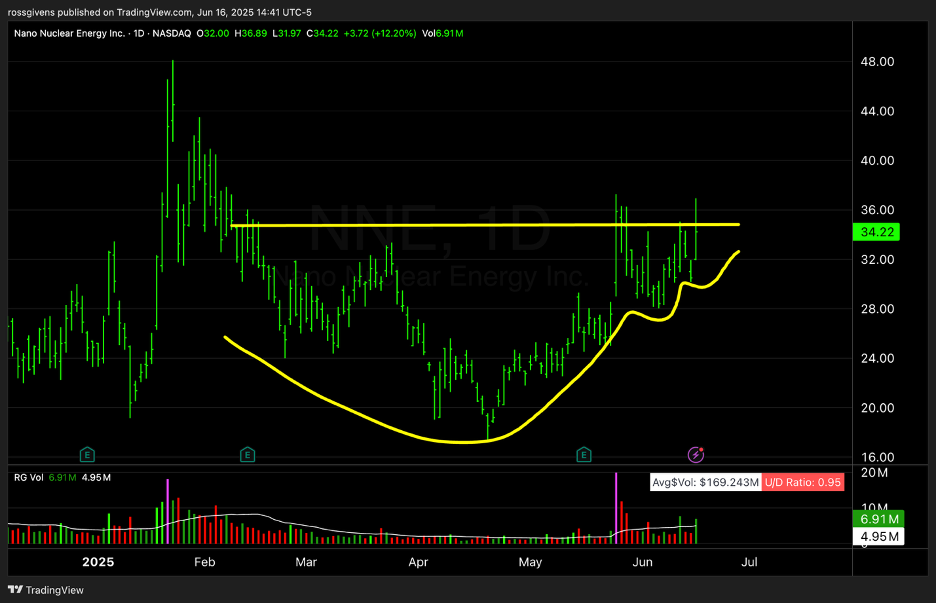
I have drawn in yellow the shallowing base breakout structure. Notice how pullbacks have shallowed from left to right – each dropping less than the one before.

This is a sign that supply is being absorbed, and the stock is becoming harder to buy which is exactly what we look for in a breakout move.

NNE is pushing through the $34 resistance area on high volume, and if history is any indication, should push to new highs soon.

We saw a similar setup in NNE last year that delivered a 181% gain over the next three months (see image below).
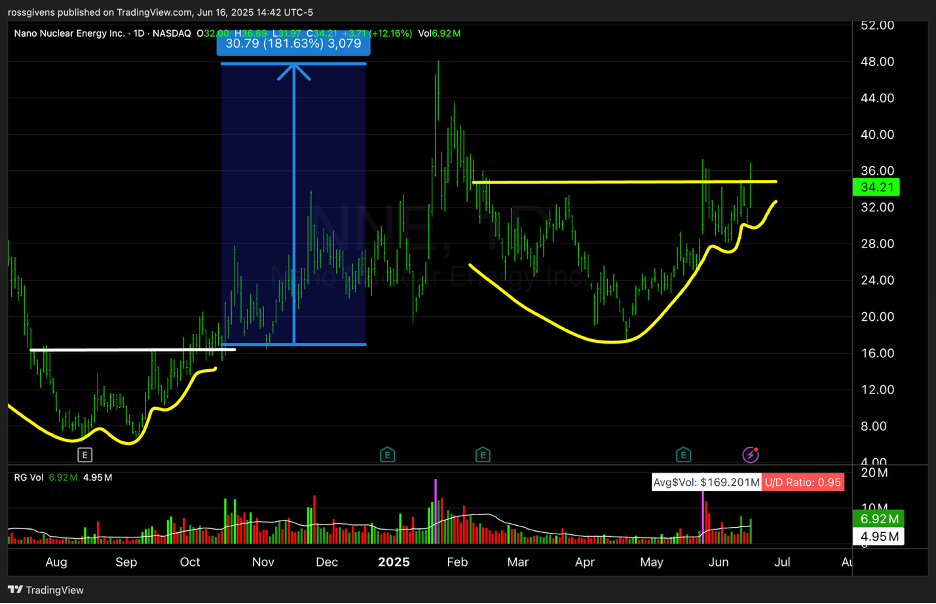
And while there are no guarantees that this will happen again, breakout trades in leading groups at the early stages of a bull market are something I will never pass up.

Best wishes for your trading,

Weekly Update: This Market Signal Says “BUY”

Good evening, and welcome to this week’s edition of Stealth Trades!

The average investor would have you believe that it is impossible to time the market.

But the average investor is wrong.

Bull and bear markets do not appear out of thin air. There are underlying conditions found in almost every market cycle that, when interpreted properly, allow one to enter near the lows and sell long before things fall apart.

In my March 28 weekly email titled “5 Ugly Charts,” I showcased five of the tools I use to time the market. At the time, they were all bearish.

Two weeks later, these same signals said it was time to buy. So, on April 11th, I sent this:

We are now back within spitting distance of new all-time highs. And if you took my advice, it has been a very profitable two months.

But there is another signal I did not share with you in March – one that allows us to look “beneath the surface” and see how strong or weak the market is.

That signal is the ADVANCE/DECLINE LINE.

The advance/decline line is quite simple. Each day, it counts the number of stocks that went up and down on a given exchange. The net reading is positive if more stocks advanced and negative if more declined.

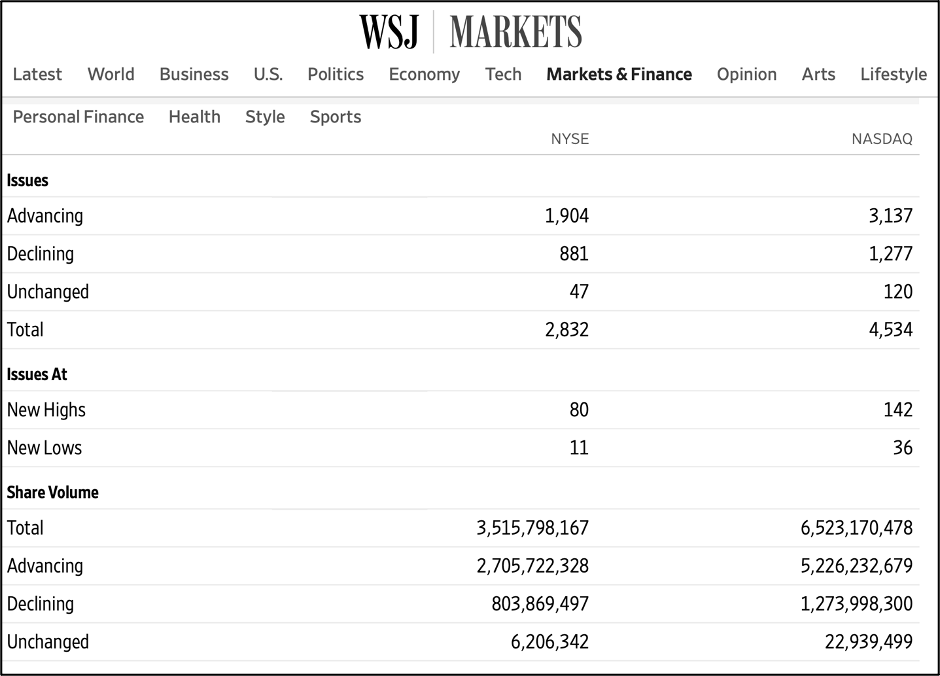
These figures are also published daily on the Wall Street Journal website.

Each day, that reading is added to the previous total, and the result is the advance/decline line.

The goal of this indicator is to show whether we are in a healthy environment where more stocks are rising or an unhealthy one where more names are going down.

And while this may fluctuate a bit day-to-day, a healthy bull market will see a rising advance/decline line. The opposite will be found in bear markets.

So, how can you use this to time the market? 

Simple… look for times when it diverges from the index. I’ll show you what I mean.

This is late 2007 – just before the 2008 financial crisis unfolded:

The blue line on top is the S&P 500 index, and the advance/decline line is shown beneath in yellow.

Notice how, in the second half of the year, the stock market was making new all-time highs. This, to the average investor, meant the market was healthy.

But it wasn’t healthy. And the A/D line’s failure to follow suit showed that. A handful of large stocks like Amazon, Apple and Google were carrying the indexes higher – even though most stocks were not back at their highs.

This was your warning sign that things were weak beneath the surface. And if you spotted it, you could have avoided a 40% market decline.

The same thing happened before the 2022 bear market…

Notice how the market was rallying at the end of 2021, but the advance/decline line was not making any progress.

This was a big red flag, and the market tanked the following year.

To me, this is one of the best signals that a bull market has run out of steam.

Luckily, the opposite is also true. When the A/D line is making new highs before the stock market, good things are likely on the horizon.

Following the COVID crash in 2020, this indicator was making new highs several months before the stock market.

This was a signal that the rally was broad-based and strong and likely to continue.

The ensuing bull market of 2020 and 2021 was one of the most powerful on record. In fact, you will see this same trend of the A/D line moving before the market in almost every stock rally.

And that is exactly what we are seeing today.

Following Trump’s tariff-fueled trade war earlier this year, this indicator once again rebounded well ahead of the overall market.

The advance/decline line was making new highs just three weeks after the market bottomed.

That was a very powerful recovery, and stocks have continued to push higher ever since.

Add this tool to your bag. It is a free indicator on TradingView and almost every trading platform.

You’ll be surprised how often it gets you out near the top of the market and back in early off the lows.

Best wishes for your trading,

Weekly Update: 3 Sectors Leading the Market

Good evening, and welcome to this week’s edition of Stealth Trades!

I talk a lot about finding the “theme” of the market.

That’s because it’s the most important part of the equation.

All the chart patterns in the world won’t help you if you’re focusing on the wrong stocks.  

The market is up 100% from the 2022 bear market lows. But if you bought solar stocks, you are instead down 64%. Investing in real estate stocks would have also delivered a loss.

Esports, on the other hand, is up 152%. Crypto stocks have surged over 200%. So even if your timing is off, you will likely do better focusing on the right group.

Right now, there are 3 groups leading this bull market: nuclear, AI and quantum computing.

Nuclear stocks went hyperbolic last week after President Trump announced plans to sign an executive order fast-tracking nuclear development.

Top names in this group – Cameco (CCJ), NuScale Power (SMR), Nano Nuclear Energy (NNE) and Oklo (OKLO) – are all extended. Once they consolidate a bit, however, I will be actively looking for fresh entries to get back in.

Artificial intelligence is another area that continues to outperform.

Nvidia led the pack in the last cycle, but at a market cap of $3.4 trillion, this one is a bit long in the tooth. You won’t be seeing another 100%+ run from this stock any time soon.

Instead, I am watching stocks like C3.ai (AI), IonQ (IONQ), Zscaler (ZS) and Palantir (PLTR) that are demonstrating above average momentum.

Arguably the hottest sector right now is quantum computing. I used last week’s email to highlight this group, and I believe we will see huge opportunities here in 2025.

As of today, there are only about 5 stocks in this sector – 6 if you count IONQ which rides the line between quantum computing and AI.

D-Wave Quantum (QBTS) is the largest and so far, the leader in this space. Other top names are Quantum Computing (QUBT), Rigetti Computing (RGTI) and Arqit Quantum (ARQQ).

Right now, this is where I am focused. I won’t pass up good setups in other sectors, but these three areas are at the center of my attention.

I remain bullish on gold, gaming, defense and a few other areas. But in my opinion, it is nuclear, AI and quantum computing that will deliver the biggest gains of this bull market.

Best wishes for your trading,

Weekly Update: These Stocks Are SOARING!

Good evening, and welcome to this week’s edition of Stealth Trades!

Want to make big money in the stock market?

There are three things you need:

1. Strong market

2. Strong sector

3. Strong stock

The first one is obvious. A bull market puts the wind at your back. “A rising tide lifts all ships.”

You can make money in bear markets, but it is a heck of a lot easier when everything is going up.

Next, you want to focus on the strongest sectors. Institutions tend to invest around a theme. If they are bullish on solar, they buy a dozen of the top solar stocks. If it’s AI they are loading up on Nvidia, Super Micro Computer and AMD.

Wherever they are putting their capital, that area of the market is going to rise faster than the rest. So, keep an eye on which areas are outperforming over the last 1-, 2- and 3-month periods.

Once you’ve homed in on a hot sector, finding the top stocks is easy. Most sectors have a few dozen stocks at most. You can quickly flip through the charts to find the strongest candidates.

Right now, the crypto space is red hot. Money is flooding into mining stocks and crypto brokers like Robinhood.

We are also seeing nuclear as a clear outperformer.

But over the last two weeks, another sector has come ripping higher. That sector is quantum computing.

I’ll be honest – I don’t even understand what a lot of these companies do. My brother is a software engineer, and even he can’t explain it to me.

But Wall Street is getting aggressive in a hurry…

IONQ is up 160% since March.

QBTS is up 180% in two weeks! There was a textbook breakout buy on May 8 then another opportunity coming out of a high tight flag on May 15 (see below).

I missed them both 🙁

Luckily, we did get our Alpha Stocks members into QUBT…

They are sitting on a 55% gain in just over two weeks.

Right now, a lot of these stocks are extended. I would love to see them pull back or at least pause for a bit to digest the recent moves.

But this is an area I suggest keeping a very close eye on.

When there is a strong bull market like we have today and a sector seeing huge moves on a big uptick in volume, I am willing to be a bit “looser” with my entries.

If it is not a perfect breakout pattern or precise pullback to support, don’t be afraid to lean into these stocks while the momentum is strong.

Here are six stocks I am watching: QBTS, QUBT, QMCO, RGTI, IONQ, and ARQQ.

Other companies like IBM and Alphabet are developing quantum computers, but these are the best pure plays I have found so far.

Best wishes for your trading,
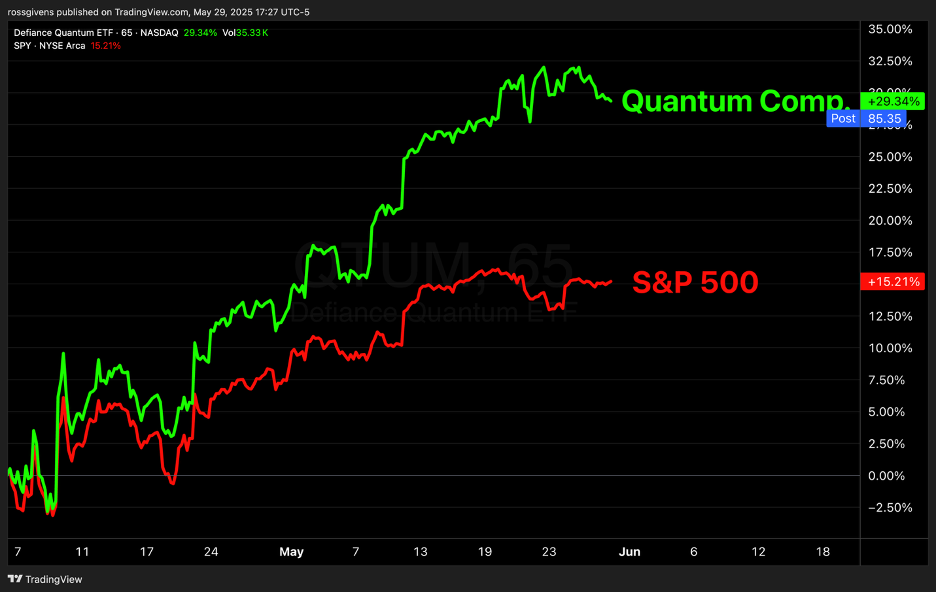
Weekly Update: The Stocks Leading the Market

Good evening, and welcome to this week’s edition of Stealth Trades!

Market leaders. Every bull market cycle has them. These are the top stocks being bought heavily and steadily by institutional investors.

Every bull market of the past three decades has had a theme to it. And within that theme are 5-10 stocks that lead the market.

In the late 90’s it was the Dot-Com boom when names like Yahoo and Cisco soared.

In the 2010s it was big tech and the FANG stocks that became household names.

In 2020 and 2021 the theme was Work-From-Home. Stocks like Peloton, Zoom and Teladoc skyrocketed when people could no longer go to the gym or doctor’s office.

And the 2023-2024 bull market was no doubt focused on AI. Nvidia was the clear market leader along with SuperMicro and others.

Following a vicious 2-month bear market following Trump’s international trade war, we are in the early stages of another bull market. And it is crucial that we identify leadership early and do our best to get positioned quickly.

There is no hard formula for identifying market leaders, but they have several things in common…

First, they will be “institutional grade” stocks. This means a market cap of at least $10 billion and typically a high share price.

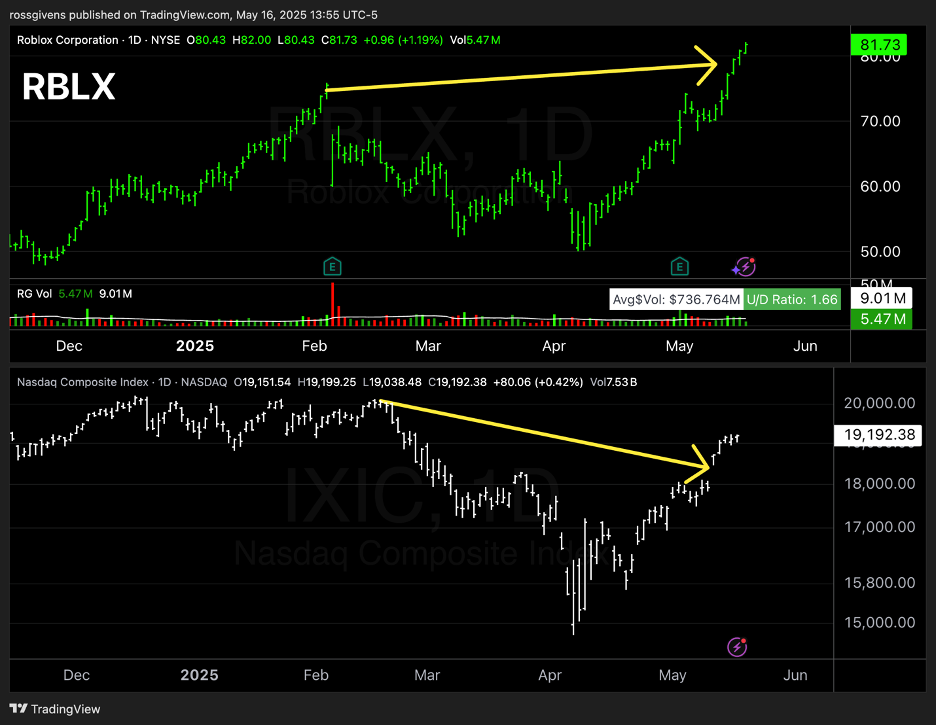
These stocks will also be the first ones to make new highs – long before the indexes fully recover. 

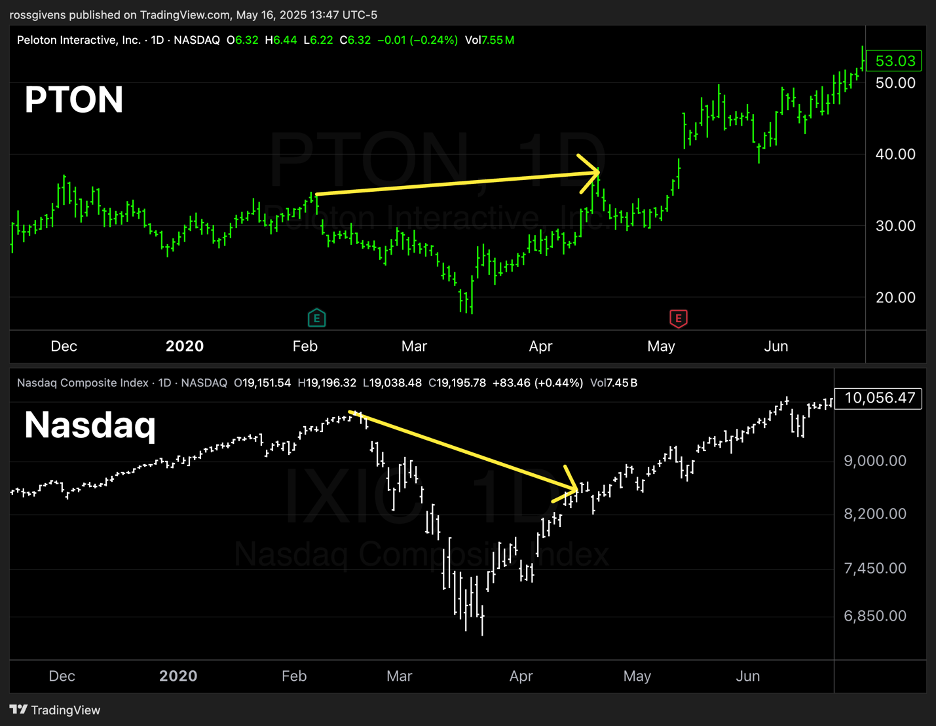
Notice how Peloton (PTON) ripped off the lows after the 2020 COVID crash:

It made new all-time highs months before the rest of the market caught up. PTON went on to run another 336% over the next six months.

It was the same with Nvidia in 2022. The stock made new highs in January – a full four months before the Nasdaq index was back to its previous levels.

NVDA gained more than 1,000% over the next two years.

Identifying market leadership early and hitching your wagon to these stocks is one of the best ways to outperform the market.

So, what stocks are leading today?

My current list is 8 stocks. These could change, so don’t send me hate mail in a year if one of these does not perform. But all 8 of these stocks are showing clear signs of leadership.

Spotify (SPOT)

As you can see in the chart above, Spotify is already pressing against new highs. It is also forming a nice consolidation pattern and looks ripe for another move higher.

Roblox (RBLX)

Roblox is up over 60% in the last six weeks. It is making new highs before most other large-cap names.

RBLX is also a young company. It has only been publicly traded since 2021. And all things being equal, recent IPOs should always be favored over older stocks.

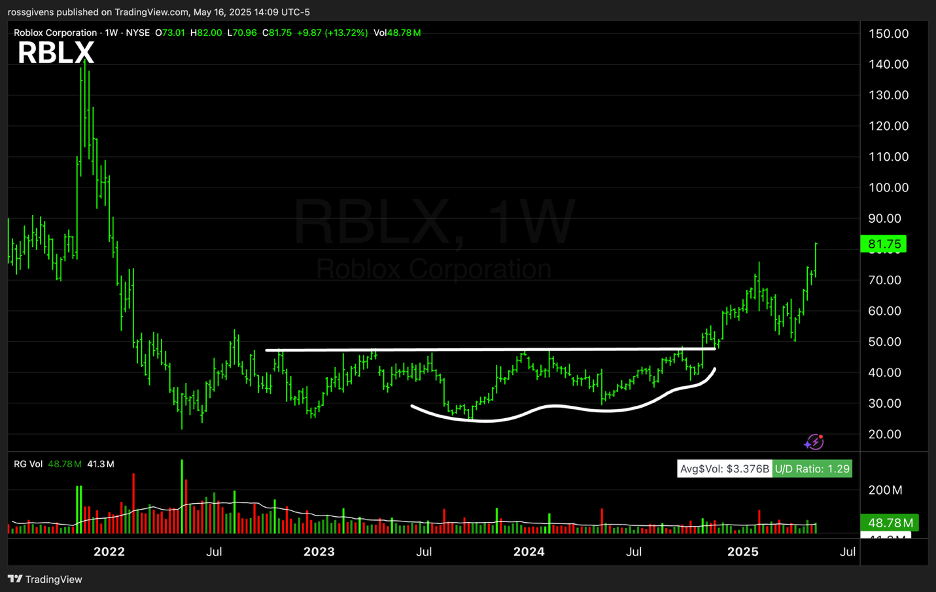
It is also in the early phase of its first Stage 2 breakout (see weekly chart below).

If you’ve been to one of the live sessions I hold Monday mornings, you know how profitable this window can be. The trade war was just a blip on the radar for this stock, and I wouldn’t be surprised to see it double from here.

Rubrik (RBRK)

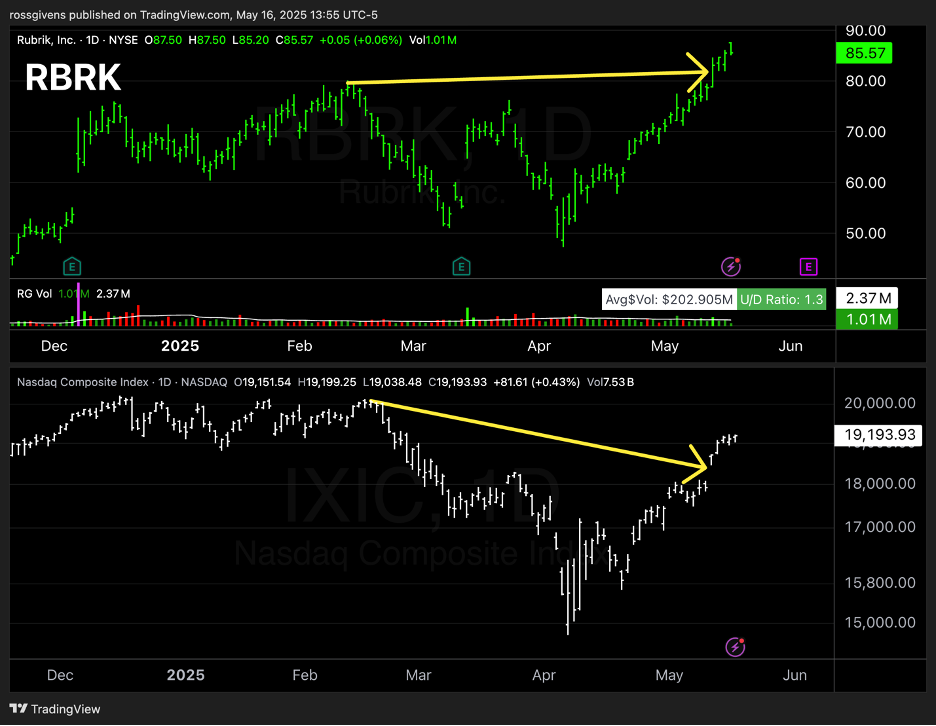
Rubrik is another young player and one you may have never heard of. That’s a good thing and exactly when you want to be buying.

This cybersecurity company went public a year ago and has been on a tear ever since.

It is up 78% in a month and a half. Volume is increasing. And it made new all-time highs on each of the last four trading days.

Don’t sleep on this one. It has all the signs of a top performer.

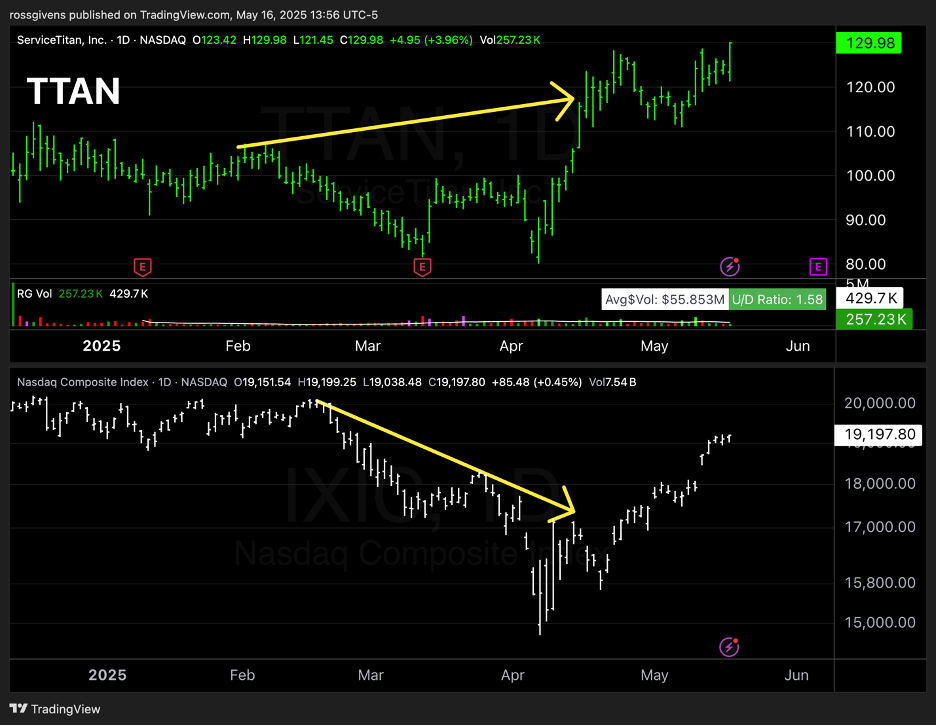
ServiceTitan (TTAN)

Everything I said about Rubrik can also be said about this stock.

Young IPO… big momentum… little-known name… ripping to new highs early…

Many market leaders were not household names when they started their big moves. No one knew anything about SuperMicro Computers, Teladoc, or Monster Beverage when they started moving. But that didn’t stop them from climbing thousands of percent each.

TTAN was making new highs at the same time the market was making new lows! The last stocks I saw do that were Peloton and Zoom in 2020 (both market leaders of that cycle).

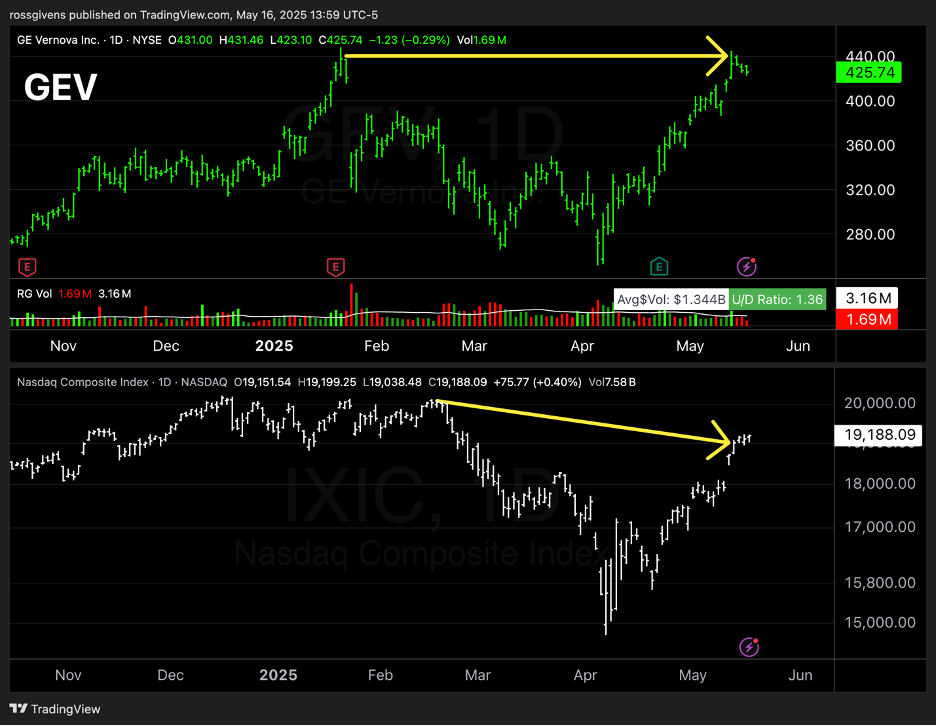
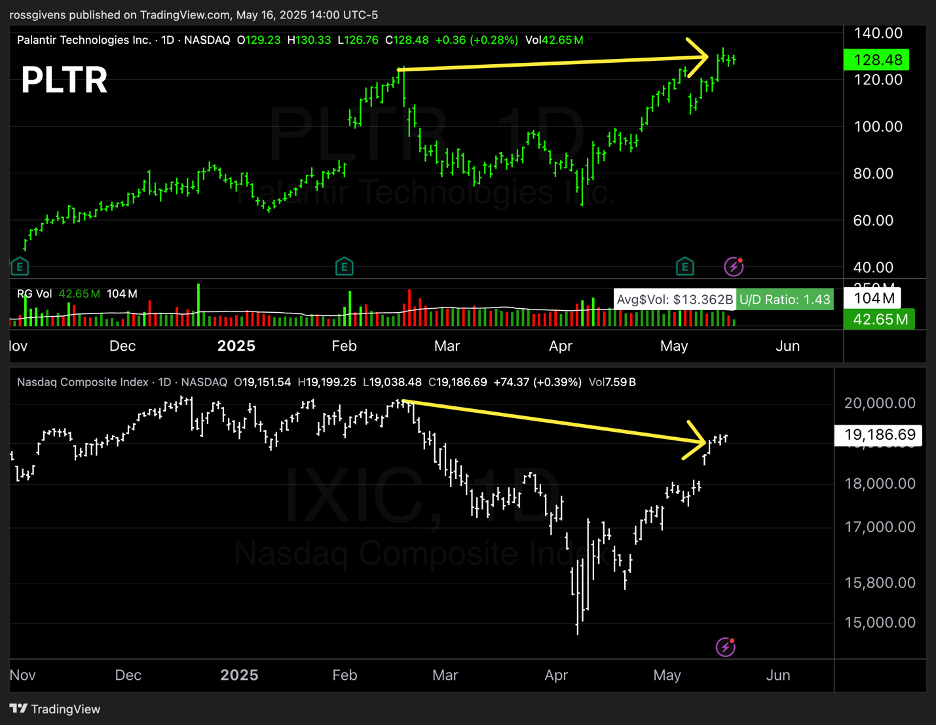
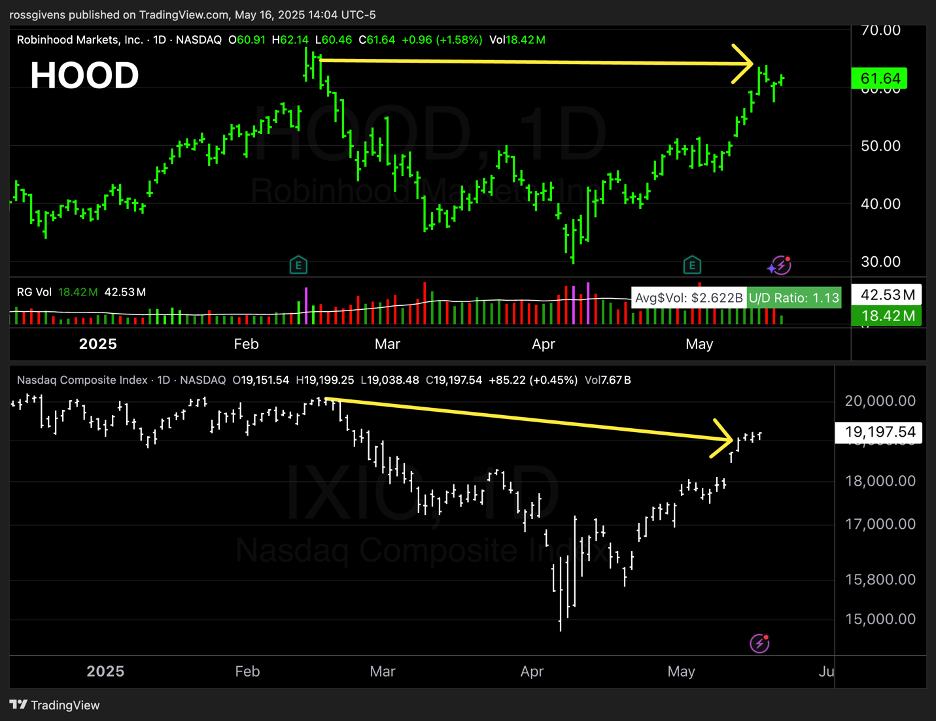
A few other leaders emerging are GE Vernova (GEV), Palantir (PLTR), Robinhood (HOOD) and Bitcoin (IBIT).

For the sake of not turning an email into an essay, I will simply include charts of each below.

Don’t feel the need to chase these potential leaders. I am not telling you to blindly buy all 8 on Monday (although you’d probably still outperform the market that way).

What I want to see are clean setups in these stocks – either breakout patterns or controlled pullbacks – and then to hold them as long as possible.

True market leaders will offer several buying opportunities throughout their run. My goal is to add in at each of these points – building larger and larger positions in the best-performing stocks.

Imagine having a big chunk of your account in Nivida over the last two years. Even a 10% allocation would have doubled your entire account!

This is how the big money is made. Focus on the leaders, wait patiently for good entry points, then go in with conviction.

It is easier said than done. But get it right, and the rewards can be astronomical.

Best wishes for your trading,

Weekly Update: How I’m Playing Bitcoin

Good evening, and welcome to this week’s edition of Stealth Trades!

With the stock market marching steadily higher, we are clearly in a “risk on” environment.

Every time this happens, Bitcoin soars. It is the ultimate risk asset.

Despite being marketed as a currency and market hedge, it has repeatedly failed those tests. No one uses it to buy things, and it gets annihilated in bear markets.

But in bull markets… it comes roaring back.

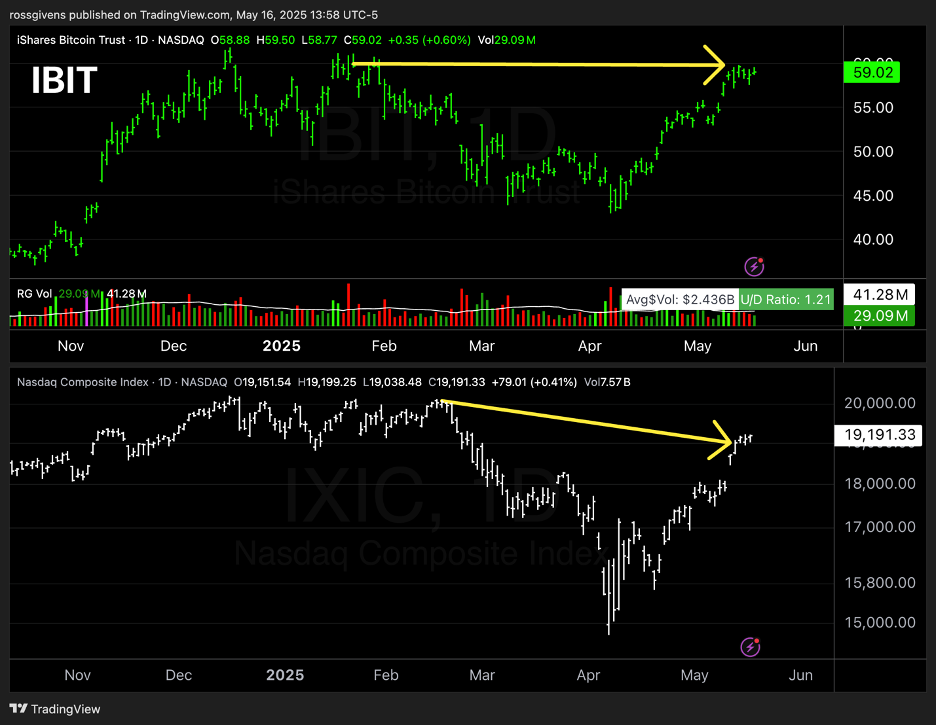
The chart above shows Bitcoin against the Nasdaq over the last market cycle.

I have made clear for the last four weeks that I thought the low was in for stocks and this was the time to buy.

Bitcoin is further evidence of that. It is up 36% and climbing since the April lows.

One of the great things about Bitcoin, at least from a trading standpoint, is that it moves purely on supply and demand. There are no surprise earnings announcements or CEOs abruptly stepping down.

And because of this, it trades beautifully. It trends well and breakouts are easy to spot.

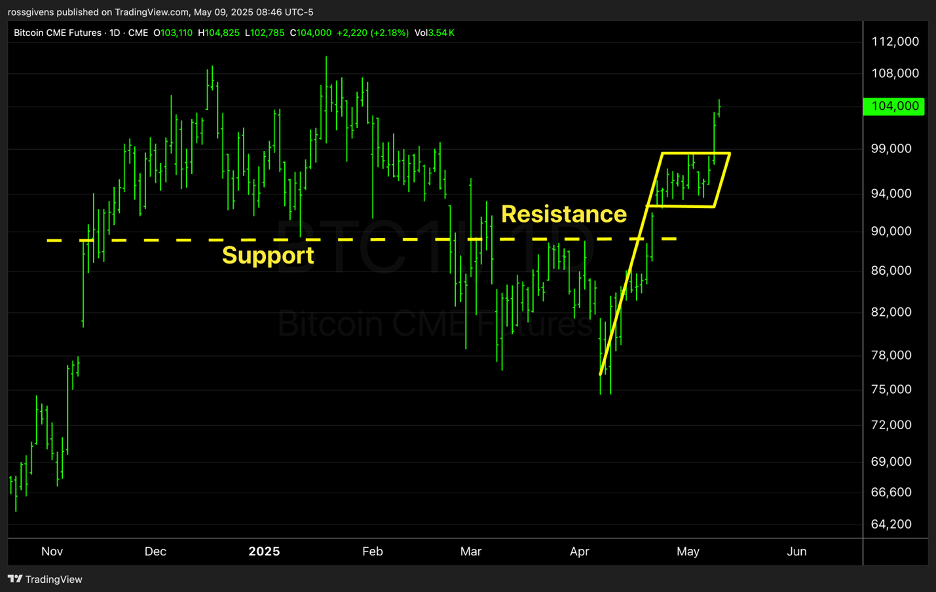
Last month, BTC broke through the $90k support and resistance level with force.

After a brief consolidation where it formed a bullish pendant, the cryptocurrency broke out again on Thursday breached the 100k level with ease.

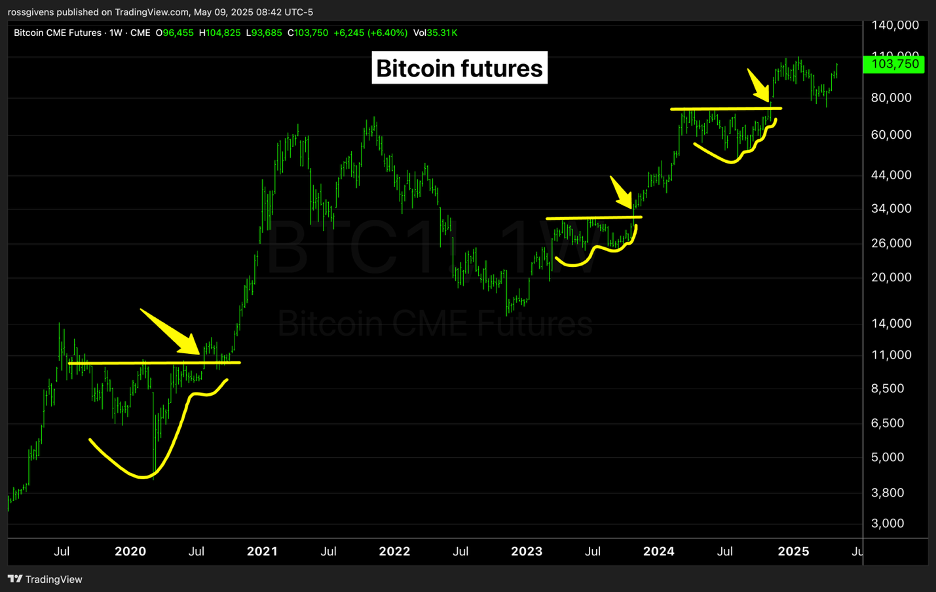
Based on its past price history, I expect to see bitcoin hit the $130k level.

The ideal setup would look something like this:

A stall at the 110k level would not be surprising. There is a lot of supply from late 2024 from buyers who bought the highs and have been underwater all year.

I would like to see this supply absorbed over 1-2 weeks to free Bitcoin up for a powerful move higher. In this scenario, the upside target would be more like $150k.

And there are multiple ways to play this move…

Outside of buying Bitcoin directly through a crypto broker like Coinbase, investors have the option of buying an ETF that holds bitcoin. ETFs (exchange trade funds) trade just like stocks and can be purchased in any brokerage account. The most common Bitcoin ETFs are IBIT, GBTC and ARKB.

Another way to potentially profit from the move is with Bitcoin mining stocks.

Just as gold miners profit from higher gold prices, these stocks do the same thing.

One I like right now is MARA.

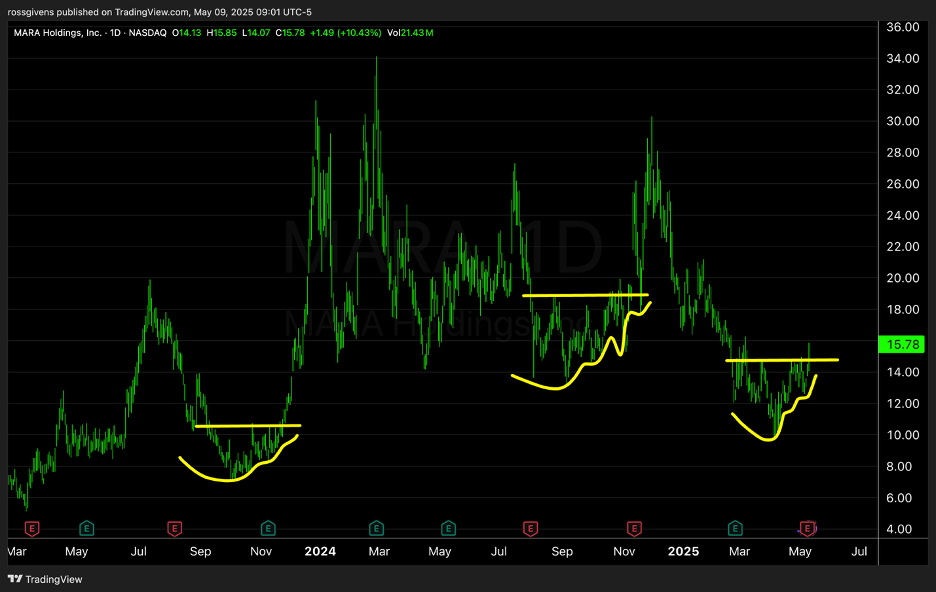
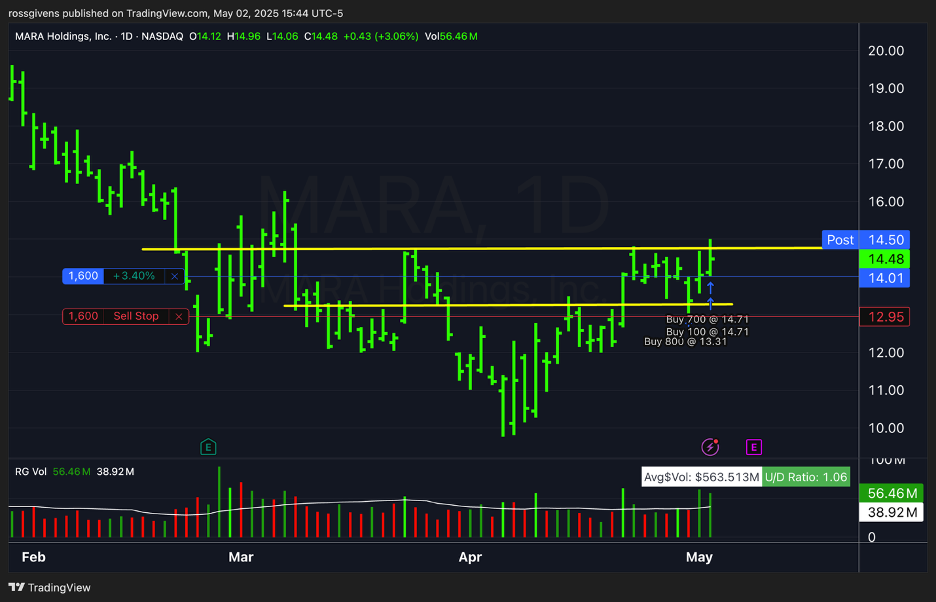
I bought shares yesterday and doubled down this morning on the breakout above $15.

MARA has a history of making big moves coming out of these consolidation patterns off the lows (see below).

We have a risk-on environment, Bitcoin in the early stages of a powerful move higher, and one of the leading Bitcoin mining stocks emerging from a low base.

What more could we ask for?

Investors also have the option of buying a stock like Coinbase (COIN). Even though Coinbase’s stock price is not directly tied to Bitcoin, they tend to do more business and see more volume during crypto bull markets.

I took a position in COIN this morning as well.

We spent a good amount of time watching for areas of strength in the market.

My analyst, Jean Fede, is especially sharp in the crypto space. He has forecast nearly every major move in Bitcoin over the last two years, and our members have profited handsomely off both events.

He alerted me to this move as well. Hopefully, it is equally fruitful.

Best wishes for your trading,

Weekly Update: Here’s What I’m Buying

Good evening, and welcome to this week’s edition of Stealth Trades!

These weekly updates allow me to share my views on the markets with you.

I do my best to let you know when I believe you should be conservative and when the stage is set for big gains.

For the last three weeks my message has been clear – it is time to be buying.

I hope you heeded my advice. As I covered in this week’s live webinars, I have been aggressively taking new positions as well.

This week I bought 7 stocks. 6 of them are profitable.

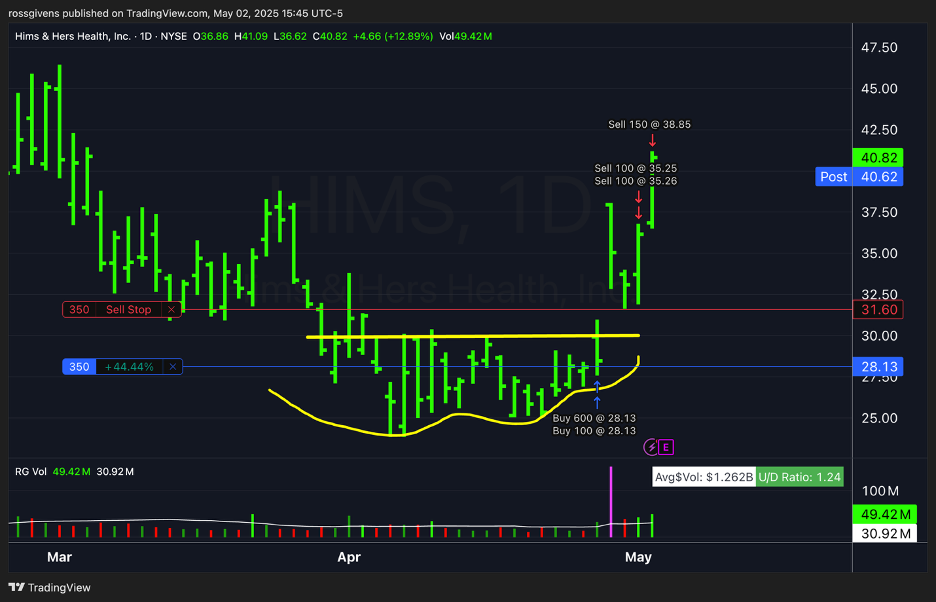
The big winner for me this week was HIMS. It is a stock a like with a very clear pattern that meets all of my rules.

I also got lucky…

The day after buying, the company reported a partnership with Novo Nordisk and the stock soared. I am up 44% since Monday.

I scaled out of half the position here at the highs for a solid gain. This way, I can hold through earnings on Monday without risking all of my profits.

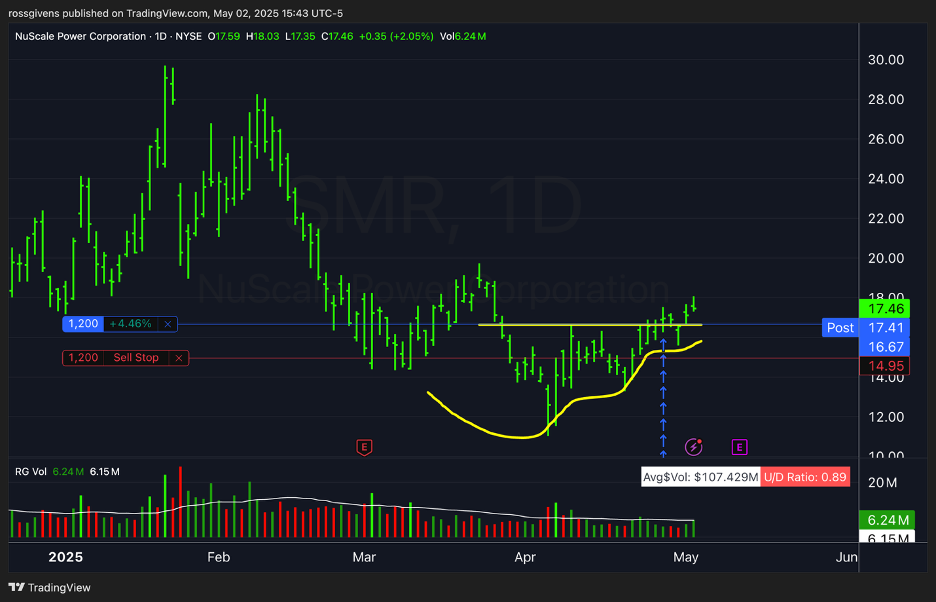
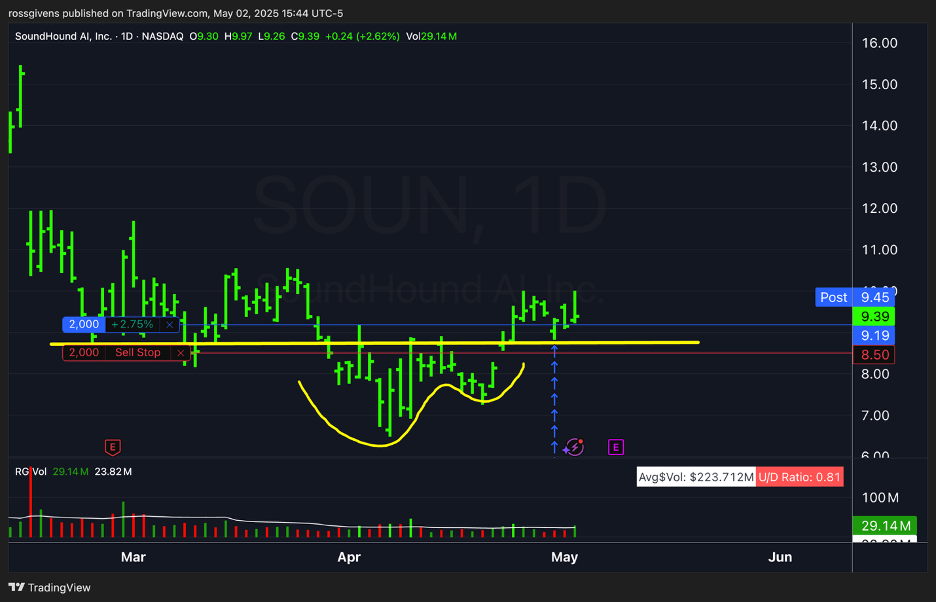
With the exception of SKWD which broke out beautifully on Friday, the other stocks have yet to make significant moves, but they are playing out well so far.

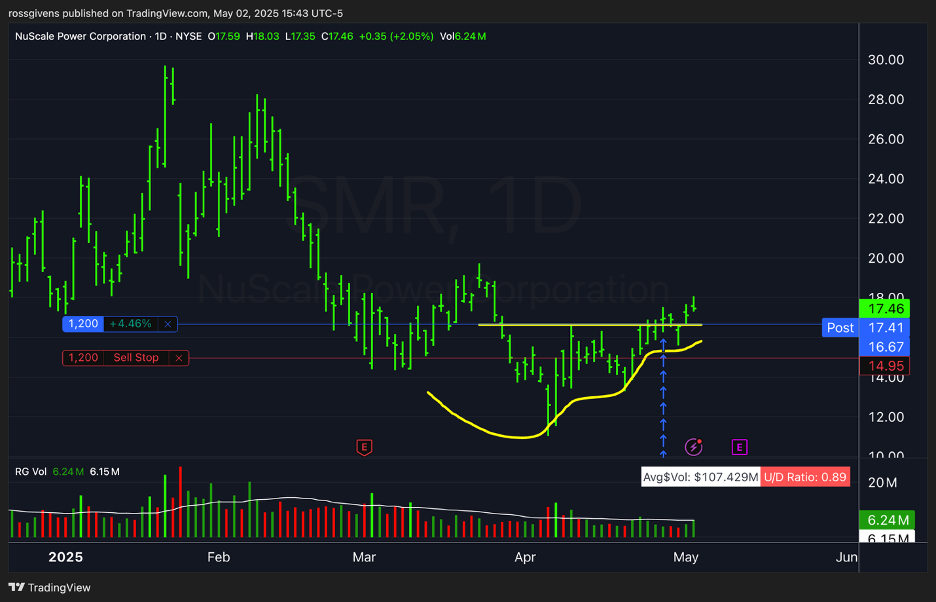
In the interest of transparency, I am including charts showing my trades from the week including entries, exits and stop losses.

These are not official recommendations. But I thought it might help to see how I like to enter with this style of trading.

We can discuss them further in Monday’s live training session at 9am ET. I’ll see you then.

Best wishes for your trading,

Weekly Update: Why I’m Bullish in 4 Charts

Good evening, and welcome to this week’s edition of Stealth Trades!

For two weeks I have been saying the low is in; that the bear market is over, and this is the time to buy.

Today I’m going to lay out my case with 4 charts.

These show conditions we typically see at the start of bull markets. And all of them are appearing right now.

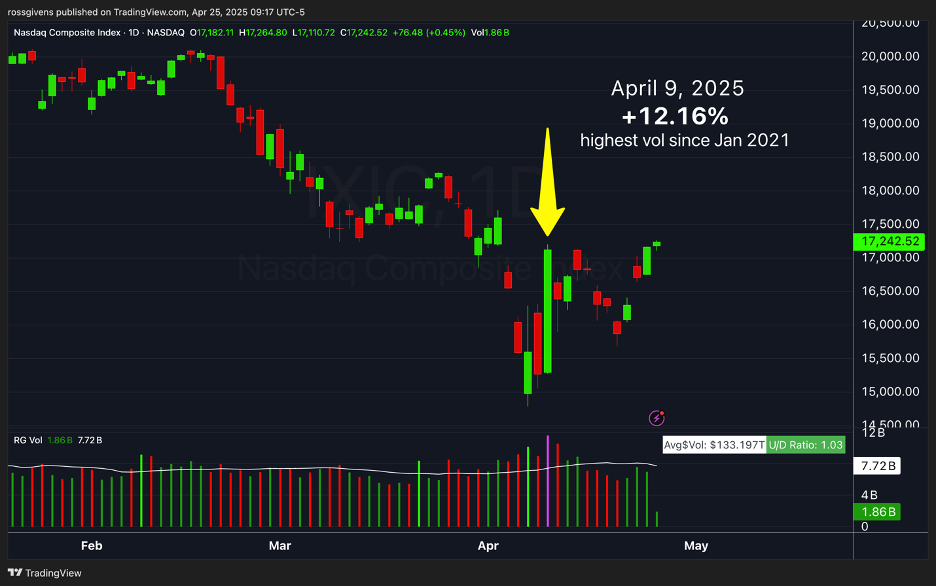
First, at the bottom of a bear market, this is generally a big up day on heavy volume with a close near the high of the day. It is a signal that institutions are piling back in heavily.

On April 9th, we got that signal…

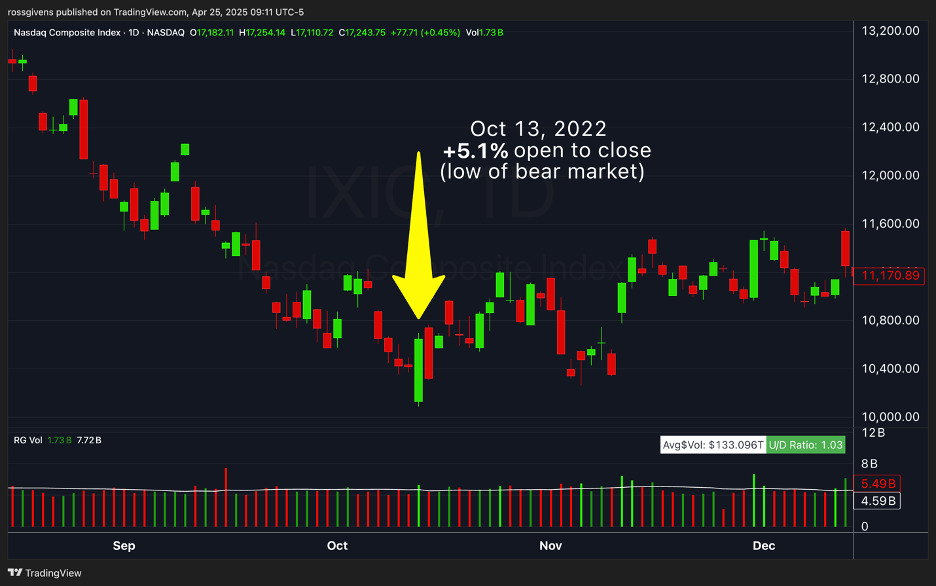
We saw similar price action at the low of the 2022 bear market, the 2020 post-COVID bear market, and the one in late 2018 (see below).

Second is the put/call ratio. The P/C ratio is a contraindicator.

You see, the average investor is not very good. They buy the top, and they sell the low. Their emotions make them sell at the worst possible time.

The put call ratio is a measure of this emotional buying and selling. When the reading gets above 1.0, it means speculators are betting big on stocks going down, and that is typically the best time to buy.

In the chart below, you will see the S&P 500 index on top of the Put/Call Ratio on bottom. Notice how spikes above 1.0 came within days of market lows.  

The April 7 reading of 1.18 is playing out just as expected.

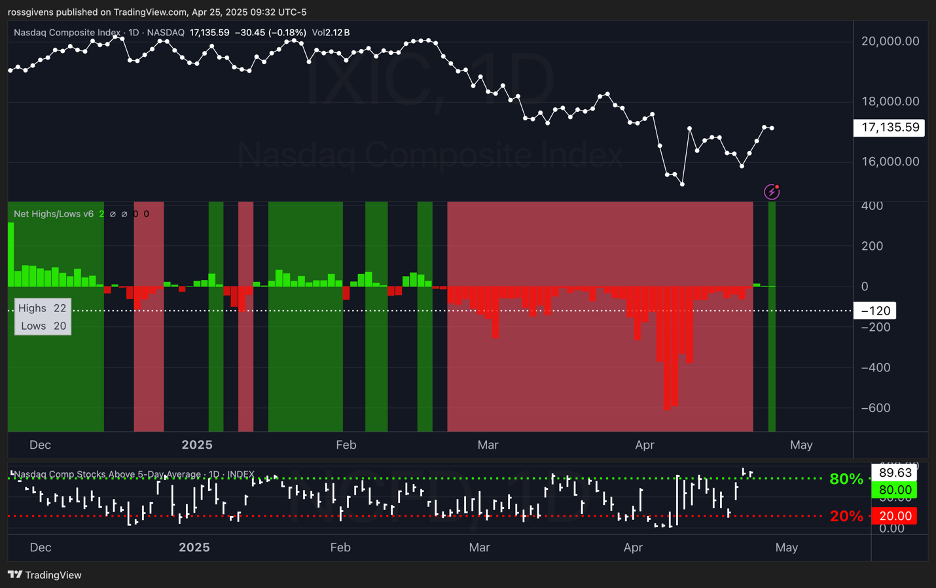
Another thing we need to keep our eyes on is the Net New Highs/Lows indicator. This measures how many stocks on the exchange made a new 52-week high that day versus the number that made a new low.

In a healthy market, this number is positive – reflective of broad participation in the market. When it is red (especially very red), there is heavy selling.

Today, for the first time since February, we are again painting green. This means there have been 3 days in a row of net new highs.

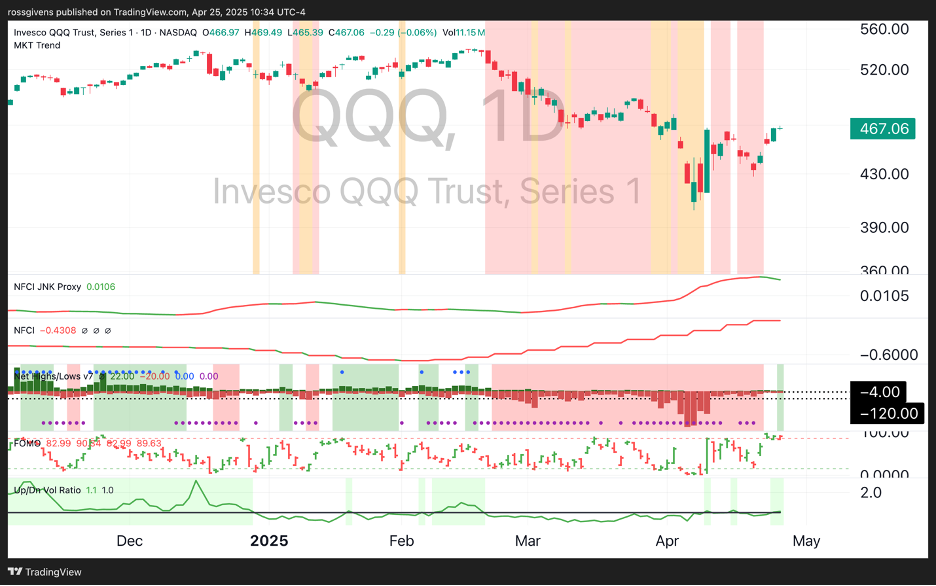
This last chart comes from a talented trader named Matt Caruso.

On top is a market trend model looking at a number of breadth indicators that has finally turned bullish.

Beneath that, an inverse JNK moving average which serves as a faster-moving NFCI proxy shows loosening credit conditions and improved liquidity over the last several days.

The bottom of the chart shows the Up/Down Volume Ratio which is finally getting back above 1.0.

There are no guarantees in the stock market. And President Trump is a bit of a wild card. But these bullish metrics have been found at the start of every market recovery in the last decade.

Which leads me to the conclusion that it is time to buy.

Best wishes for your trading,
Weekly Update: This Stock Is Going UP Right Now

Good evening, and welcome to this week’s edition of Stealth Trades!

A lot of investors are looking for stocks to buy on the cheap after the market pullback.

That’s good. That’s what they should be doing. 

95% of the top-performing stocks of the last century started their big move after a bear market or correction. So, this is the perfect time to be shopping for stocks.

And one of the best indicators of a future top performer is divergence.

Divergence means the stock is doing something different than the rest of the market. In this case, that means going up while everything else is going down.

I’m not talking about defensive stocks. Names like TJ Maxx and Allstate insurance are only holding up because scared portfolio managers are flooding into companies they believe will be less affected by a recession.

No, what I’m talking about are growth stocks that are somehow surging in what has been one of the ugliest market environments.

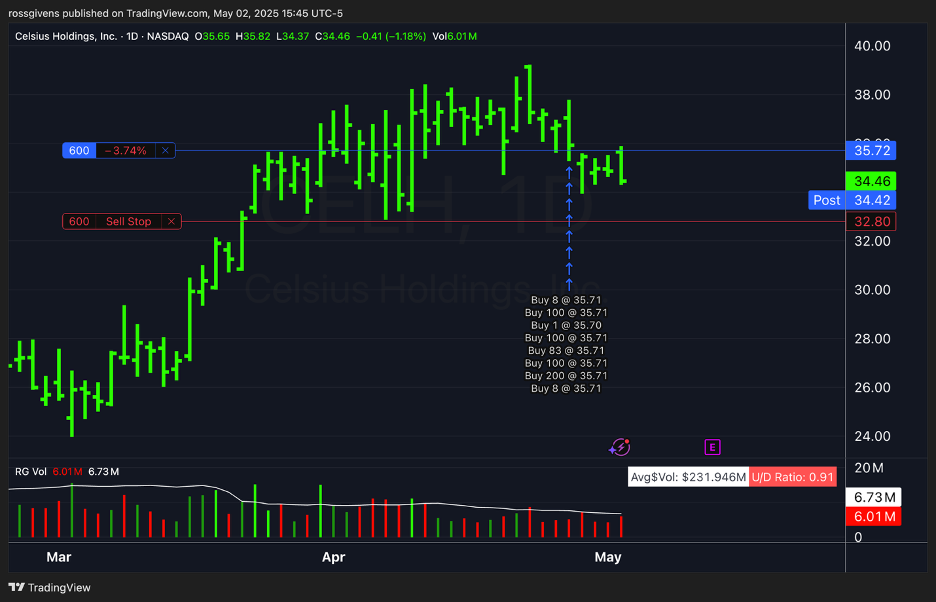
One of those stocks is Celsius Holdings (CELH)

Celsius develops, markets, sells, and distributes functional beverages and liquid supplements, including post-workout energy drinks and protein bars. 

Its main product is a line of energy drinks. The company now ranks as the #3 energy drink brand in the United States. 

It now produces everything from canned drinks to powder additives and expanded into 6 new countries in 2024.

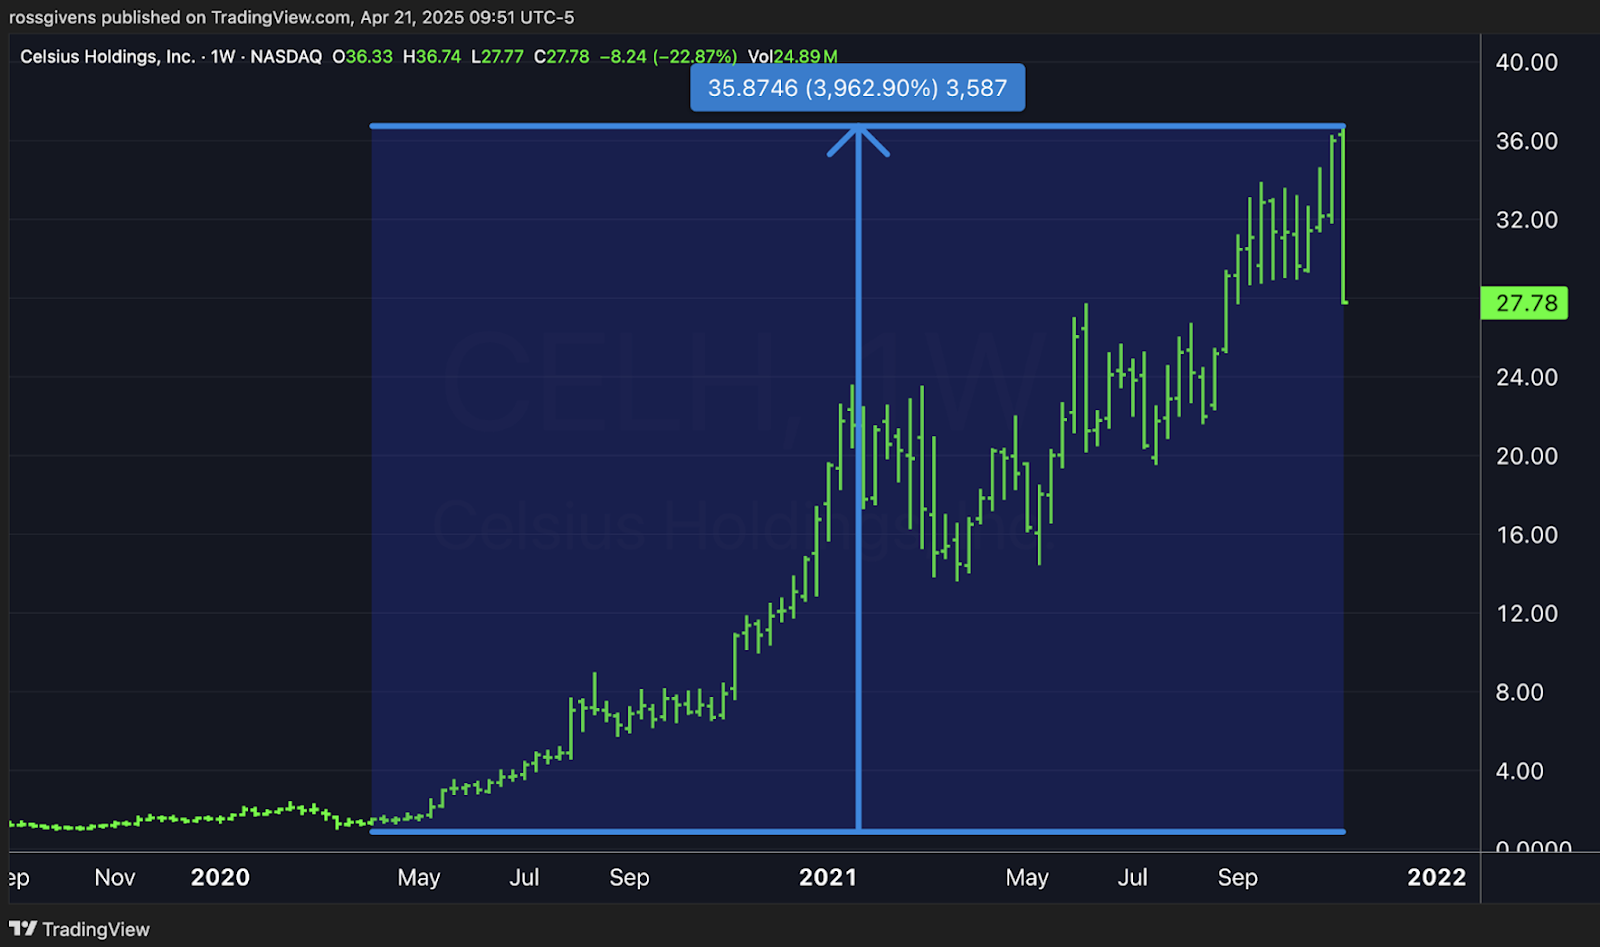
Like many growth stocks, CELH witnessed tremendous growth during the post-COVID bull market. The stock soared an astounding 3,900% from 2020 through the 2021 peak.

​​ The biggest decline in the stock took place in May of 2024 where, after topping out, price fell 78% from its highs.

In its quarterly report, Celsius reported higher than expected revenue but lower earnings. The top line beat was not enough to keep the bull train chugging. Instead, the stock gapped down and immediately began to trend lower.

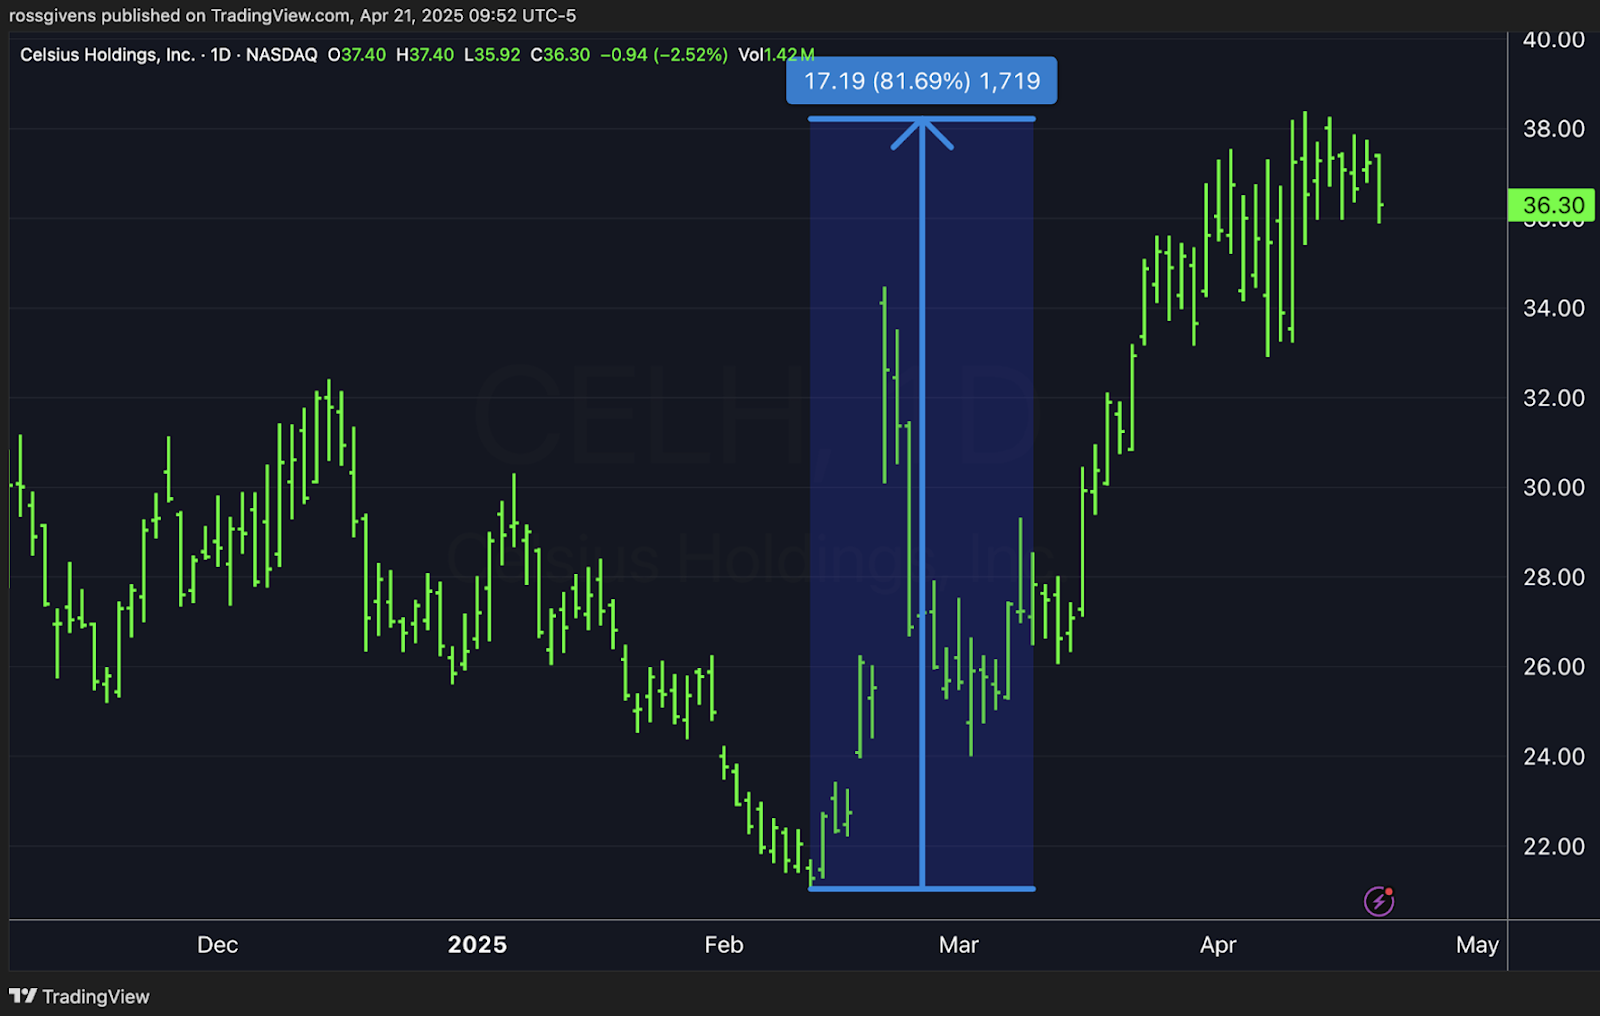
CELH bottomed in February, and the recovery seems to finally be underway. After chopping around near the lows for six months, CELH is now up over 80% in the last two months.

Interestingly, this powerful move has taken place while the rest of the stock market has cratered. The international trade war that has cast doubt and uncertainty on global markets is not affecting Celsius stock in the slightest. 

With CELH now trading above the consolidation zone where it spent the last six months, there is a good chance that this will be the start of a new Stage 2 uptrend. And this is where the real gains are made.

The stock now trades above its 10, 21, and 50-day moving averages with all three trending higher. It has also reclaimed its 200-day moving average which is the proverbial line in the sand that separates a stock being in a long-term upward or downward trend.

Historically, the biggest gains have come following pullbacks and bear markets. Stocks showing clear divergence and rising against such downward pressure are often the biggest movers in the next bull market. And Celsius is showing all the signs of just such a future winner.

Here is how I would trade it…

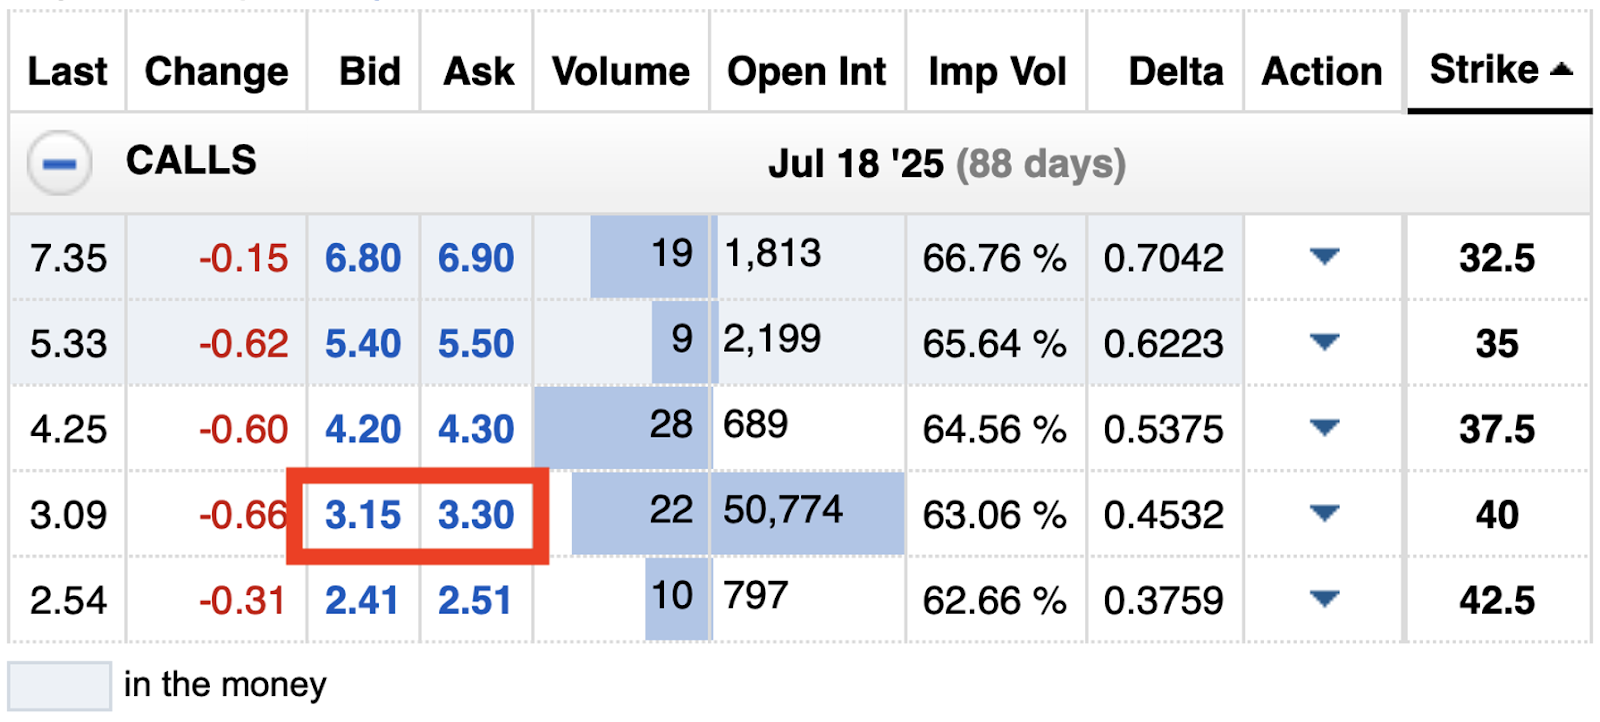
Stock Trade: Buy Celsius Holdings (CELH) stock at the market, then place a sell stop order at $31.00 to risk 15% on the trade. 

Option Trade: Buy the CELH Jul18 $40 call options (.CELH250718C40) which currently trade for around $300 per contract.

Best wishes for your trading,

Weekly Update: The Low Is In

Good evening, and welcome to this week’s edition of Stealth Trades!
In all likelihood, the low of the bear market is in.
After an EXTREMELY volatile week, which saw daily swings of 8-10%, the Nasdaq finished with a 7.51% gain.

Over the last couple weeks, I have been holding emergency webinars to address current conditions surrounding tariffs and outline what I was looking for to signal an end to the selloff.

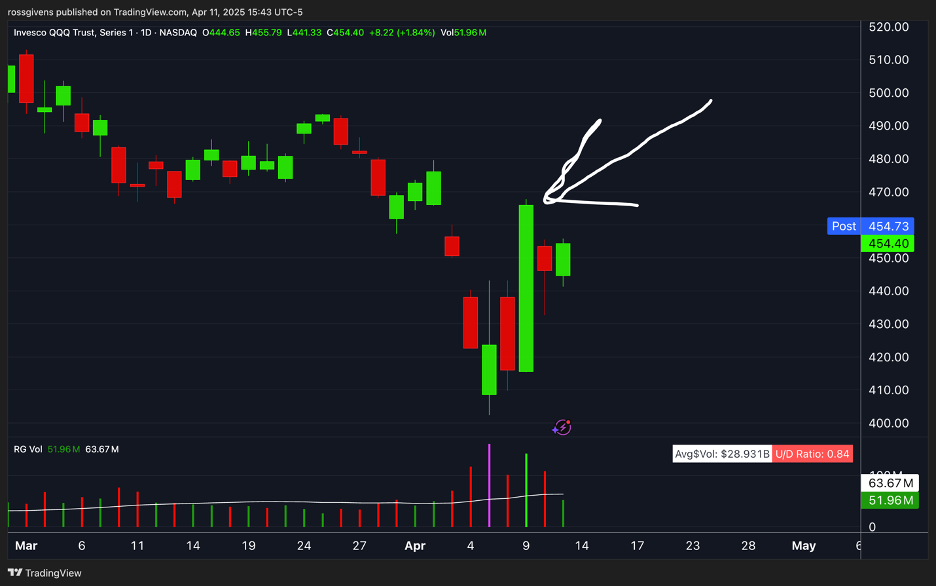
And on Wednesday, we got it.

Look at the daily chart below…

I have drawn an arrow pointing to Wednesday.

In a single day, the stock market gained 12% and closed within spitting distance of the highs.

Historically, this has been the sign that the bear market is over.

Go back and look at 2020 and 2022. On both occasions, you will see a day – at the low – that experienced huge buying. In each instance, the market gained 7% or more, closed near the highs, and experienced well above average trading volume.

That is what we saw on Wednesday.

This is a sign that big institutions are piling back in. It means that negative news and the fear of it has been fully priced in.

Wednesday’s surge was caused by Trump’s announcement that he would be pausing all international tariffs with the exception of China.

In the two days following this event, we saw China not only refuse to back down but also increase their tariffs on US goods.

This was the market’s greatest fear. Yet, on the realization of this scenario, stocks failed to sink lower and come anywhere close to Monday’s lows.

This, to me, signals that the bloodbath is over. I would be shocked if the market broke this week’s low any time soon.

I am not saying it will be smooth sailing from here. It may take several months before the market makes new highs. But I am not looking for stocks to buy.

Short-term shocks surrounding inflation, rate cuts, and the ongoing trade war with China will no doubt result in a higher volatility environment than what we experienced over the last few years. Tweets and Truth Social posts will still cause quick reactions in the equity market.

But if you have been looking for a sign to get back in, this… at least for me… is it.

Best wishes for your trading,