Weekly Update: Goodbye Magnificent 7, Hello BATMMAAN

Good evening, and welcome to this week’s edition of Stealth Trades!

As we come to the end of another year in the stock market (a fantastic one at that), it is important to look for new themes developing.

For the last two years, we have been hearing about the Magnificent 7. These seven stocks – Meta, Nvidia, Amazon, Alphabet, Apple, Microsoft and Tesla – have been the driving force behind much of this bull market.

The Mag 7 is the successor of the FAANG stocks – Facebook, Amazon, Apple, Netflix and Google (now Alphabet) – that led the 2009-2020 bull market.

But a new gang is in town…

Thanks to the dominance of AI companies and the massive sales and earnings growth of those leading the charge, a new group of stocks has come to the forefront.

They are called BATMMAAN.

As the tradition goes, each letter represents a name of one of these stocks:

Broadcom

Apple

Tesla

Microsoft

Meta Platforms

Amazon

Alphabet

Nvidia

This stuttering Batman represents the leading mega-cap stocks in the market today.

In actuality, it is just the Magnificent 7 with the addition of Broadcom (AVGO) which shot up 25% on Friday after reporting a 220% increase in AI revenue. This makes Broadcom the 8th company to join the exclusive $1 trillion market cap club.

It may not be a household name like Apple or Microsoft, but Broadcom is quickly becoming an investor favorite thanks to booming demand for its generative-AI infrastructure.

These 8 stocks represent a collective $19 trillion of market value.

To put that in perspective, this is more than the value of the entire U.S. stock market in 2012.

Today, the U.S. equities market has a total value of $55 trillion. The top 500 companies are worth $48 trillion. And these 8 juggernauts make up almost 40% of that.

These numbers are truly mind-boggling. But as more and more investors turn to passive investing via ETFs and index funds, I expect to see this outsized concentration at the top get even more extreme, not less.

Eventually, these giants will be broken up by antitrust laws.

The last major monopoly breakup took place in 1982 with AT&T. Its dominance prevented new competition from entering the market. The company was divested into seven smaller regional companies – NYNEX, Bell Atlantic, Ameritech, BellSouth, Southwestern Bell, US West and Pacific Telesis.

Before that it was Andrew Carnegie’s Steel Company then John D. Rockefeller’s Standard Oil. Today we have ExxonMobil, Chevron, Texaco, Marathon, BP, and ConocoPhillips, but these were all once a part of Standard Oil.

Today, Amazon owns online retail. 40 cents of every dollar spent buying anything online is spent at Amazon.

Google completely dominates the search game with a 90% market share.

And Meta has a 77% market share in the social media industry through Facebook, Instagram, WhatsApp and Messenger.

While I do not see it happening in the next five years, I can envision an anti-monopoly movement sweeping through D.C. that would require all of these giants to spin off their business.

Now don’t get me wrong… I’m no left-wing populist. No one should be punished for building a great business.

But investors almost never lose in a spinoff. In fact, they usually prosper. For many of these companies, they actually trade for less than the sum of their parts. Rockefeller became even wealthier after the Standard Oil breakup.

Smaller companies are more nimble and often more innovative. They often trade at higher multiples of earnings thanks to faster growth and a sharper focus on their core product or service.

I will always pull for the underdog. Given the choice between two similar stocks, I will always pick the smaller, younger company. But the big dollars behind multi-trillion-dollar asset managers like BlackRock will continue to favor mega-cap names like BATMMAAN out of necessity. And that could lead to many more companies on the trillion-dollar list.

Best wishes for your trading,

Weekly Update: How to Trade Bitcoin

Good evening, and welcome to this week’s edition of Stealth Trades!

All eyes were on crypto this week as Bitcoin hit the elusive $100k target.

President Elect Trump’s pro-crypto stance, which initially seemed like a political vote grab, is causing billions of investment dollars to flood into the cryptocurrency market.

Crypto stocks have been the top-performing group in the market over the last one, two and three-month periods.

The obvious names like crypto miners Hut 8 (HUT), MARA Holdings (MARA) and Riot Platforms (RIOT) have made big strides. So have crypto brokers like Coinbase (COIN), Robinhood (HOOD).

But the most liquidity is going to Bitcoin itself, which now has a market capitalization of $2 trillion. Only three companies – Apple, Nvidia and Microsoft – are worth more.

For those interested in dipping your hand in Bitcoin, I have found that it trades in a very technical manner. Consolidations are typically clean, breakouts lead to sustained trends higher, and it tends to follow the same 4 Stage Cycle found in growth stocks.

Below is a weekly chart of Bitcoin on which I have marked up each of the 4 stages. If you are not familiar with this process, join me in our Live weekly Stealth Trades sessions every Monday at 4pm ET where I walk members through it.

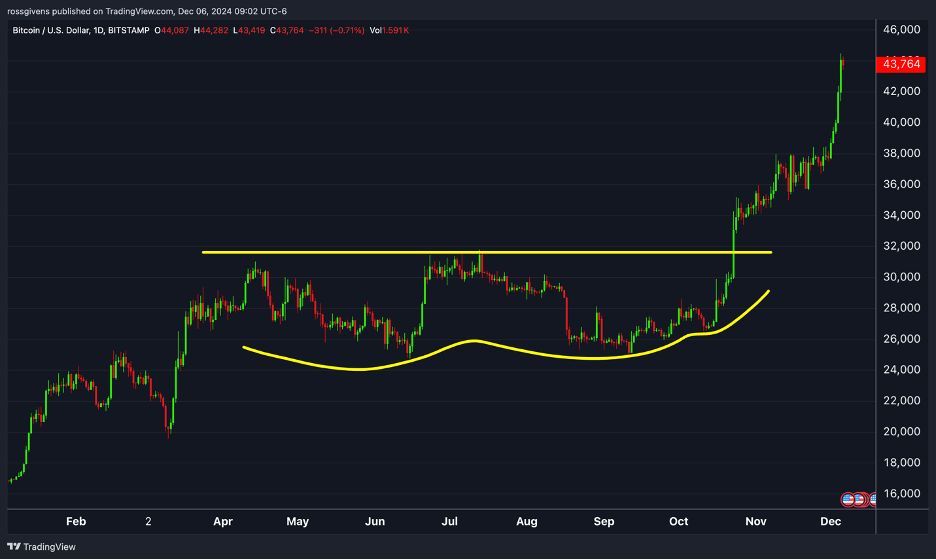
As I mentioned, BTC also trades in a very technical manner. Below is a daily chart highlighting the shallowing compression pattern it put in from March to November.

This is a proven pattern that often leads to big, fast moves like what we have seen from Bitcoin over the last couple weeks.

In fact, it could be setting up for another move higher (see chart below):

Symbolic prices like $100, $500, or in this case $100k are psychologically significant to traders. “I’ll sell it if it gets to $1,000.”

Simple? Yes. But it’s true. We almost always see near-term resistance at these big levels since traders often take profits and slow momentum. That is exactly what we are seeing today in Bitcoin.

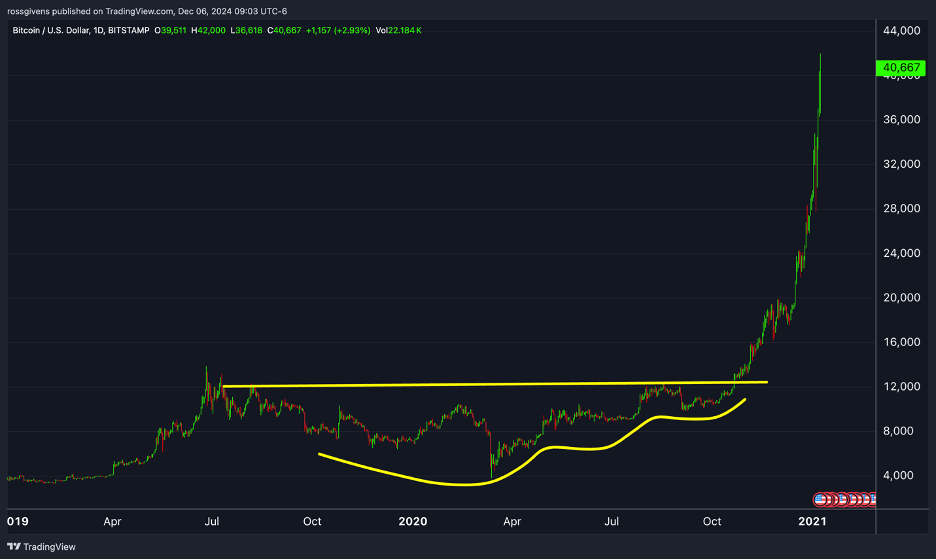
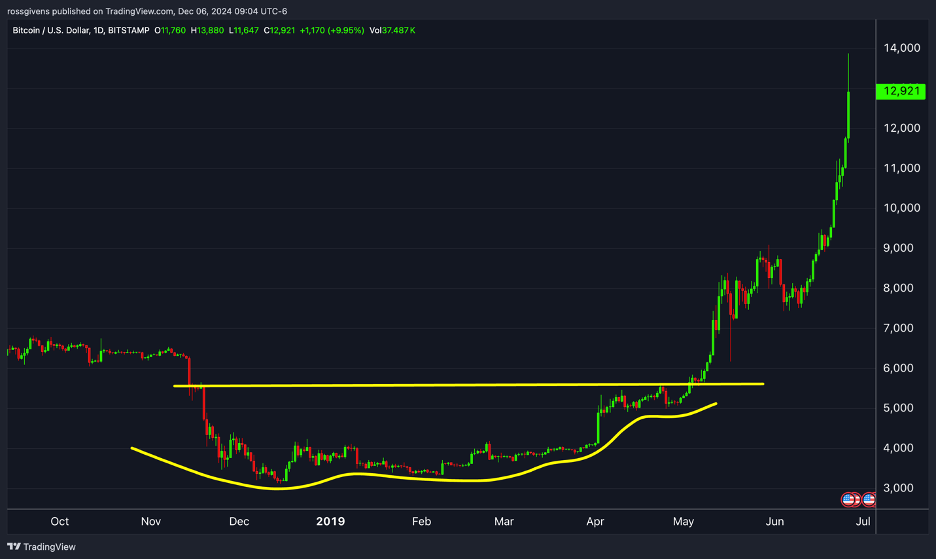
But the shallowing pullbacks I have highlighted in yellow on the chart show dwindling supply as coins consolidate from weak hands into strong. Limited supply is one of the key contributors to a stock’s movement since buyer demand can more easily push the price higher.

We saw a similar pattern when it broke out above $30k in 2023:

And $12k back in late 2020:

We saw it again coming off the low 2019:

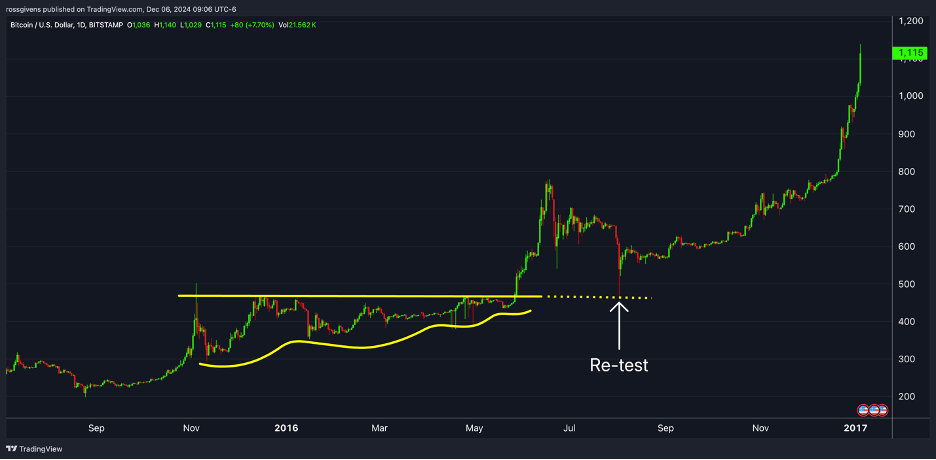
It has even appeared in early-stage breakouts as far back as 2016:

There is no need to re-invent the wheel. Whether it’s Bitcoin, Nvidia stock, or the price of feeder cattle, look to the market to tell you when to buy.

We have no informational edge over Wall Street. And I won’t pretend to be smarter than the rest. You must learn to interpret price and volume… to identify these low-risk, high-reward entry points where supply and demand dynamics give you a statistical edge.

That is how traders make money.

Best wishes for your trading,

Weekly Update: My Top 10 Super Stocks

Good evening, and welcome to this week’s edition of Stealth Trades!

Last week, I held a webinar to share my top 10 “Super Mover Stocks.” 9 of the 10 have continued to press higher.

In case you missed it, here is the list.

These are not blanket buy recommendations. These are simply some of my favorite high momentum stocks in strong uptrends seeing heavy institutional buying.

We are in a strong bull market. And these are the kinds of stocks I look for clean entry points on.

Do your own due diligence and set your own risk parameters.

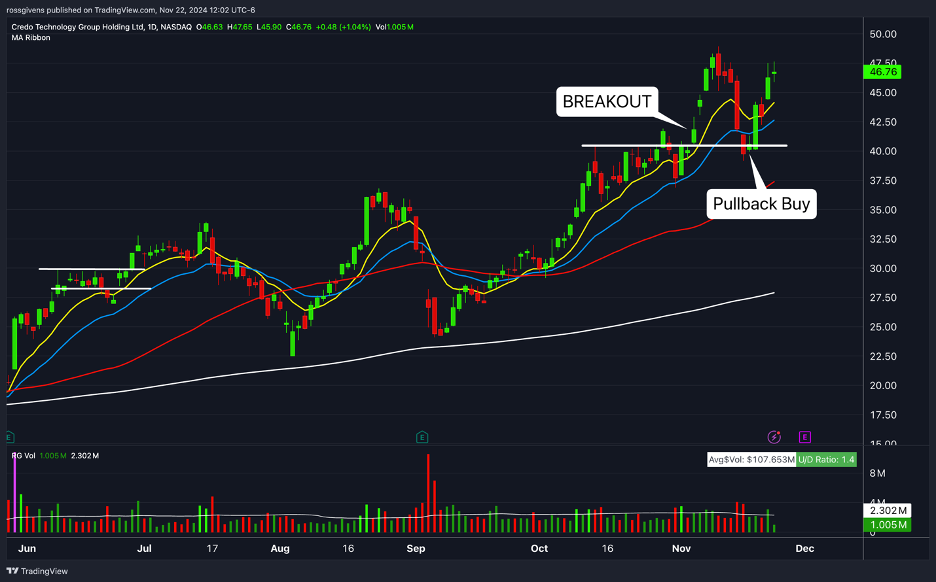
Credo Technology Group (CRDO)

CRDO is a technology manufacturer that makes circuits, cables and other parts for data infrastructure systems.  It is up 164% year to date and steadily marching higher.

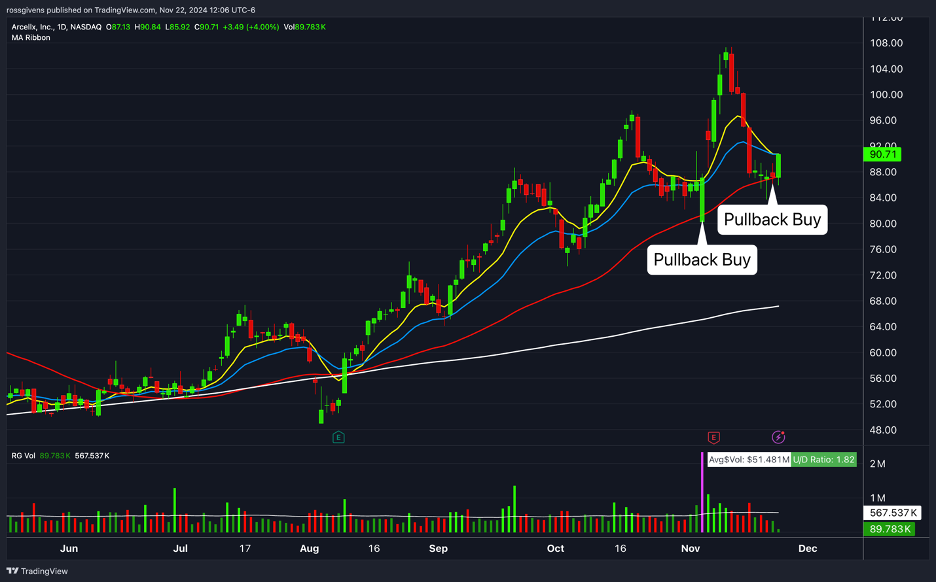
Arcellx (ACLX)

ACLX is a biotech working on revolutionary cell therapy treatments for cancer patients. The stock is a bit volatile but showing high relative strength. This could be a decent buy point on this pullback to the 50-day moving average.

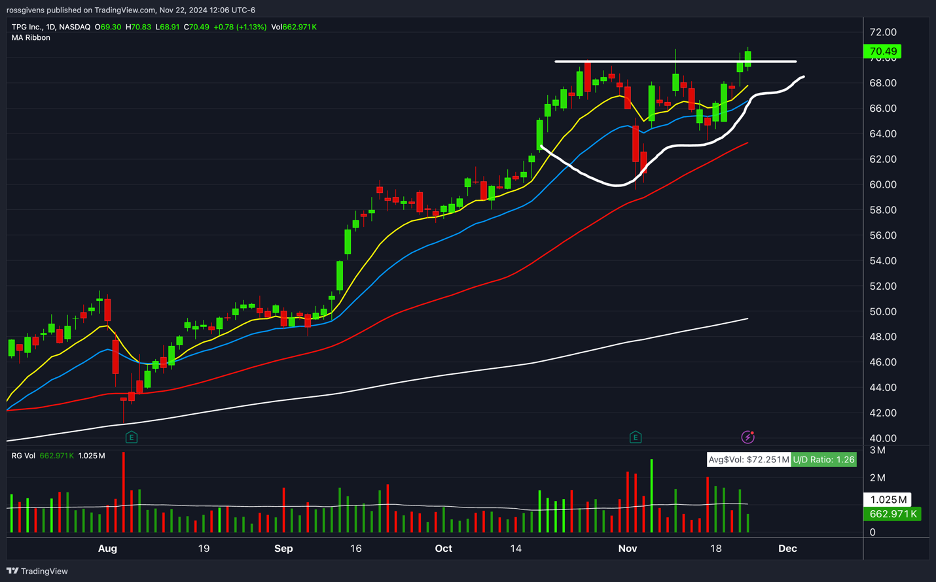
TPG Inc. (TPG)

TPG is a $25-billion-dollar money management firm seeing tremendous growth. The company is likely to see compound growth as the bull market accelerates since while they are growing their assets under management, those assets also increase as stock prices rise. The stock appears to be breaking out from a 4-week consolidation pattern.

Oklo Inc. (OKLO)

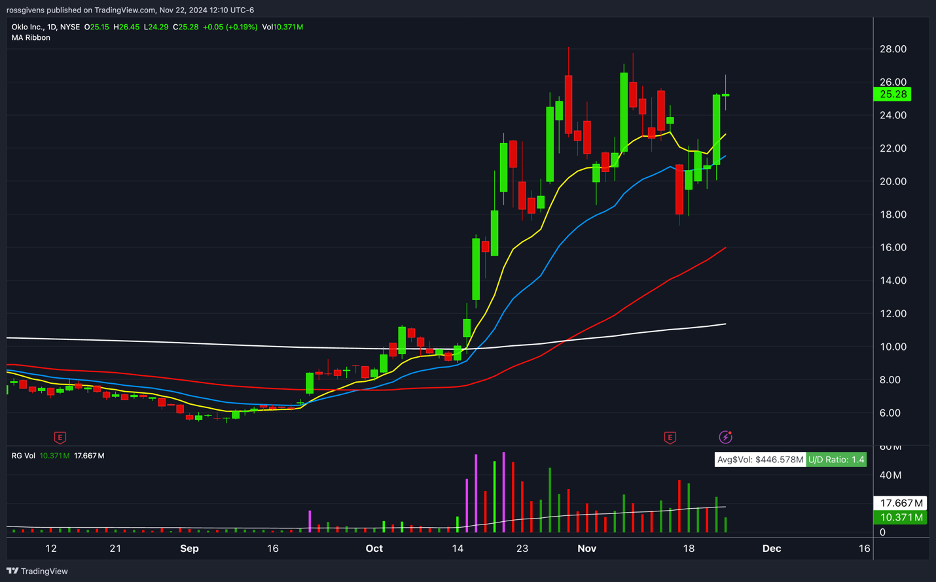
OKLO is a nuclear stock, and this group has seen a huge rally over the last two months. OKLO is more volatile than my next pick, which is also in this group, but it is nonetheless a fast-mover.

NuScale Power Corporation (SMR)

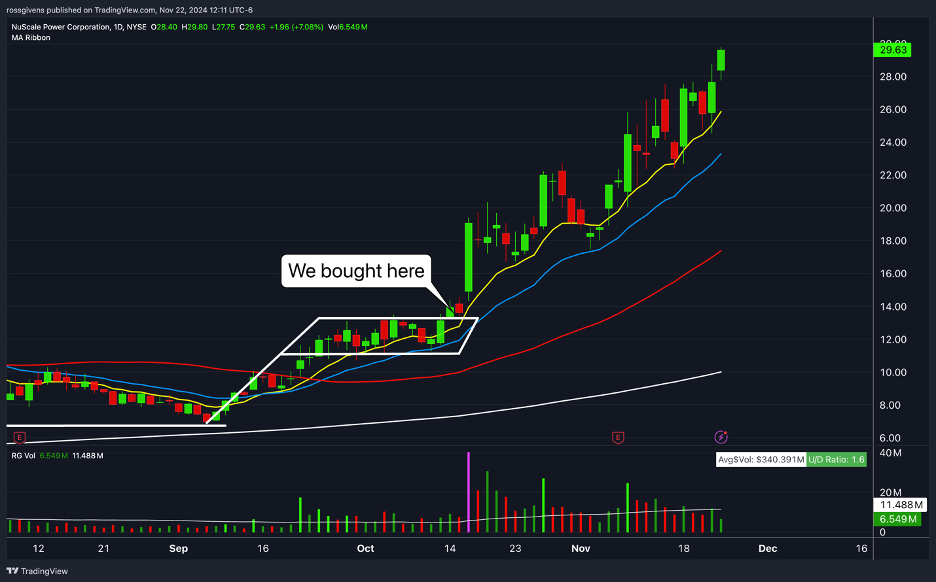
SMR has been one of my favorite stocks since the beginning of the year. It is now up over 1,000% year-to-date. The company builds small modular reactors designed to power AI data centers.  We purchased the stock in our FIRE Trader service last month and have more than doubled our money already. We also had a big win trading a breakout on this name in Alpha Stocks. The trend is so powerful, this is one you want to just strap into, trail a stop loss, and ride the momentum as long as it lasts.

Carvana (CVNA)

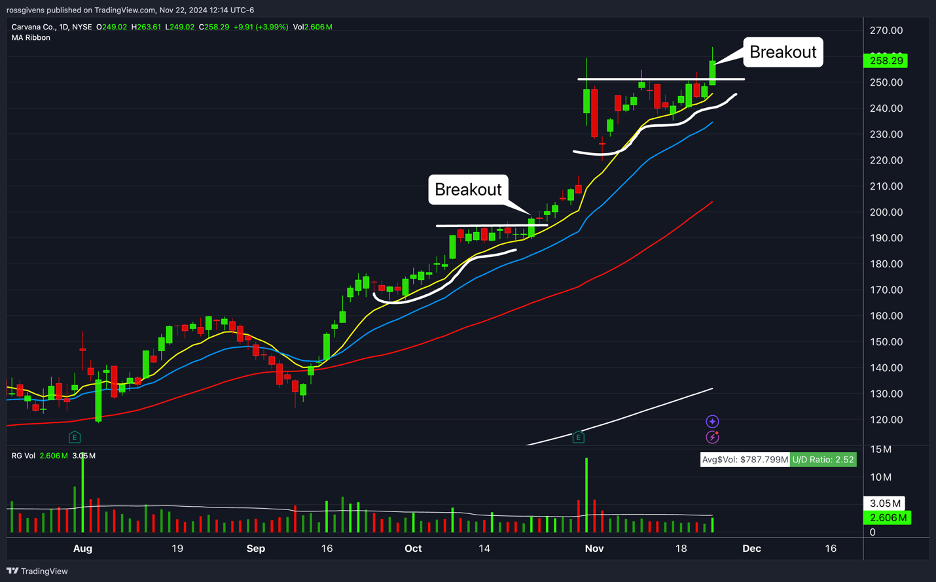
Carvana was one of the biggest boom-and-bust names of the post-COVID rally. The stock shot up 1,281% between 2020 and 2021 before collapsing all the way back down. It makes big trends – both up and down – and right now the trend is clearly upward. Shares have doubled since September and appear to be breaking out once again.

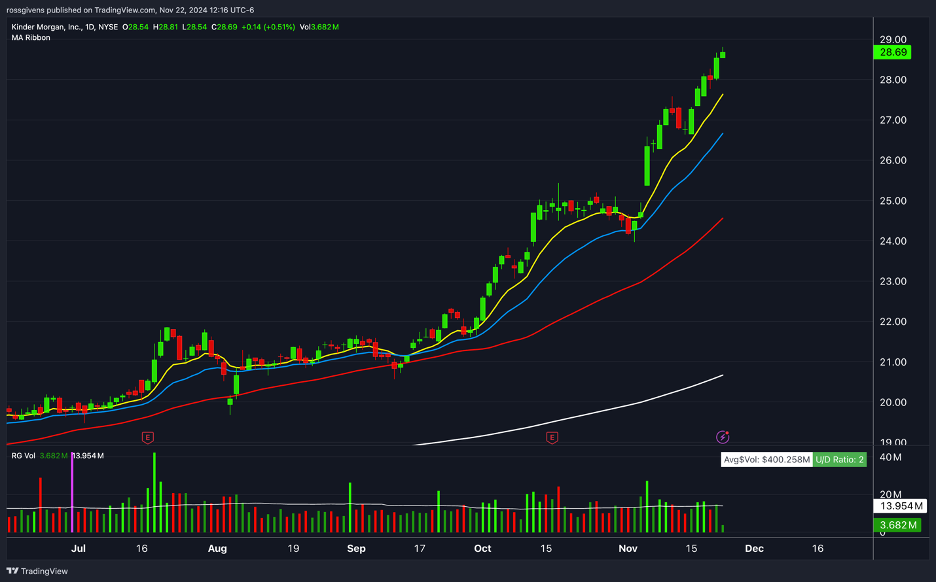
Kinder Morgan (KMI)

This is an institutional favorite in the oil and gas sector, and right now no price seems too high for this stock. It is riding the momentum of Trump’s presidential victory with renewed optimism about more favorable conditions for drillers.

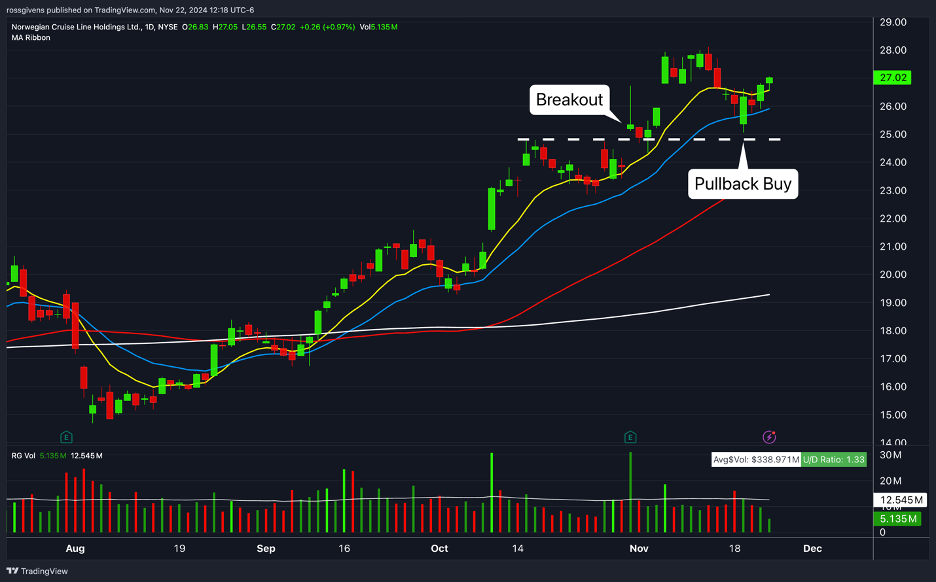
Norwegian Cruise Line Holdings (NCLH)

Cruise stocks are highly cyclical – meaning they ebb and flow with the health of the overall economy. Investors are extremely bullish on the new Trump economy, and this stock is responding in kind. It seems to me that this stock has been held back by fears of another pandemic shutdown which, under Trump, are far less likely. It traded for $60 before COVID, yet today still trades for less than half that price.

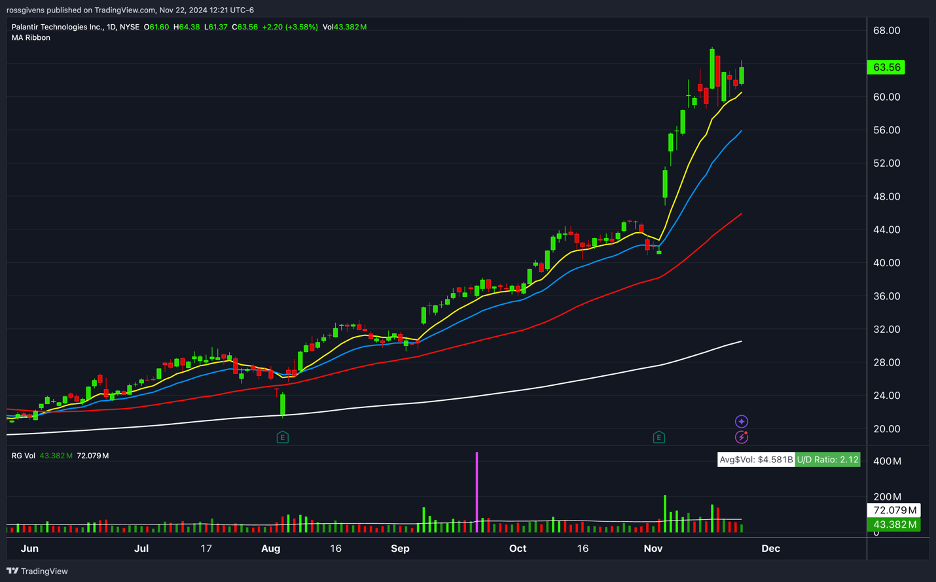
Palantir Technologies (PLTR)

This has been a “just buy it” stock all year. Nothing has been able to slow it down. PLTR makes the central operating system software used by a number of commercial and government clients. Founded by venture capitalist Peter Thiel and hedge fund tycoon Stephen Cohen, the company has huge government contracts – both domestic and international – that make them billions.

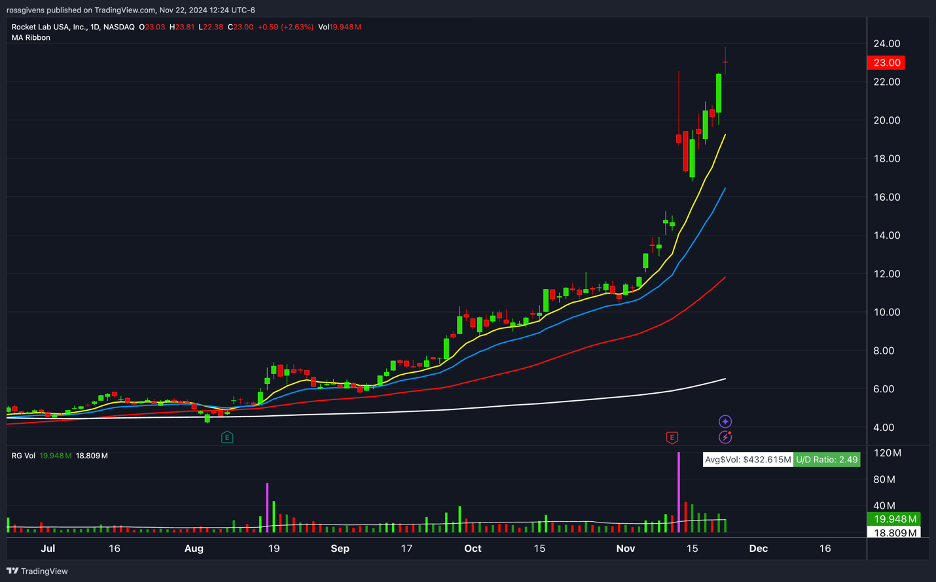
Rocket Labs (RKLB)

I’m not sure what “rocket” is referring to – the company’s products or its stock price. The aerospace juggernaut develops launch and control systems for the space and defense industries. Wall Street loves the stock. The company failed to meet earnings projections last quarter, and RKLB still went up 28% on the day. It is a monster, and I would consider buying on any pullbacks.

Best wishes for your trading,

Weekly Update: How to Buy Stocks on Pullbacks (Part 2)

Good evening, and welcome to this week’s edition of Stealth Trades!

A few weeks ago, we talked about buying stocks on pullbacks. I outlined two methods of buying stocks on temporary weakness from low risk buy points.

Today, I want to add to that discussion by adding another element to the equation – volume.

Volume is one of the most overlooked indicators for traders. Learn to interpret it, and you can decipher what is really happening beneath the surface.

Remember that institutions are what moves prices. Multi-billion-dollar hedge funds, mutual funds, ETFs, pension funds and other large players are the ones whose buying and selling actions push stocks up and down.

So, when a stock is rallying on above-average volume, it usually means big players are behind the rally. And they don’t buy for a day or two. It usually takes them weeks or months to build their positions.

The same is true on the downside…

Let’s say a stock fell 10% last week. If this took place on huge volume, the big boys are getting out and you should probably do the same. If the same 10% decline occurred on BELOW average volume, however, this is likely retail selling or normal fund rebalancing.

All things being equal, a stock pulling back on the lightest volume is the one you want to buy.

Take a look at this chart…

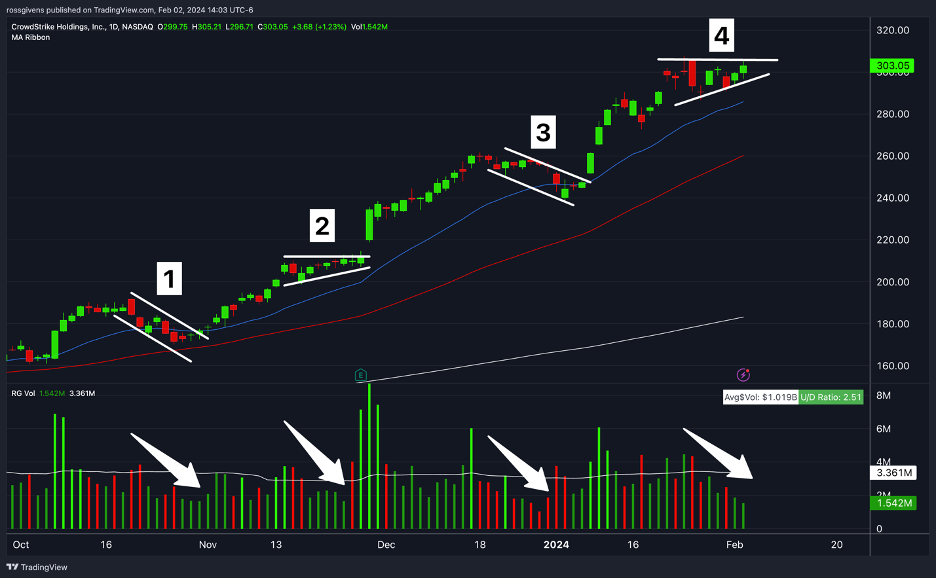
This is CrowdStrike Holdings (CRWD) stock at the beginning of this year. I have marked up the pullbacks and consolidation periods.

At Point 1, the stock pulled back 11% over a two-week period. But look at the volume graph below where I have drawn an arrow…

Notice how the decline took place on below-average volume. If you are looking for a place to buy or add on to an existing position, this is the place to do it – right between the 21 and 50-day moving averages after a low volume retracement.

The stock quickly rebounded and climbed 20% over the next two weeks.

Point 2 is more of a consolidation than a pullback. This is an area where price action compresses, the range becomes tight, and again we see volume well below its average level.

Profit taking is minimal. No one is selling and the stock is becoming harder to buy. Once CRWD broke out, it quickly rallied another 22%.

Point 3 is similar to the pullback at Point 1 – a shallow 8% decline over 2-3 weeks on very minimal volume. The stock dipped to the 21-day EMA, found buyers, then tacked on another 26% move to the upside.

That brings us to Point 4. Here, we see very similar action to what we saw at Point 2 back in November – tightening price action, a narrow range, and volume drying up.

And while nothing is guaranteed, this stock looks poised for another leg higher.

Volume is a crucial component of my stock analysis. If the price chart looks good but the volume graph doesn’t confirm, I have learned it is best not to take the trade.

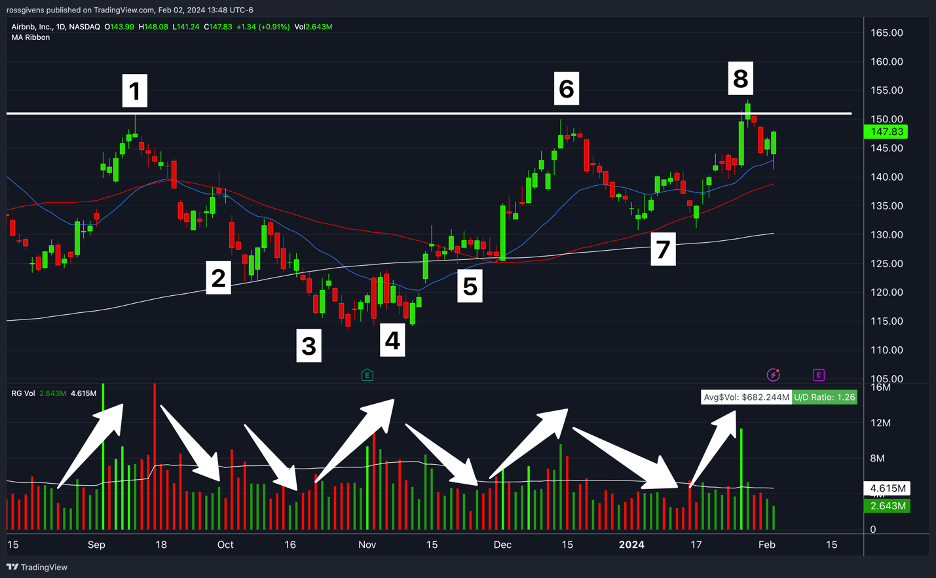
I analyze breakout trades the same way. Here is a chart of Airbnb (ABNB) stock over a period of six months:

We can see the shallowing action as the stock tightens up from left to right. This is textbook pre-breakout action. And volume confirms the story…

The initial rally into Point 1 took place on high volume. The pullbacks at Points 2 and 3 occurred on lighter action. Then volume picked up at Point 4 as the stock formed a bottom – a sign that buyers are stepping in and supporting the stock.

This was followed by a low-volume consolidation (Point 5), a high-volume rally (Point 6), and so on.

Volume can also signal the start of new trends.

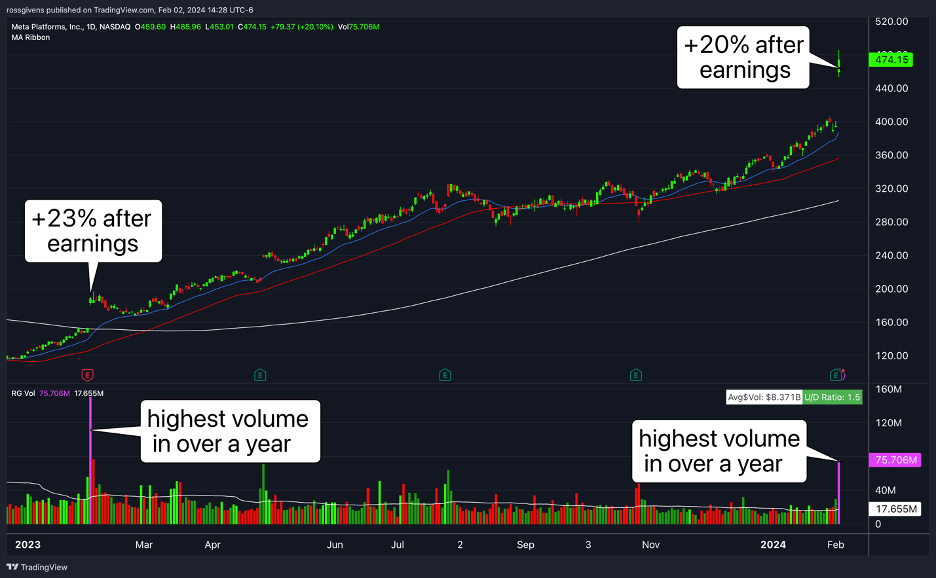
We saw just such an occurrence earlier this year in Meta Platforms (META).

The social media giant announced better-than-expected earnings and revenue, along with its first-ever dividend and a $50 billion stock buyback program. Shares surged 20% on the news.

The last time this happened?

One year prior to the day… and it triggered a 150% move.

A 20% post-earnings move on the highest daily trading volume in a year… looks kind of familiar, huh?

Trading does not need to be overly complicated. I’ve known traders with so many indicators on their charts you couldn’t even tell what the price was.

Keep things simple – price, volume, and a couple of moving averages to serve as guideposts. There’s no magic indicator. But volume is probably the closest thing to it.

Best wishes for your trading,
Weekly Update: Market Soars on Trump Victory

Good evening, and welcome to this week’s edition of Stealth Trades!

The Trump economy is off to a great start.

Tuesday’s night election victory sent stocks soaring, delivering the biggest single-day gain in years.

The S&P 500 index made a new all-time high on Wednesday… another one on Thursday… and yet another on Friday.

So did the Dow Jones and Nasdaq indexes.

As we forecast over the last several weeks, investors are extremely optimistic about the next four years. And the equity market is already pricing in the expectations of Trump’s proposals.

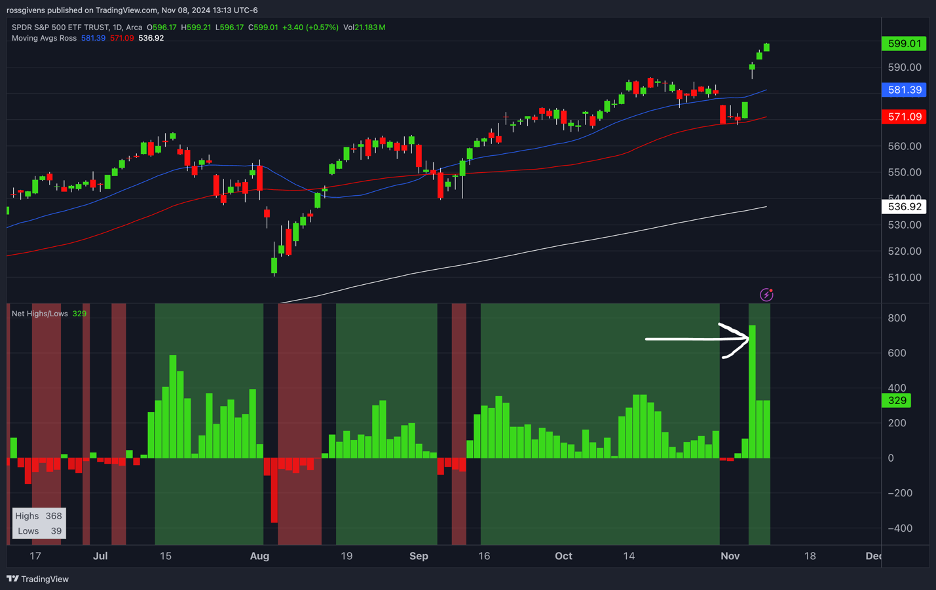
On Wednesday, the Net Highs/Lows indicator hit an incredible 758 – meaning 758 more stocks made new all-time highs for the day versus new lows.

This is the highest reading since December 2016.

In terms of sector strength, the big winners so far are crypto, timber, airlines, infrastructure, and consumer discretionary. These are the areas of the market that have seen the largest gains over the last few weeks.

Crypto is benefitting from President-elect Trump’s pro-crypto stance and remarks that he wants the US to be the leader in digital currencies. Infrastructure is also rising on assumptions that he will allocate tax dollars to improve aging infrastructure.

Airlines, timber and consumer discretionary sectors are all cyclical sectors. These areas tend to move in lockstep with the overall economy. When conditions are good, these areas perform well and vice versa.

So, this is yet another sign that investors believe economic conditions will improve under Trump’s leadership.

Small-cap stocks, which have underperformed over the last few years, saw the biggest gains this week.

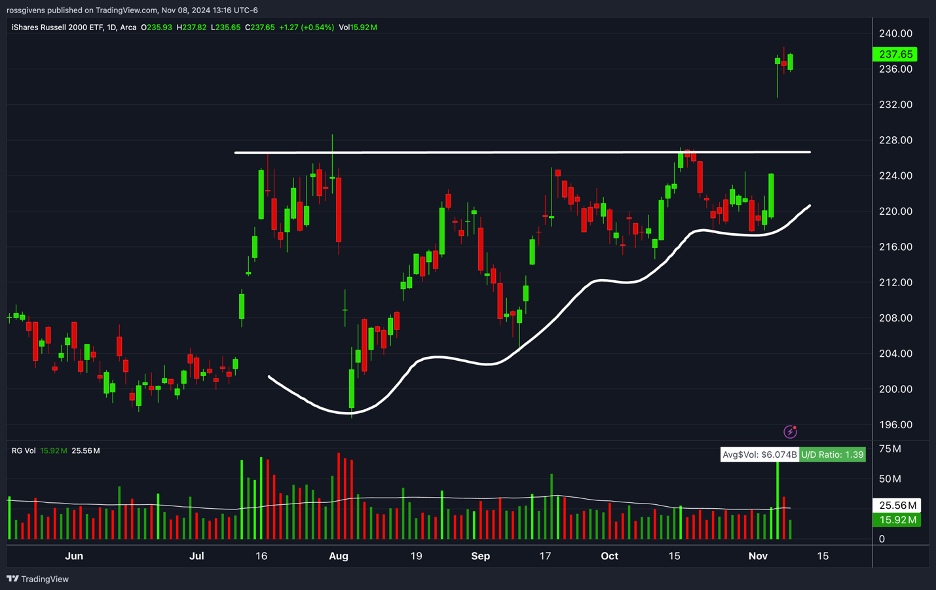
The Russell 2000 small cap index gapped up 5.7% following the election results.

If you attended my live webinar on Tuesday, you heard me lay out my case for why this would happen. I also highlighted the breakout pattern forming on the Russell pictured above.

Smaller companies tend to do most of their business domestically. And Trump’s protectionist policies including tariffs and renegotiating trade deals will favor these companies more than global operators.

I remain bullish on the market with a particular focus on nuclear stocks.

Republicans now control the White House, Senate and the House of Representatives. When one party has a majority in all three houses, more tends to get done since the other side is unable to block their moves with a voting majority.

I will not call this a good thing or a bad thing, only that the new administration will be able to push their agenda through more easily.

From what I can tell, Trump is open to a nuclear future. As a renewable energy source, it is one of a small handful of issues that both sides of the aisle could get behind. Elon Musk – who will likely serve as a key advisor to Trump – knows the importance of increasing our power output, especially for artificial intelligence data centers.

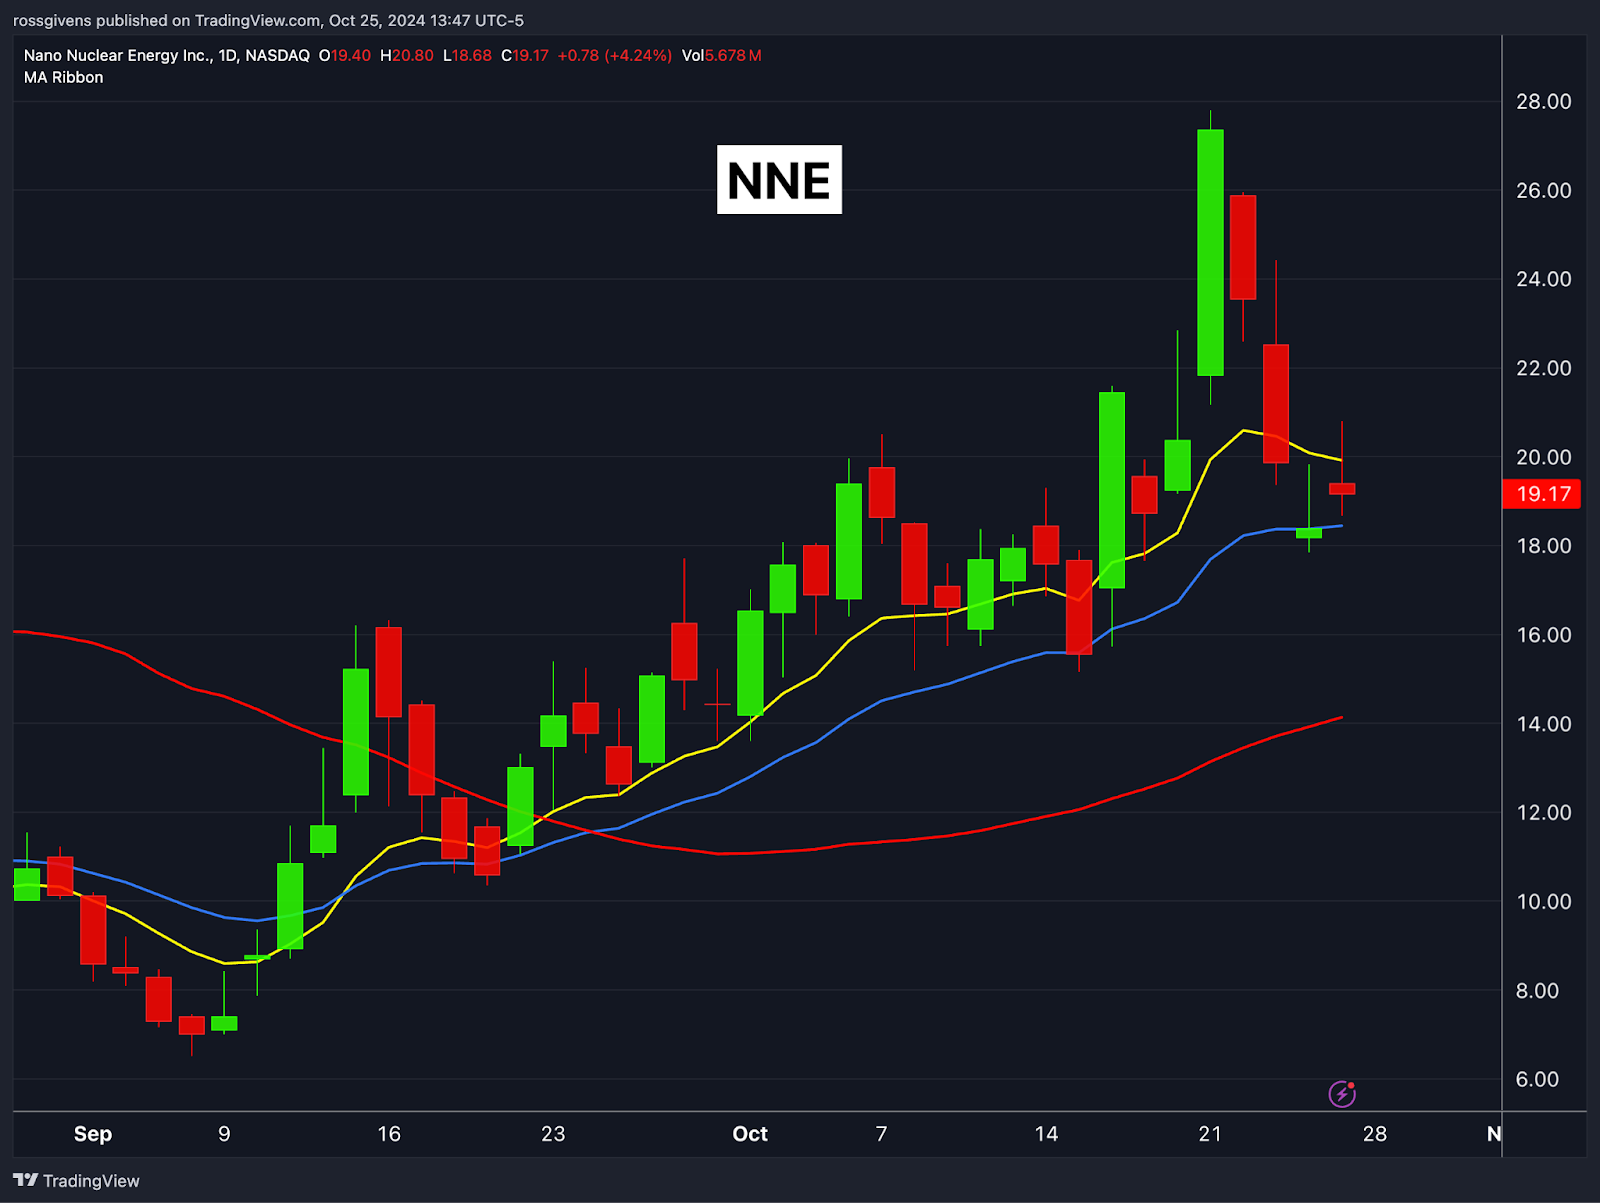
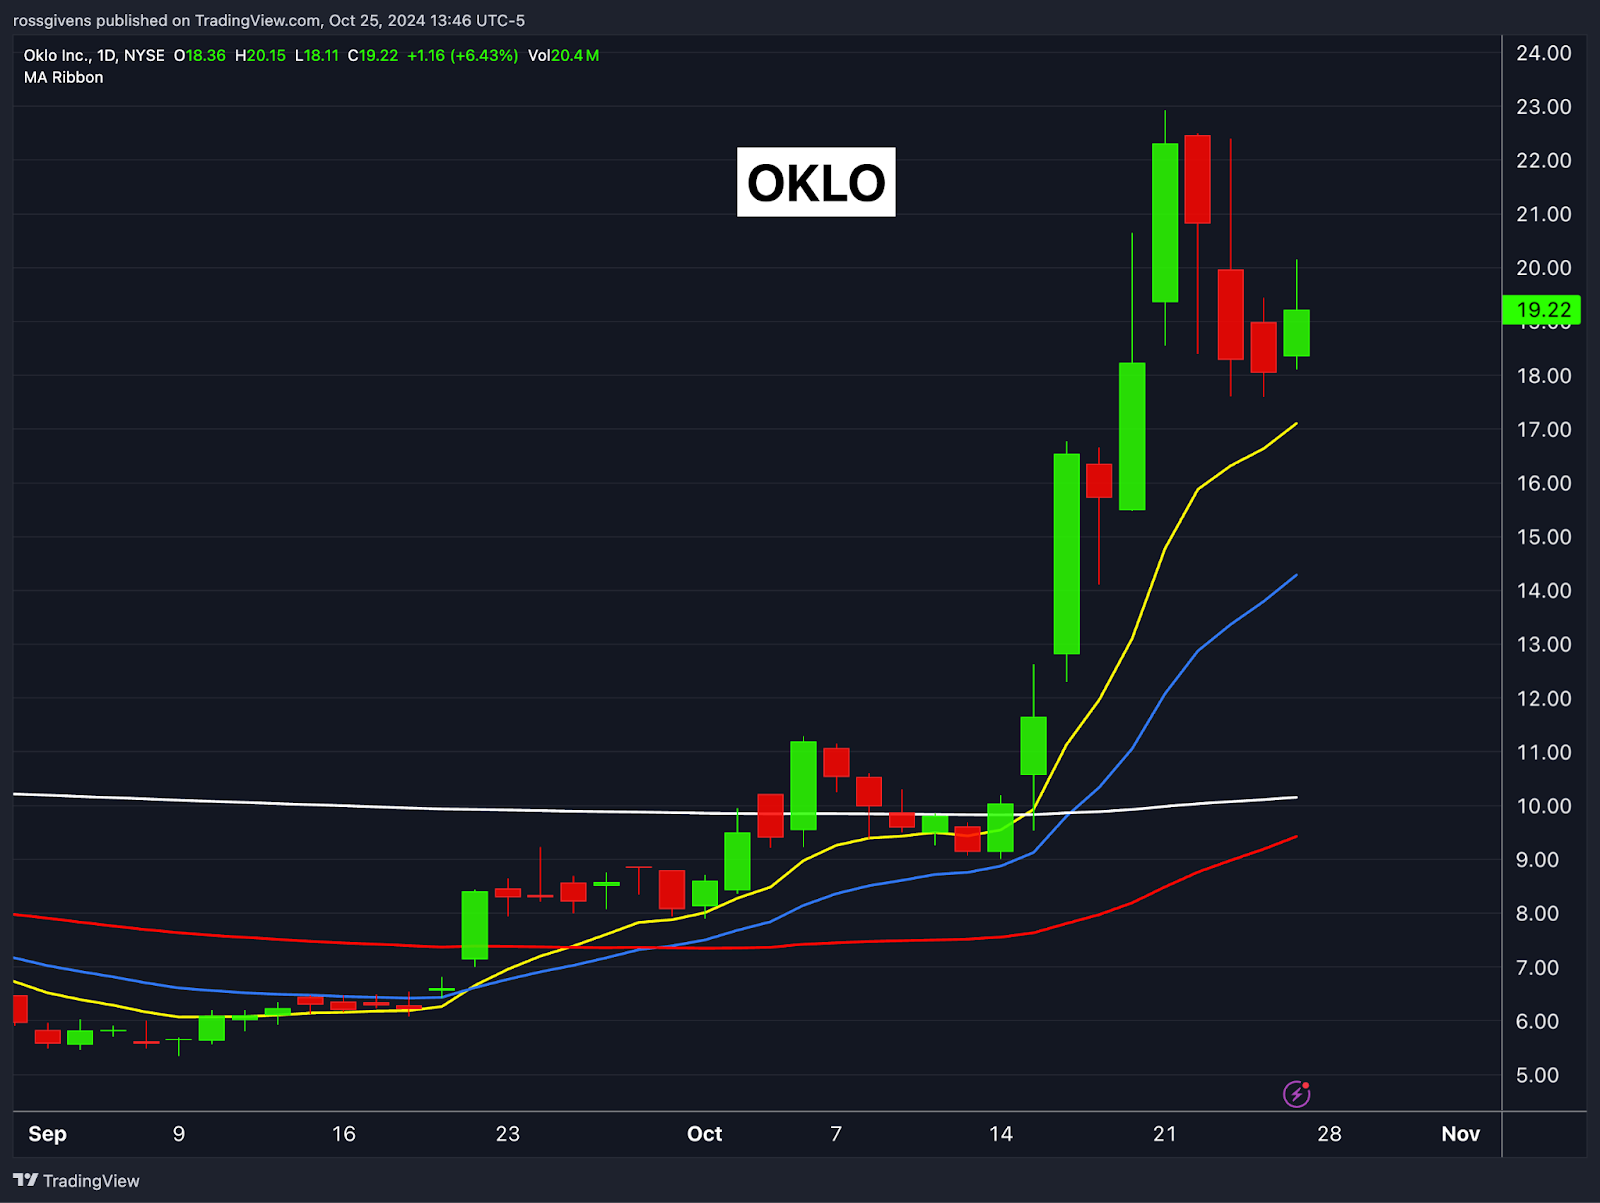
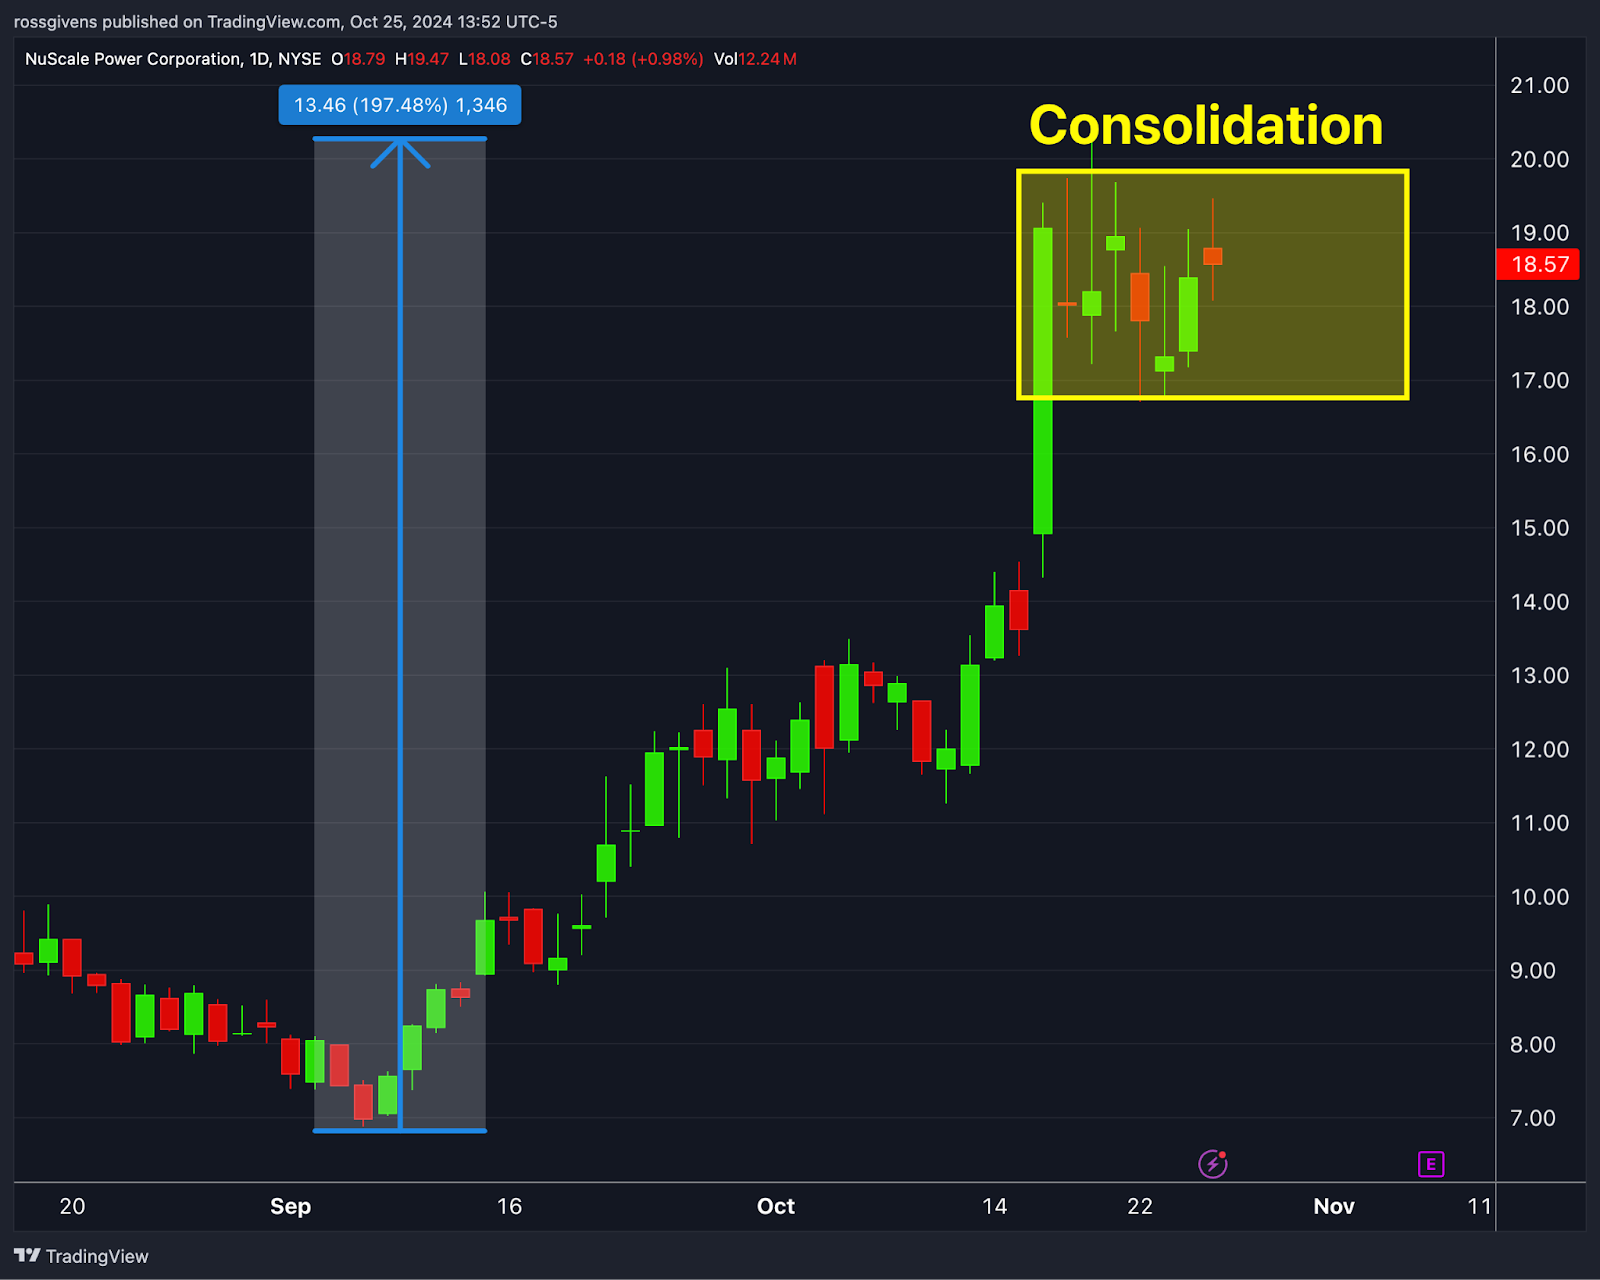
Nano Nuclear Energy (NNE), Oklo (OKLO), and my personal favorite NuScale Power (SMR) all continue to surge higher. SMR is up over 20% this week alone.

The nuclear trade is still on, and investors would be wise to ride that momentum until it slows. As long as these stocks hold above their 21-day moving average, I would continue to hold.

Insider buying has also picked up this week, and I expect to see much more activity in the coming days and weeks. We will continue to scan the database for new Form 4 filings and alert Insider Effect members to the biggest opportunities we see.

Folks, the bull market is in full force. This is not a time to be on the sidelines. Stay long and enjoy the ride.

Best wishes for your trading,
Weekly Update: How the Election Will Affect Stocks

Good evening, and welcome to this week’s edition of Stealth Trades!

Tuesday is election day.

The non-stop media barrage of campaign ads and automated texts asking for contributions will finally come to an end… at least for now.

Given the stark contrast between the candidates, many have asked how the result will affect the stock market. Here are my thoughts…

First, know that the market is a discounting mechanism. All known information is already priced in – so are the assumptions about what will happen next.

Markets move in anticipation of news, not in reaction to it.

Why do you think interest rates fell 1.5% in the months before the Fed finally cut? Investors were “pricing in” the pending cuts.

The same is true with stocks. Market participants have priced in a Trump victory. Sectors that will benefit from his administration have been rising, and those that will be hindered have gone down.

PAVE is the infrastructure ETF. This sector is expected to benefit from a Republican victory, and as such, has risen steadily over the last two months.

Clean energy, on the other hand, is not going to get any favors from the “Drill baby drill” president.

The market knows this, and is pricing that into the clean energy ETF, ICLN:

What causes large moves in the stock market, both up and down, are when these assumptions turn out to be wrong.

If a company reports earnings in-line with expectations, the reaction in the stock’s price will be minimal – even if those earnings are double or triple what they were a year prior.

When you see a large gap the following day, it is because the company reported sales and profits significantly above or below expectations.

This idea is the same whether we are talking about an earnings report, jobs number, inflation report, or any other economic indicator.

Going into November 5, the market expects a Trump victory. If that happens, I do not expect to see much of a reaction in the indexes.

A Kamala win, however, would be unexpected. Wall Street would frantically adjust their models and re-price what they believe to be the fair value of hundreds of stocks. The result would be extreme volatility for at least a week. 

And make no mistake, Wall Street wants Trump in the oval. There is no question that his policies would deliver more benefit for equity markets. He is a pro-jobs president who wants to lower taxes – both personal and corporate, cut regulations, open up energy markets, and cut the wasteful federal spending that caused this record inflation (albeit with Elon Musk’s help).

That is not to say that some areas of the market would not do better under a Kamala presidency.

Clean energy stocks, which we mentioned earlier, would surge if she wins on Tuesday. Other sectors that receive heavy government funding would also trade higher. For the market as a whole, however, I would expect to see an initial negative reaction if Harris wins.

At the end of the day, the United States economy will likely thrive for decades to come. We have had some very good presidents over the years and some very poor ones. But markets have continued to march higher.

Many thought stocks would crash if Trump won. And while they did sell off in the first hour after he won, they came ripping back to record highs until COVID hit.

And take the longest bull market ever which took place from 2009 through 2020. Most of that transpired under a Democrat president. I don’t think he did any favors for corporate America, but investors fared just fine during his terms.

I am heavily long the stock market and will remain so through next week. I suggest you do the same.

Best wishes for your trading,
Weekly Update: Nuclear Stocks Are Soaring

Good evening, and welcome to this week’s edition of Stealth Trades!

All eyes are on nuclear.

If you have been following my updates throughout the year, you know this has been one of my favorite sectors for months now.

I believe nuclear power is the future. My children will likely live to see this country powered primarily by nuclear energy.

The adoption cycle, as it often does, will start at the top – large, cash-rich tech companies will be the early movers and begin generating their own power.

Amazon and Google have both announced deals to do just that.

The trigger for these moves is, of course, the AI boom. Electricity is the major bottleneck for artificial intelligence. Massive data centers the size of 7-8 football fields require massive amounts of power. In most cases, more than the local power grid has to offer.

So, they have to create their own.

Tech companies lean waaaaaay left. Apple doesn’t even offer leather phone cases anymore. They use a vegan product called “FineWoven” that is probably made from tofu diversity. So the power has to come from a renewable source.

Oil, gas, and coal are all off the table. Wind won’t work. There isn’t enough surface area around the data centers for solar to be viable. And most of them aren’t built next to a dam, so hydro is out as well.

The only viable solution is nuclear. It is clean, renewable, efficient, and despite what Hollywood would have us believe – remarkably safe.

The adoption by big tech has spurred huge moves in the stocks of companies who manufacture the small modular reactors they will be using. NuScale Power (SMR), Oklo Inc (OKLO), and Nano Nuclear Energy (NNE) are all soaring.

Once Amazon and its peers have these plants up and running, others will follow suit. I then expect to see residential nuclear power begin to roll out in 5-10 years.

Nuclear stocks are currently in their hype phase. This is when we can see explosive moves of hundreds or even thousands of percent as FOMO pushes investors into the new hot sector.

Take SMR for example…

The stock tripled from September to October. Moves that big are almost always followed by deep pullbacks. But not this one…

It is consolidating in a tight 15% range – just like it did at the end of September. This is not the behavior of a stock that is about to crash. In fact, just the opposite.

Eventually this bubble will burst. These small and medium-sized nuclear stocks will fall back to fair value more in line with their fundamentals. But I’m going to enjoy the ride until that happens.

SMR, NNE and OKLO are the big three. Those are the ones I’m focusing on.

Keep an eye for breakouts from tight trading ranges on above-average volume. That is the trigger to jump in.

Best wishes for your trading,
Weekly Update: The “Harris Trade” is Forming

Good evening, and welcome to this week’s edition of Stealth Trades!

After an ugly 4 days last week, stocks ripped higher to close the week out strong.

Wednesday was especially significant.  

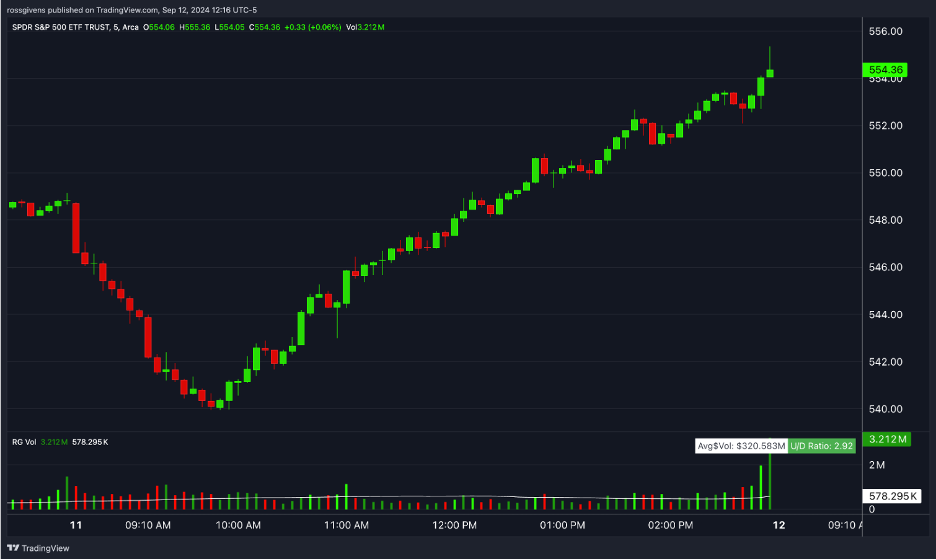
The CPI report showed no drop in inflation – leading to an initial selloff in the market.

But just before lunch, the big boys started buying. What followed was an epic reversal all the way to the close.

The five-minute chart of the S&P 500 above shows the action in detail.

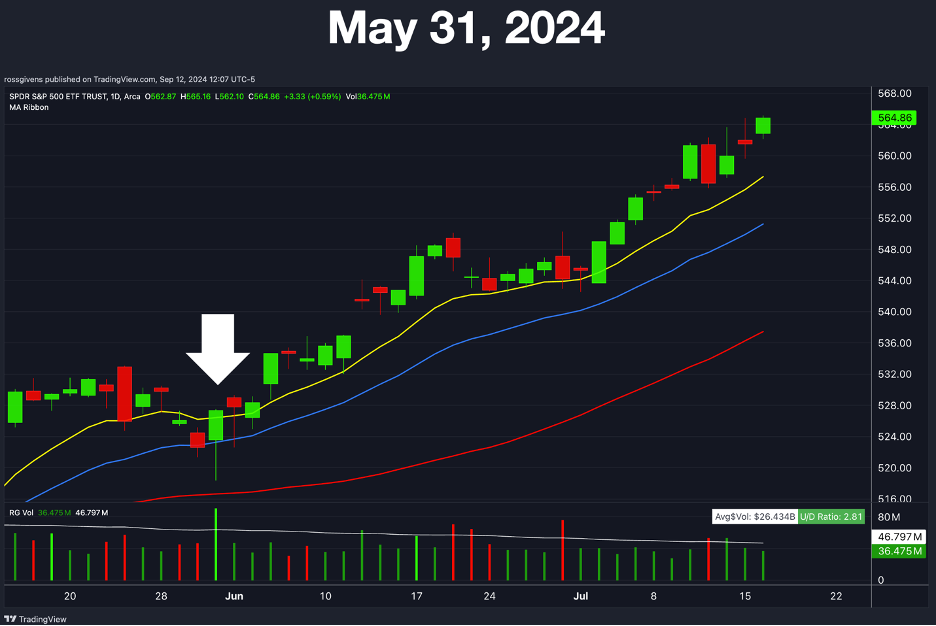
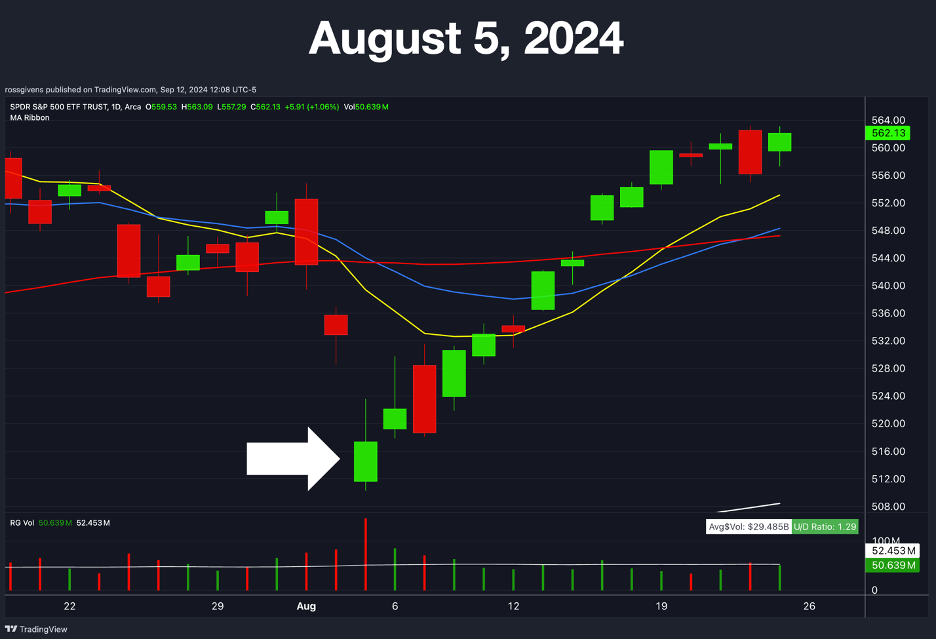
One of the things I look for is anomalous days in the market when stocks rally on bad or mediocre news as this is a strong sign that prices are likely to go higher. Wednesday was just such a day.

We saw similar price action in May…

And again in August…

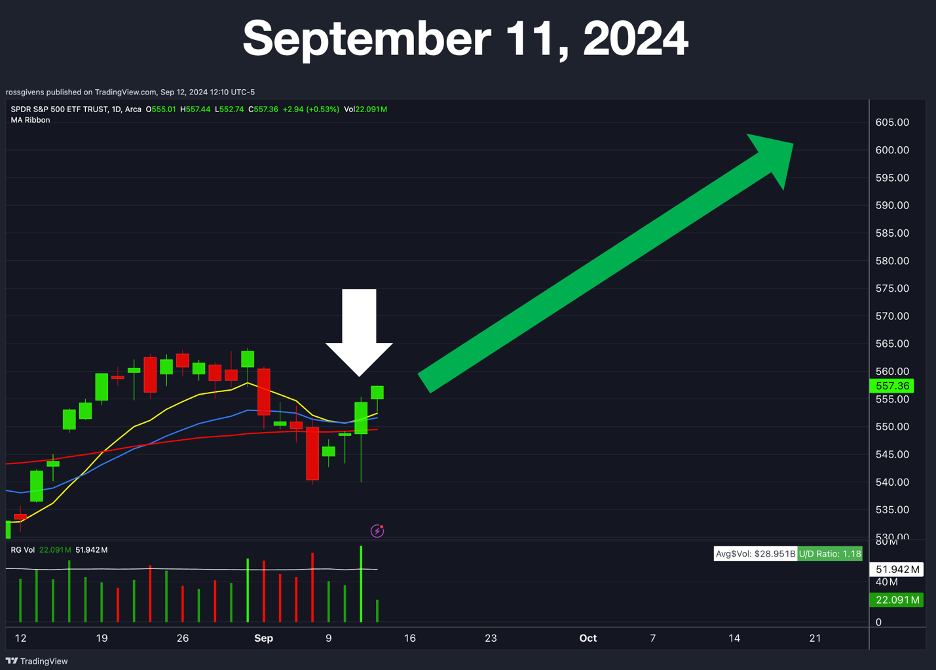
If history repeats itself, this is what we could see leading up to the election:

A lot of investors are focused on the upcoming election. Odds of a Trump victory, which appeared to a foregone conclusion following the assassination attempt, are now around 50/50.

In this week’s presidential debate, Trump was less impressive than in years past and Harris was more prepared than most expected.

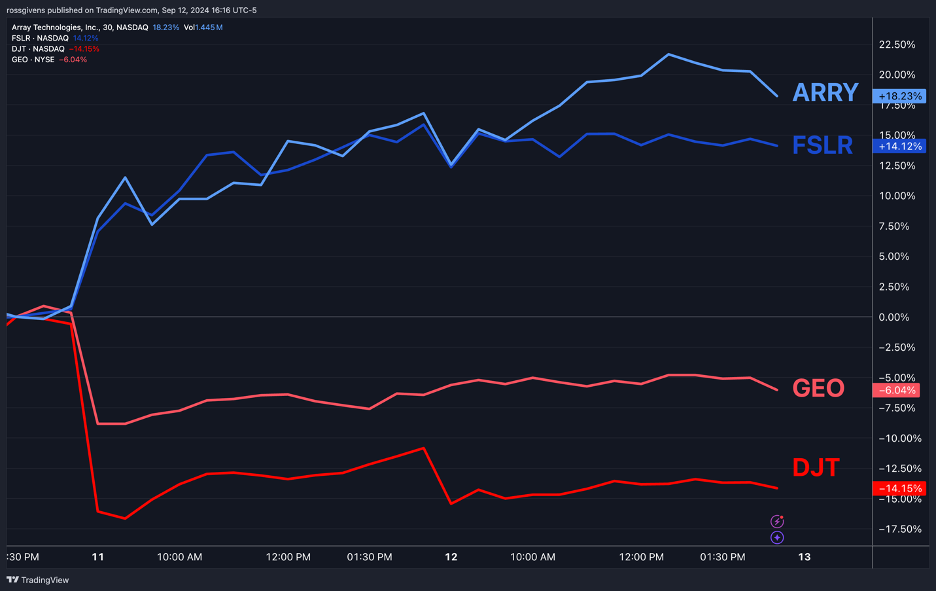
Regardless of your personal views on the event, the stock market gave the win to Harris. Stocks that would have benefited from a second Trump term like Trump Media (DJT) and Geo Group (GEO) – a private prison company, fell the next morning.

Solar stocks like ARRY and FSLR, on the other hand, which would likely benefit from a Harris victory, saw big gains.

The price action of these names following the debate is laid out below.

The “Harris trade” that is beginning to form is in the clean energy space.

Solar stocks have been eviscerated over the last few years, so this is a sector we will continue to monitor for a potential reversal.

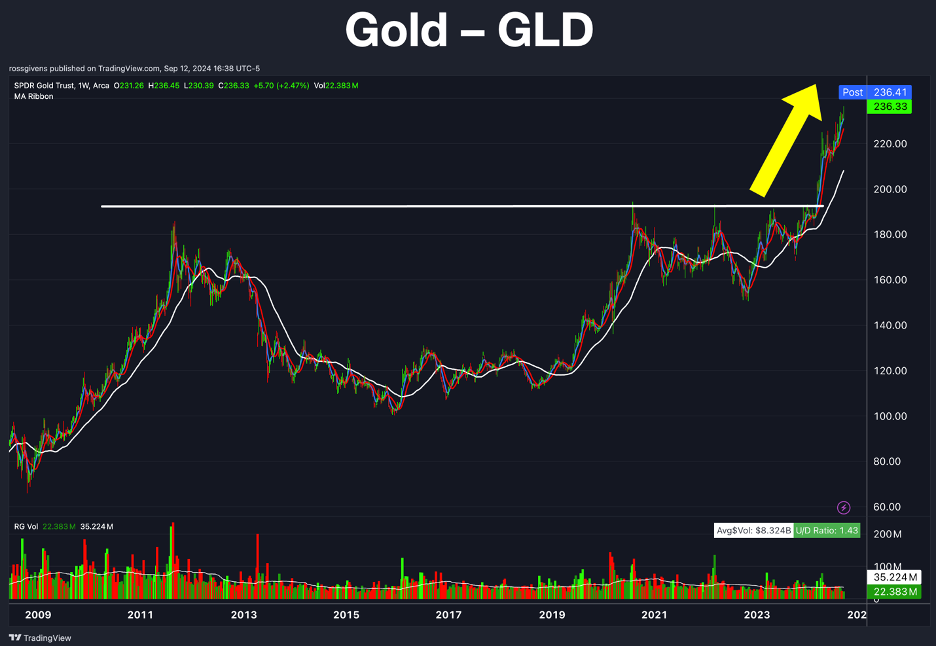
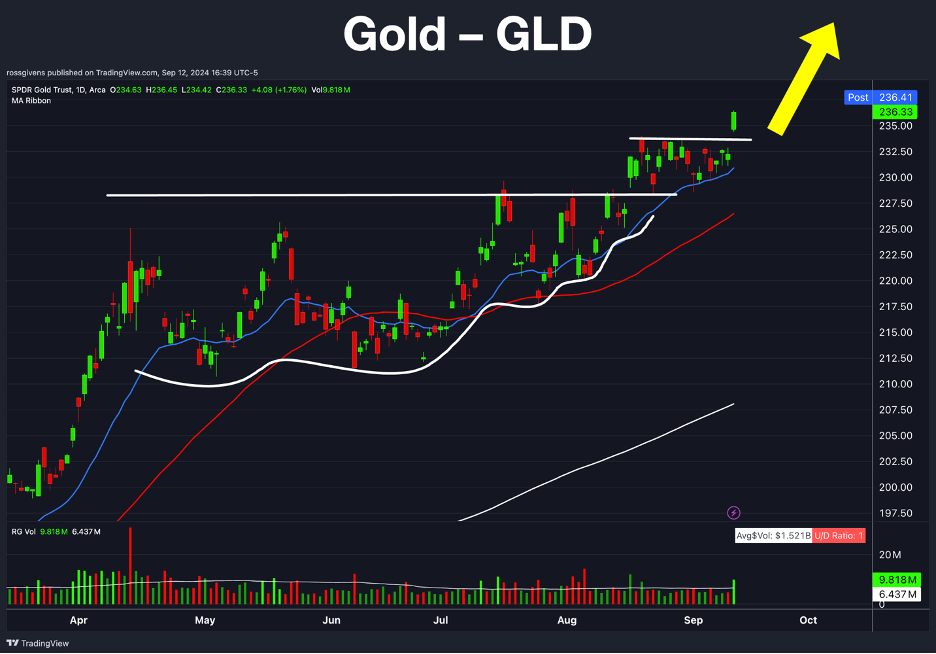
Gold and real estate – two of the areas I have been highlighting for several months – continue to show strength and will likely play out regardless of who wins in November.

Below you can see the decade-long base in gold.

We are seeing a similar pattern on the daily chart:

This “base on base” action is extremely bullish, and I believe gold will reach $4,000-$5,000 per ounce over the next few years.

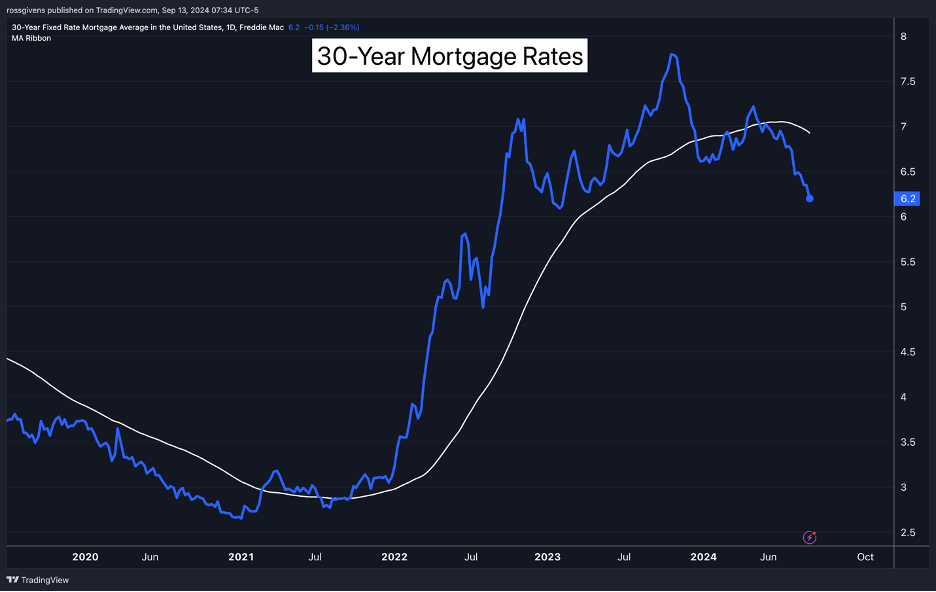
Mortgage rates are also coming down thanks to expectations of aggressive rate cuts in the coming months.

This is likely to fuel a housing boom as 3% mortgage holders may finally come out and play.

If all plays out as expected, we should see 5% mortgage rates by the end of 2025.

As of Friday morning, at the time of this writing, the S&P 500 is less than 1% from making new all-time highs. It is up 17.9% year-to-date.

Until I see evidence to the contrary, I remain bullish.

Best wishes for your trading,
Weekly Update: There’s Blood on the Street

It was not a fun week for investors.

The S&P 500 fell 4.0% and the Nasdaq was down a full 5.5% in the shortened trading week.

This morning, the long-awaited Employment Situation report of non-farm payrolls was released. Although it showed 142k jobs had been added, this was below the 160k consensus estimate.

After last month’s revision lower (fancy way of saying the government lied and overstated the jobs numbers last year), stocks sold off further in response.

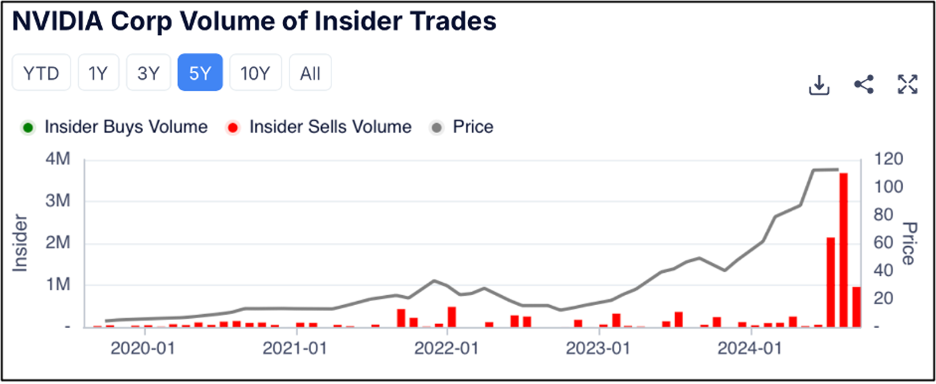
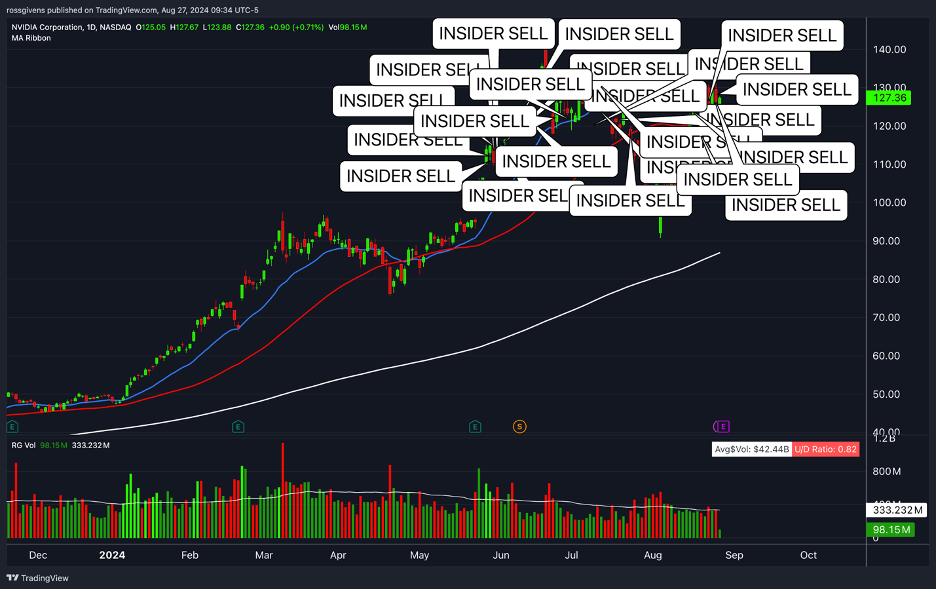
Market leadership took the biggest hits this week. Nvidia, which has been the clear front-runner of the 2023-2024 bull market, is down 21% since reporting earnings last week.

I held several webinars last month warning investors to get out of NVDA after seeing massive selling by company insiders.

The picture was crystal clear.

Hopefully you took our advice and side-stepped the collapse.

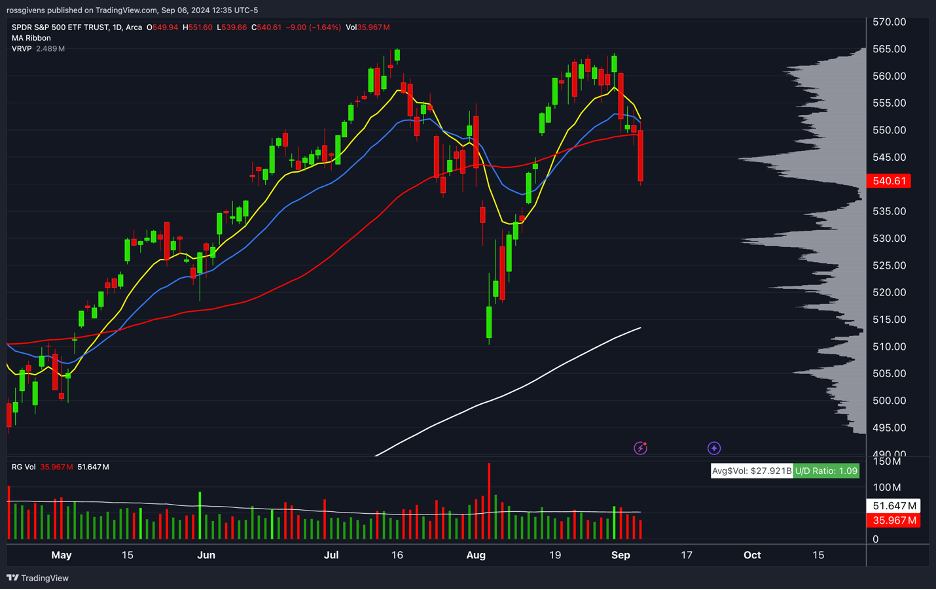
Right now, the S&P 500 is at a critical juncture.

By adding a volume profile indicator to a daily chart of the index, we can see where most of the trading has occurred over the last few months.

Looking at the profile along the right side of the screen, we notice several high and low volume areas on the SPY.

The 545 and 530 levels, for example, show prominent high-volume nodes. These are areas where buyers and sellers tend to meet. They act like price magnets.

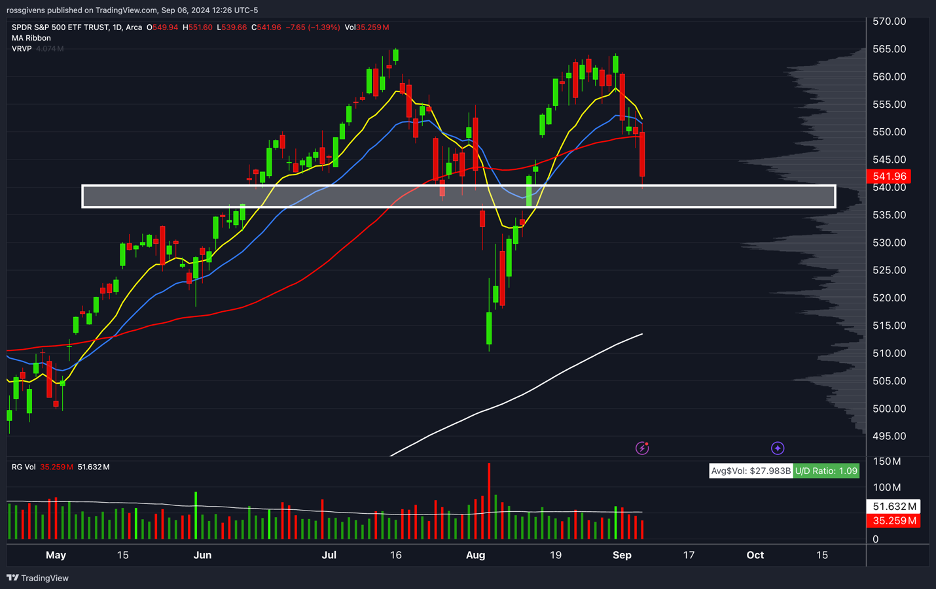
The 538 area, on the other hand, has seen almost no trading activity. I have highlighted this area with a white box on the chart below:

Historically, low-volume nodes like this tend to be either rejected or blown through quickly.

In other words, if the market does not bounce here at the beginning of next week, expect to see the selloff continue.

The only silver lining to this recent selling is the effect it is having on interest rates. Powell was clear in his speech from Jackson Hole last month that the Federal Reserve is reversing course on monetary policy. He all but confirmed a rate cut at the next Fed meeting.

But some traders are now forecasting a potential 50 bps cut.

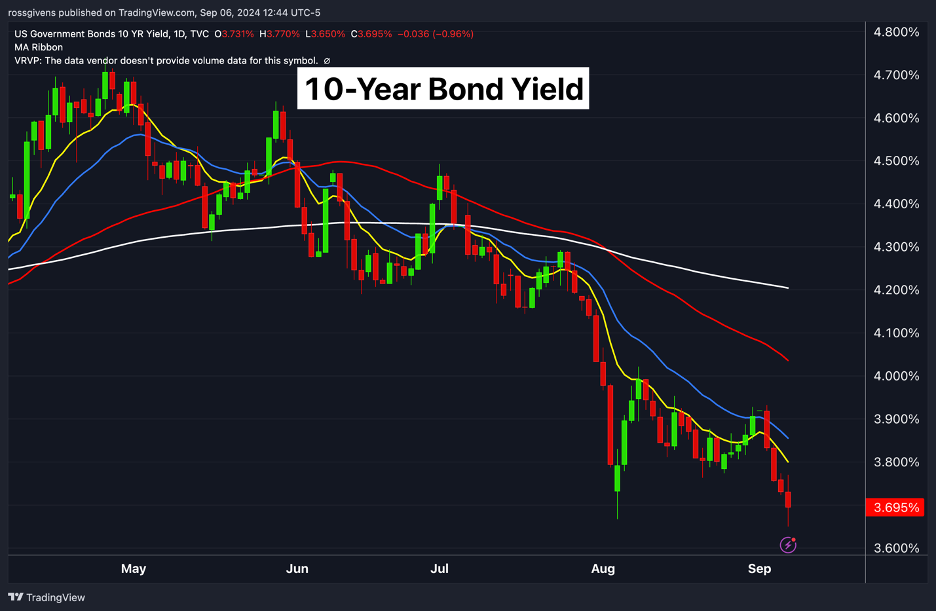
10-year bond yields are falling. In fact, interest rates made new 52-week lows today.

The sector likely to benefit most from lower borrowing rates is construction.

Potential buyers who have been reluctant to move from fear of trading their 3% mortgage for an 8% one can now borrow at around 6%. If the Fed aggressively cuts in 2025, we could see that number fall to 5% which, in my opinion, would spur a huge housing boom.

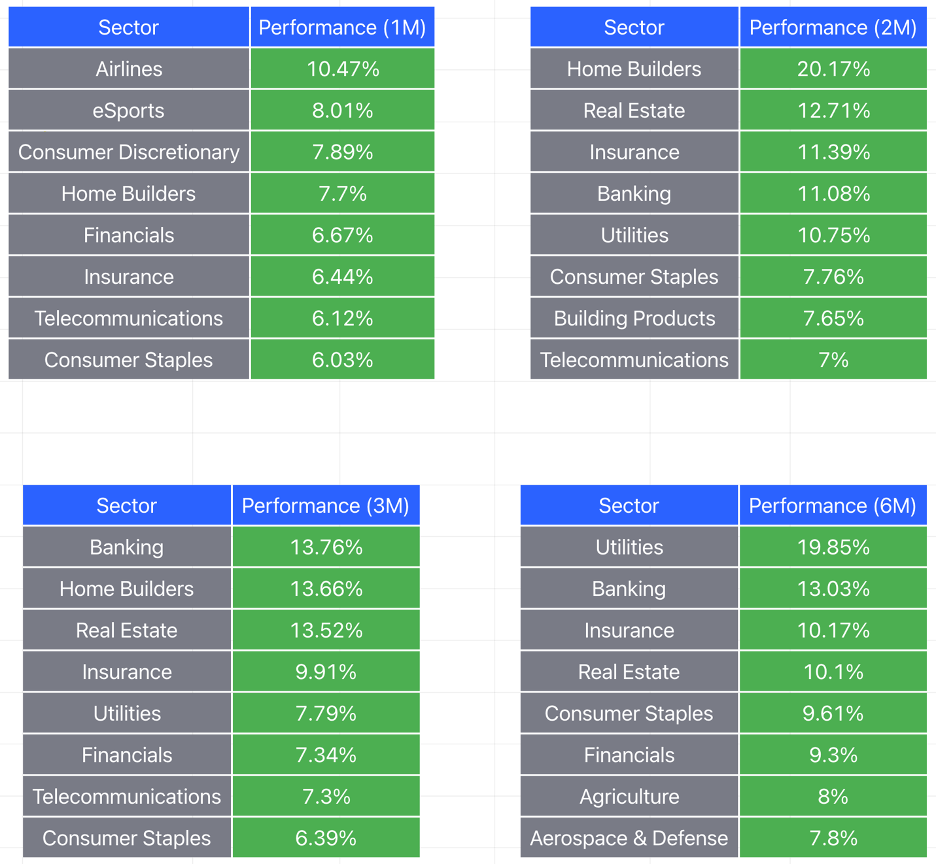
So, it is no surprise that homebuilders – along with related groups like banking, real estate, insurance and building products – are performing best right now.

Real estate has been out of favor for three and a half years, but it could be the trade of the year in 2025.

Best wishes for your trading,
Weekly Update: Market Model Turns GREEN

Good evening, and welcome to this week’s edition of Stealth Trades!
Our market health model has officially flipped back to green – a signal that a healthy bull market is in full effect.

We built this model a little over a year ago. It analyzes both technical and fundamental data to signal when market conditions are healthy or poor.

It’s not perfect. Nothing is. But it keeps us in when times are good and out when conditions are less than ideal.

The market rallied today following Fed Chairman Jerome Powell’s comments at the annual economic conference in Jackson Hole, Wyoming.
“The time has come for policy to adjust,” Powell remarked. “The direction of travel is clear, and the timing and pace of rate cuts will depend on incoming data.”

In other words… It’s time to start cutting.

“We will do everything we can,” Powell said, “to support a strong labor market as we make further progress toward price stability.” By cutting rates, he said, “there is good reason to think that the economy will get back to 2% inflation while maintaining a strong labor market.”

This is what the market has been waiting for – solid confirmation from the head of the Federal Reserve that interest rates are heading down. Powell fell short of hinting at a 50-basis point cut at the next meeting (something I was hopeful for), but the news was bullish for stocks nonetheless.

It was a spectacular day for construction stocks. This is an area of the market I have been talking about for most of 2024. The rally that began in the beginning of the year lost steam after the 6 rate cuts we were promised failed to materialize.

Interest rates are hugely important for homebuilders. A few percentage points in either direction is often the difference between American families being able to afford a mortgage or not.

Here is a quick screenshot from my Construction watchlist on TradingView today:

There are several clean setups in this space – primarily in the big homebuilder and building materials names.

Builders FirstSource (BLDR) pictured below is breaking out from a clean shallowing base.

The nasty dip at the beginning of August was the Japanese Yen fiasco that temporarily rocked international markets. It was a Black Swan type event, so we can ignore it as it pertains to the trade setup.

Generac (GNRC), which manufactures and sells whole-home generator systems, also looks good.

The chart could be cleaner. And without the July 31 Japan shock, it probably would be. This is why it is important to know what is taking place in the markets when evaluating charts.

KB Home (KBH) is a west coast home builder whose stock is also benefiting from the assumption of lower rates going forward.

Notice the strong move through the pivot today.

Mohawk Industries (MHK), pictured below, is breaking out from a textbook flag pattern.

This is one of the most powerful chart patterns in the market, and I will be discussing it in more detail in tomorrow morning’s LIVE presentation. All the details are at the link below.

CLICK HERE TO REGISTER

Nothing is guaranteed. But right now, both the technical and fundamental picture point to one thing – higher stock prices over the rest of the year.

There will be lots of opportunities in several areas. But construction-related stocks are, in my opinion, the low-hanging fruit here.

Get ready for a new housing boom.

Best wishes for your trading,