Weekly Update: The $3 Trillion Agentic AI Trade

Good evening, and welcome to this week’s edition of Stealth Trades!

I don’t need to tell you that artificial intelligence is the big theme of the stock market. It has been since 2022. But that theme is rapidly evolving.

On May 7th, Anthropic’s Claude Cowork was introduced to Microsoft Office. It is now living inside Excel, PowerPoint, and Word. Generally available. Not a demo. Not a waitlist. 

It is embedded in the three apps that 1.4 billion office workers open every single morning.

Microsoft’s already there too. Copilot has around 20 million paying users, and they rolled out a new Office bundle on May 1st.

And here’s why that’s a bigger deal than it sounds… 

Up until a few months ago, “using AI at work” meant you were a developer writing code in something like Cursor. That’s maybe 25 million people on the whole planet. 

Now? 

AI is about to operate the actual software that over a billion knowledge workers use to do their jobs.

It is a major inflection point.

And few people understand what agentic AI is about to do to global computing demand.

This is a completely different animal than the chatbots you’ve been using.

And there is a basket of stocks that quietly power this entire build-out. Some of these you have never heard of. 

WHY AGENTS BREAK THE OLD MATH

If you haven’t started playing with all the fancy AI tools yet, there’s something you need to understand – an AI agent is not a chatbot.

When you ask ChatGPT a question, that’s quick. It doesn’t use a lot of compute power. But AI agents are different beasts.

Compute is measured in tokens which are just little units of compute.

A developer running a focused 30-minute coding session burns somewhere around 50,000 to 200,000 tokens.

Now compare that to a user like me doing financial research.  

I might ask an agent to analyze the nuclear power ecosystem, analyze every publicly traded company in the space, reconcile a 200-row file and compare it to industry comps, write a full email summary, and build a 40-slide deck from the information. All from one command. 

That single task burns 800,000 to 2 million tokens.

Now… multiply that by 1.4 billion office workers. 

Microsoft has already said over 80% of the Fortune 500 has rolled Copilot out to be part of their workforce. The load this puts on the system makes everything that came before it look like a rounding error.

And the infrastructure to handle it does not exist yet.

A chatbot session is short, GPU-heavy, and low-context. An agentic session is the opposite — it runs for hours, it constantly does things, and it leans on CPUs, memory, and GPUs all at once. 

The server CPU-to-GPU ratio has already shifted from 1-to-12 in the old training builds to 1-to-2 in these new agentic builds.

That means a whole pile of components nobody was talking about — CPUs, memory, storage, power chips — just became mission critical. The picks-and-shovels layer just got a massive promotion.

That’s why stocks like Sandisk and Micron are going vertical right now.

SURGING TOKEN DEMAND

According to Goldman Sachs’s models, consumer and enterprise agents will push monthly token consumption to roughly 24 times the entire world’s current capacity by 2030.

And in that same report, Goldman noted that quote “token economics turn positive in the first half of 2026.” That’s the moment an agent’s output is worth more than what it costs to run it. 

And once that flips, every company on earth has to deploy agents just to stay competitive. 

Right now, agentic AI is still more hobbyist tinkering than full commercial deployment. The second it pays for itself, adoption goes vertical — months, not years.

And get this — we are still ridiculously early. The latest estimates say about 78% of humanity has never used a single AI tool. Not once.

THREE U.S. STOCKS YOU CAN BUY EASILY

Unfortunately, a lot of the best names in this stack trade overseas. But I know most of you want something you can buy in the account you already have, without jumping through hoops. So, here are three US-listed stocks that each own a different layer of the agentic build — CPUs, memory, and storage.

STOCK #1 — ARM HOLDINGS (ARM)

This is the toll booth. When a hyperscaler builds its own custom AI chip — Amazon’s Graviton, Google’s Axion, Microsoft’s Cobalt, Nvidia’s Grace and Vera — almost every one of them is built on Arm’s architecture. And Arm collects a royalty on each and every chip. 

They don’t care who wins the design war between Amazon, Google, and Microsoft. They get paid either way. 

STOCK #2 — MICRON (MU)

Remember what I told you about agentic AI? Agents run for hours and they’re hungry for memory — that’s where all the context lives. Micron is the only US-listed pure-play in high-bandwidth memory, the stuff that sits right next to the GPU. 

And guess what? Their entire 2026 HBM production is already sold out. The whole year. The stock has gone parabolic. It is unquestionably extended. But it’s hard to price a company selling out a year of capacity in advance.

STOCK #3 — SEAGATE (STX)

Agents generate mountains more data than chatbots ever did, and all that data has to live somewhere. Seagate is one half of the hard-drive duopoly, and for the first time since 2017 they’ve got real pricing power — capacity reportedly sold out through year-end. 

If you want the storage layer of this trade, this is the easy US way to play it. 

And if you want to go deeper into storage, its duopoly partner Western Digital, ticker WDC, and the NAND spin-off SanDisk, ticker SNDK, are other options.

INTERNATIONAL STOCKS

If you have an account somewhere like Interactive Brokers that lets you trade global markets, you might also consider some of these:

  • Tokyo Stock Exchange 
  • Renesas (ticker 6723) – power-management chips
  • Nitto Boseki (ticker 3110) – 70% glass-cloth monopoly 
  • Murata (ticker 6981) – leading capacitor maker
  • Kioxia (ticker 285A) – freshly-IPO’d NAND play
  • MEC (ticker 4971) –  microetching chemicals
  • Taiwan Stock Exchange: 
  • Global Unichip (ticker 3443) — TSMC-backed design house
  • Hon Hai, better known as Foxconn (ticker 2317) – server assembly and humanoid robots  
  • Lotes (ticker 3533) – sole-source CPU socket maker
  • Unimicron (ticker 3037) – substrates 

MY CONCLUSION

The Nvidia trade is the one everyone already made. The company is worth $5 trillion now. It’s up 1,600%. The move already happened. 

But the agentic AI trade — the memory, the storage, the substrates, the sockets, the power chips — is the one investors are finally waking up to.

Some of these stocks are already up big. But so was Nvidia a couple years ago, and it doubled three more times.

Best wishes for your trading,

Weekly Update: The Energy Trade is in Full Swing

Good evening, and welcome to this week’s edition of Stealth Trades!

In Q3 2025, I alerted readers to two major themes that I believed would lead the market over the next 12-18 months – metals and energy.

The metals trade played out quickly. Silver and gold saw huge gains. Steel, aluminum and copper will likely continue pushing higher. These are the physical materials behind every AI data center and infrastructure project across the globe.

The other big idea was energy.

The AI buildout has exposed just how underpowered the US is. Data center demand for power is skyrocketing. We are seeing a 10X increase in electricity use every 2-3 years from them.

The existing grid, obviously, cannot handle the load. It couldn’t deliver the electricity needed even if we did have it, which we don’t.

This has created massive demand. Hundreds of billions, probably trillions of dollars will be invested in energy infrastructure over the next decade. And the stocks in the middle of that money flow will see their share prices surge.

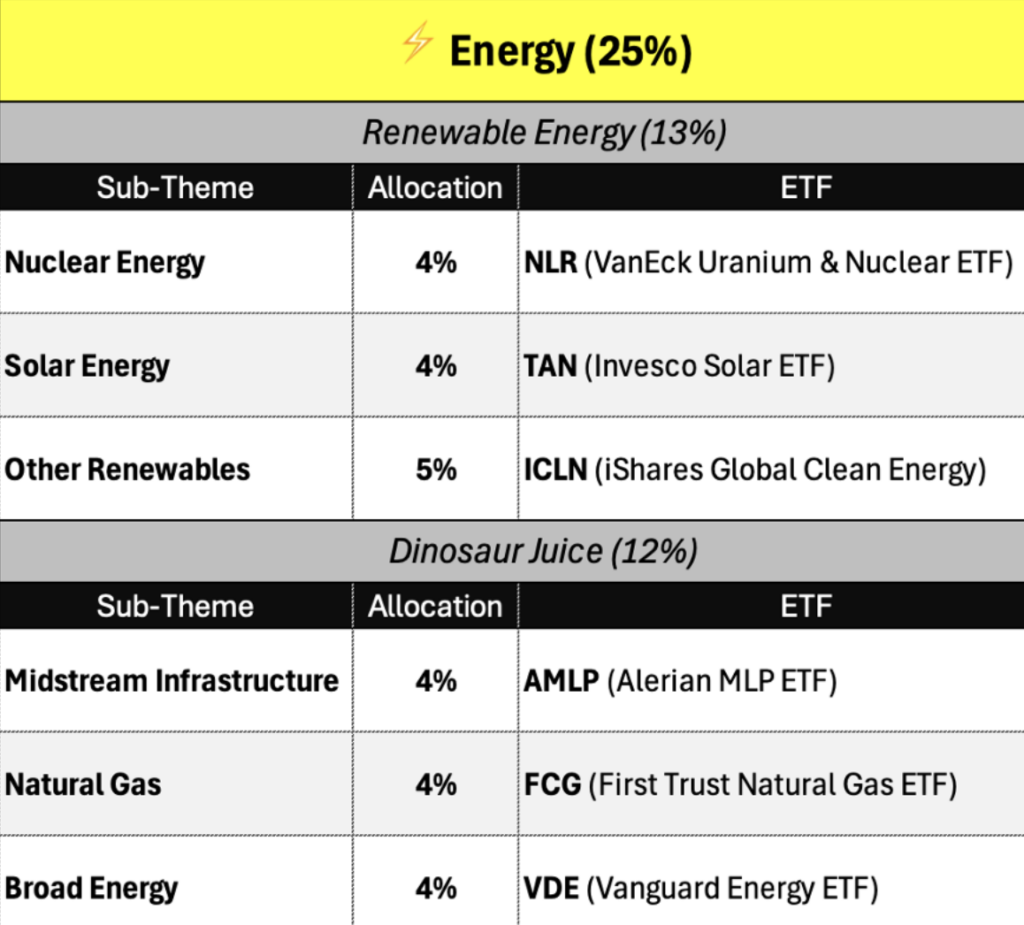
I have 25% of my retirement account allocated to energy. Here is what I own:

As you can see, my exposure is split between traditional oil/gas and renewables via 6 exchange-traded funds. 

I won’t pretend I can predict which power source will dominate. So I’m betting on all of them.

In late 2025, nuclear stocks led the pack.

This year, my Vanguard Broad Energy ETF is up over 30%.

Solar is up 42% since last month.

In my opinion, this is just the beginning. I expect to see $200 crude before the year is over. Utilities will likely continue to escalate megawatt pricing. And the winning nuclear names could run 5-10x from today’s share price.

The nice thing about these longer-term thematic plays is they are set-it-and-forget-it investments. Unlike most of my more active trades, this anchor portfolio is allocated to dominant themes that I believe will outperform over the next few years. But there’s plenty of diversification to soften the day-to-day swings around things like trade wars and geopolitical uncertainty.

I have another 25% allocated to metals – a mix of precious and industrial ETFs. Then 40% in a handful of equity indexes and 10% dedicated to hard assets.

I’m not saying this is the right allocation for everybody. But this is where I see the best mix of opportunity and safety in the coming years. 

Best wishes for your trading,

Weekly Update: The New “High Tight Flag” Trade Setup

Good evening, and welcome to this week’s edition of Stealth Trades!

As traders, we want to be in the stocks with the highest momentum. Many of these stocks will be making new highs.

One question I get a lot is, “Ross, this thing has already doubled. Isn’t it too late to buy?”

I don’t like to chase stocks. After a 50%+ move, the likelihood of a pullback is significantly higher. 

The smarter move is to learn the chart pattern that tells you exactly when to enter an extended name — and when to sit on your hands.

This week I’m going to walk you through that pattern. It’s one of the most powerful momentum setups in trading. And it is the result of combining two legendary methodologies — Bill O’Neil’s original High Tight Flag from the 1980s, and the modern variation that Swedish trader Kristjan Kullamägi used to turn roughly $5,000 into over a $100million.

Let’s get into it.

Most retail traders blow up the same way. They watch a stock run 40, 50, 80 percent. Then they give in to FOMO and buy at the top — right before it pulls back 20 percent and shakes them out at a loss.

This isn’t bad luck. It’s the wrong entry method.

There’s a specific kind of chart action that tells you a stock has more upside left — and a different kind that tells you the move is over. The framework I’m about to share lets you tell the difference. And it works whether you’re trading a $90 million micro-cap or a trillion-dollar mega-cap.

Bill O’Neil — founder of Investor’s Business Daily — spent fifty years cataloging the biggest winning stocks in history. He found that before the very best names made their biggest legs higher, they almost always formed the same chart pattern.

He called it the High Tight Flag.

The textbook version:

  1. The stock advances 100 percent or more in 4 to 8 weeks. That’s the “high” — a powerful, fast move that shows real institutional buying.
  2. Then it pulls back no more than 25 percent off the highs. That’s the “tight” — small, controlled pullback, not a crash.
  3. It consolidates sideways for 3 to 5 weeks.
  4. It breaks back out on volume — and the next leg starts.

O’Neil considered this the single most powerful pattern in the entire stock market. When it forms cleanly, it’s been responsible for some of the biggest winners in history — Cisco in the late 90s, Apple in 2004, Netflix in 2013.

The problem? 

In today’s market, the textbook version rarely forms cleanly. 

Cycles are faster. 

News-driven gaps are bigger. 

Tight 3-5 week flags have been replaced by 5-10 day pullbacks that don’t qualify under strict O’Neil rules.

That’s where the modern variation comes in.

Kristjan Kullamägi — @Qullamaggie on Twitter — is a Swedish trader who turned roughly $5,000 into over $100 million between 2011 and 2020. 

His entire journey is documented.

And while he has become reclusive over the last five years, he documented much of his methodology in live trading sessions you can still find online.

And one of his core setups is a direct descendant of O’Neil’s High Tight Flag — updated for modern market structure.

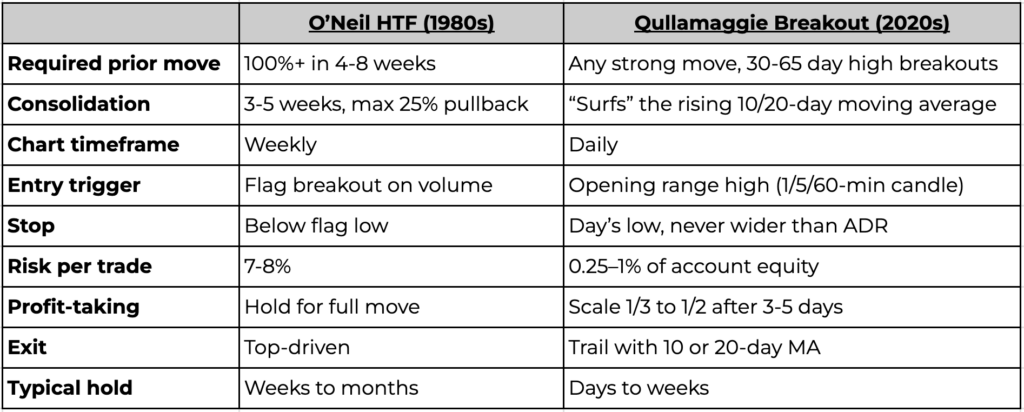
Here’s a head-to-head comparison of their rules:

Qullamaggie’s version is more flexible, more disciplined on risk, and better suited to the algo-driven, news-gap-heavy market we trade in today.

But the full Qullamaggie execution — opening-range entries on the 1-minute candle — isn’t realistic for a lot of you who can’t watch screens at 9:30 AM Eastern every day.

So, here’s a hybrid version…  

The Setup

The stock must have had a strong recent advance. I look for names breaking out to 30-60 day highs. Doesn’t need to be O’Neil’s strict 100% in 4-8 weeks — but the bigger the prior move, the better the eventual breakout tends to be.

Look for stocks showing real signs of strength: up 30%+ in the last month;  new all-time highs after a big run; a big earnings gap that takes the stock to new highs; a breakout from a long base on heavy volume.

Ignore stocks that are not showing high momentum right now. This would be things like stocks chopping sideways for a year and barely ticking up to new highs or a dead cat bounce off of multi-year lows. 

The Flag

After the run, Qullamaggie looks for the stock to “surf” its rising 10-day or 20-day moving average. That’s the modern tight consolidation that took place of O’Neil’s “flag.”

If the stock closes below its 20-day MA on heavy volume or pullback exceeds 25% from the recent high, the trade is broken. Don’t buy it.

The Entry

You’re looking for a breakout close above the consolidation high. So, on a daily chart, you want to see the stock end the day above the consolidation zone confirmed by above-average trading volume for the day.  

Qullamaggie trades them with an opening range breakout entry – something I have demonstrated in our live Monday training sessions. But if you’re not trying to get fancy, just wait for the stock to close above that high and buy at the open the next day.

The Risk

This is the hardest part of trading. And it is what separates traders who survive from traders who blow up. 

Stop loss: Below the flag low (the lowest closing price during the consolidation).

Position sizing: Calculate your size so that if your stop is hit, you lose no more than 1% of your account on the trade. Starting out, consider running closer to 0.5%. Qullamaggie was averaging around 0.25%, but he’s an absolute pro. And he admitted to risking more when his account was smaller.

If that stop is too large, put it at one ADR. ADR stands for average daily range. It tells you how much a given stock moves from high to low each day on average. If the breakout is real, it should not violate this.

Profit Taking

Sell 1/3 to 1/2 of the position after 3-5 days of strength. Move your stop on the remaining shares to breakeven. Use the 20-day moving average as your trailing stop on the rest.  When the stock closes below the 20-day SMA, sell it the next morning.

Potential Setup 

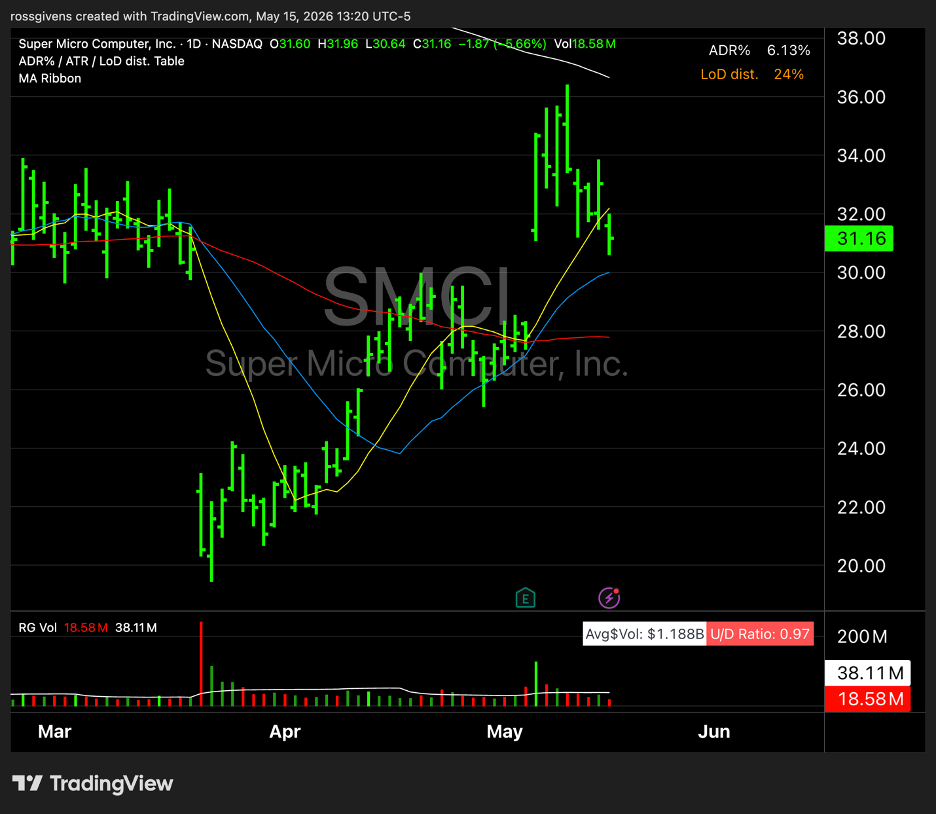
One stock setting up in this pattern today (and there are many) is Super Micro Computer (SMCI).

This was $120 stock two years ago. Today it trades for a quarter of that. But it just finished an 80% run in 7 weeks.

Here is the daily chart. Note the 14% pullback in between the 10-day (yellow) and 20-day (blue) moving averages.

If the stock breaks out and closes above $36 on higher-than-average volume, that would be your buy signal.

A  6-7% stop loss would handle the risk, and you’d look to sell half the position after 3-5 days.

This may or may not trigger. But semiconductors are the leading group in the market, and this stock has a lot of room above it.

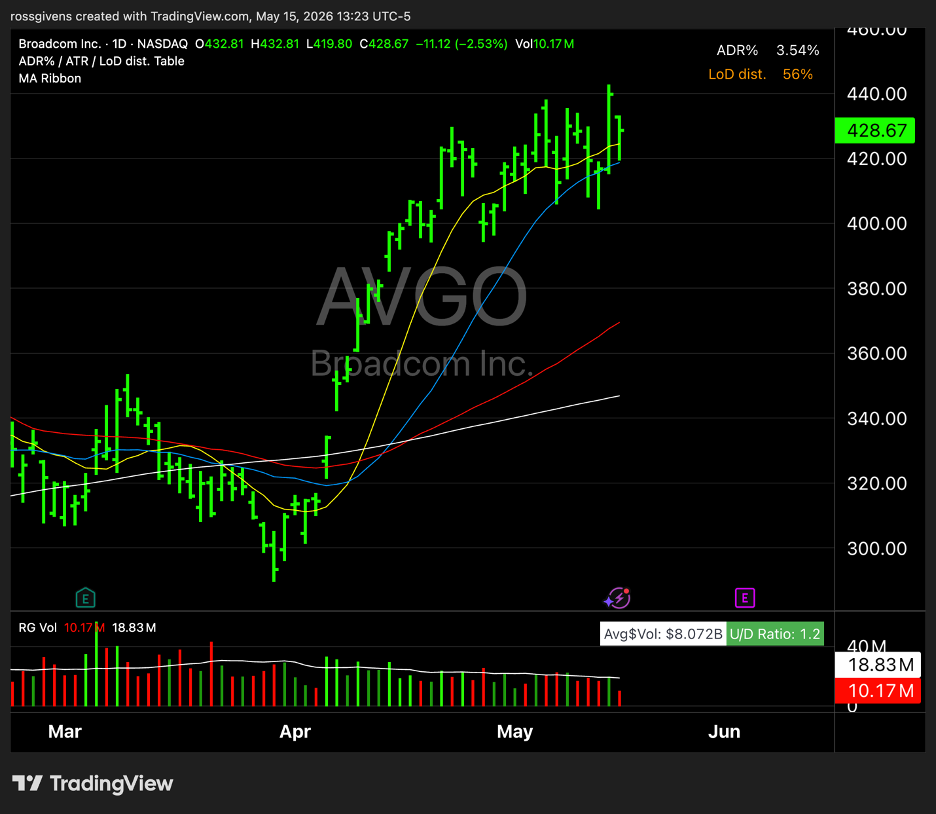
Broadcom (AVGO) is another one that could trigger soon.

Hopefully this setup helps you trade some of these big movers.

I’ll be on our live mentoring session Monday at 9am ET. We can walk through these setups in real time. Bring your watchlist.

Best wishes for your trading,

Weekly Update: Copper Is on the Move

Good evening, and welcome to this week’s edition of Stealth Trades!

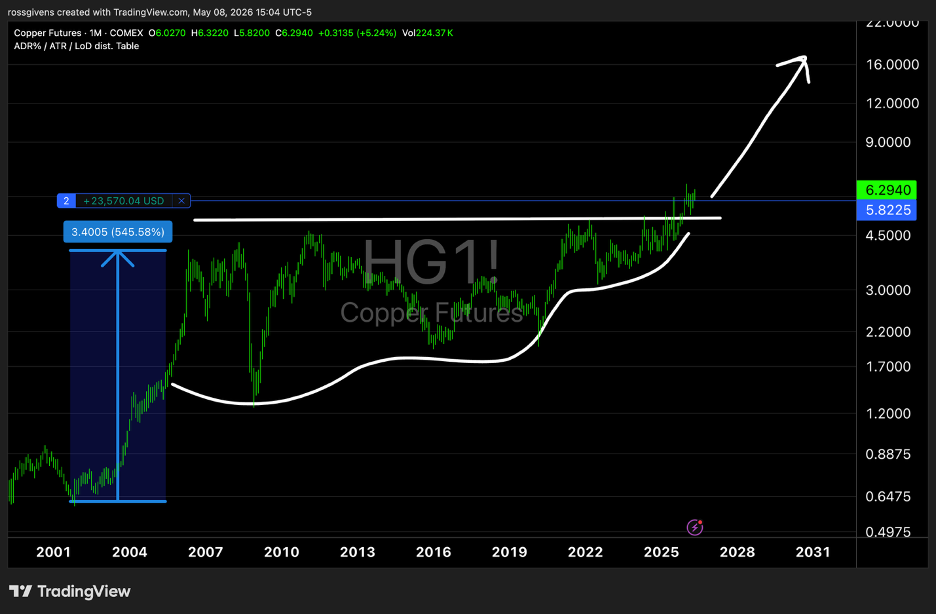
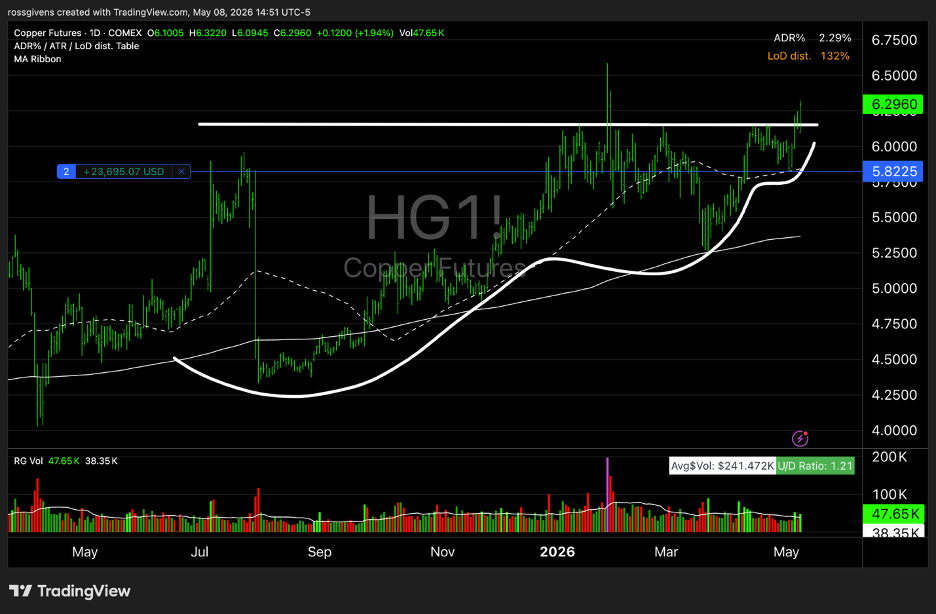
After a long consolidation period, copper is finally breaking out and pushing higher.

Copper is a crucial element in the AI data center supply chain. Without it, America’s dreams of artificial intelligence domination never materialize.

There’s just one problem…. 

We don’t have enough of it. And supply is projected to come up short by 25 over the next 5-10 years. 

This is creating a real crisis, and potentially a huge opportunity for investors.

I have been long copper since the start of the year. This, to me, is one of the big asymmetric investment opportunities of the decade.

Because this is not an easy problem to solve. It takes 15 to 20 years to bring a major copper mine online. If we started today, they wouldn’t produce meaningful copper until the late 2030s.

Plus, the easy copper is gone.

Grades that were once 5% are now 0.5%. We’re moving mountains for slivers of metal.

And it’s not just AI infrastructure driving up demand. We’re electrifying everything.

An EV uses three to four times more copper than a gas car.

Wind turbines use four to five times more copper per megawatt than coal.

Meanwhile, the power grid itself is ancient. The US is investing over $400 billion upgrading it.

By 2030, grid demand alone could reach 15 million tons of copper.

Today, copper is worth just over $6 per pound. I expect to see at least $20 a pound in the coming years.

And if that sounds over the top, it’s not. If anything, it is a conservative estimate.

Copper prices soared over 500% in the early 2000s. Since then, prices have gone essentially nowhere – 20 years of stagnant commodity prices.

But that is likely about to change…

Those wishing to get exposure to copper have several ways to do so.

If you’re looking to go in with size, futures contracts (HG) are 25,000 pounds apiece.

An easier way is to buy the US Copper Index Fund, ticker CPER. This is direct commodity exposure for about $38 a share.

You could also buy copper mining stocks. COPX is the symbol for the Global X Copper Miners ETF. It contains a basket of copper mining stocks that will benefit from higher copper prices.

Either of these ETFs would make a great long-term hold in my opinion.

Best wishes for your trading,

Weekly Update: The $3 Stock Riding the SpaceX Momentum

Good evening, and welcome to this week’s edition of Stealth Trades!

SpaceX is about to go public. Everybody knows it. Everybody wants in. And everybody is asking the same question — how do I get a piece of this before the IPO?

I’ve covered backdoor SpaceX plays before on my YouTube channel. 

But today I want to show you something different…

You see, when an investment theme is red hot like this, investors want anything attached to it. And there is small stock – one directly linked to SpaceX – that most people have never heard of. And this company is deeply embedded in SpaceX’s infrastructure. So much so that Starlink literally doesn’t work without it.

And you can buy it right now. Today. For about $4 a share.

The company is Filtronic. It trades on the London Stock Exchange under the ticker symbol, FTC. And I want you to understand what makes this stock so valuable.

THE BOTTLENECK NOBODY TALKS ABOUT

Starlink has over 7,000 satellites in orbit right now. There are more going up every week. Millions of subscribers around the world are getting high-speed internet beamed down from space.

But all that data in space is worthless if you can’t get it down to Earth fast enough.

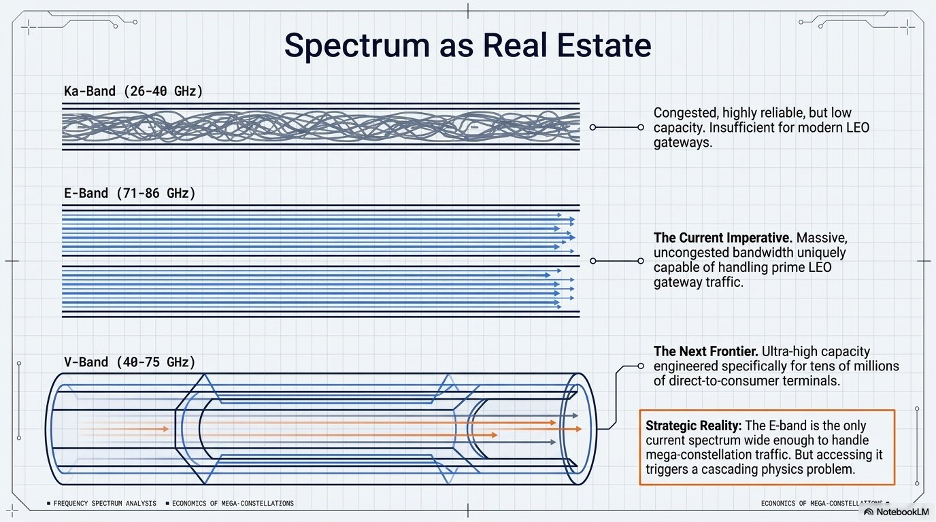
That’s the bottleneck – the ground gateway – a massive dish on the ground that talks to the satellites. And the way you punch massive amounts of data through the atmosphere, through clouds, through weather is by using a very specific radio frequency called E-band.

E-band is the only frequency with enough spectrum (bandwidth) to handle the sheer volume of data a mega-constellation like Starlink generates. There’s no substitute. 

But there’s a problem with E-band… 

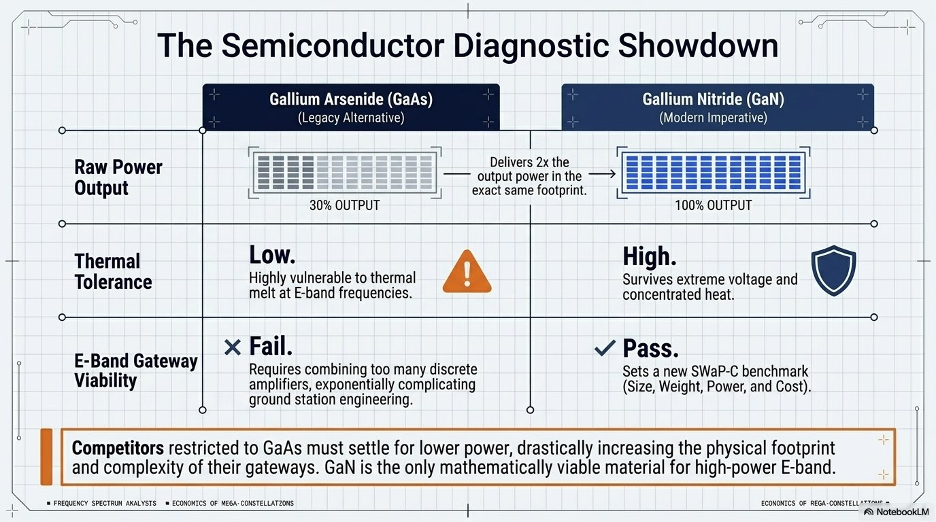
The signals are incredibly susceptible to weather and atmospheric interference. To punch the signal through, you need extreme power. 

Old semiconductor technology — Gallium Arsenide — can’t generate enough. 

You need the newer, more powerful material: Gallium Nitride, or GaN.

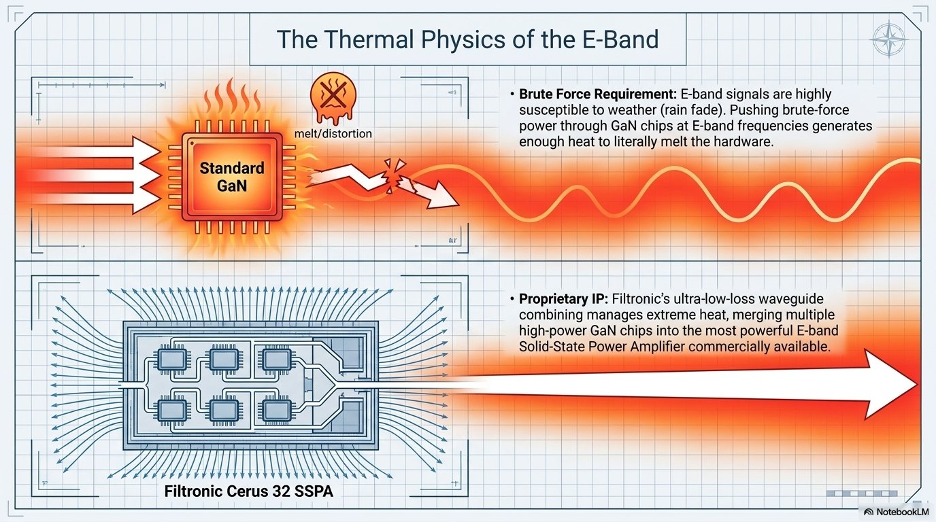
And here’s where physics turns into a nightmare. When you push that much power through GaN microchips at E-band frequencies — they generate enough heat to literally melt themselves.

This is one of the hardest engineering problems in the entire satellite industry. You have to take multiple high-power GaN chips, combine their output into one massive beam, and package it in a way that manages extreme heat without degrading the signal at commercial scale and at competitive prices.

For years, nobody could solve it.

And then a small British company figured it out.

You’ve probably never heard of it. Most American investors haven’t.

Filtronic is based in Sedgefield, England. They design and manufacture ultra-high-frequency radio components — specifically in the millimeter-wave frequency range that satellite constellations, defense systems, and 5G infrastructure all depend on.

Their flagship product is called the Cerus 32 — currently the most powerful E-band Solid-State Power Amplifier commercially available anywhere in the world.

It solves the melting problem. They hold the proprietary IP. They have the manufacturing skills. And right now, SpaceX occupies every production line they have.

Yes,  SpaceX has filled Filtronic’s entire factory.

THE MONOPOLY

Filtronic currently holds what is effectively a commercial monopoly on the specific intersection of three things: high-power, E-band frequency, and Gallium Nitride solid-state power amplifiers. Nobody else is doing all three at commercial scale.

What does that mean for SpaceX’s competitors?

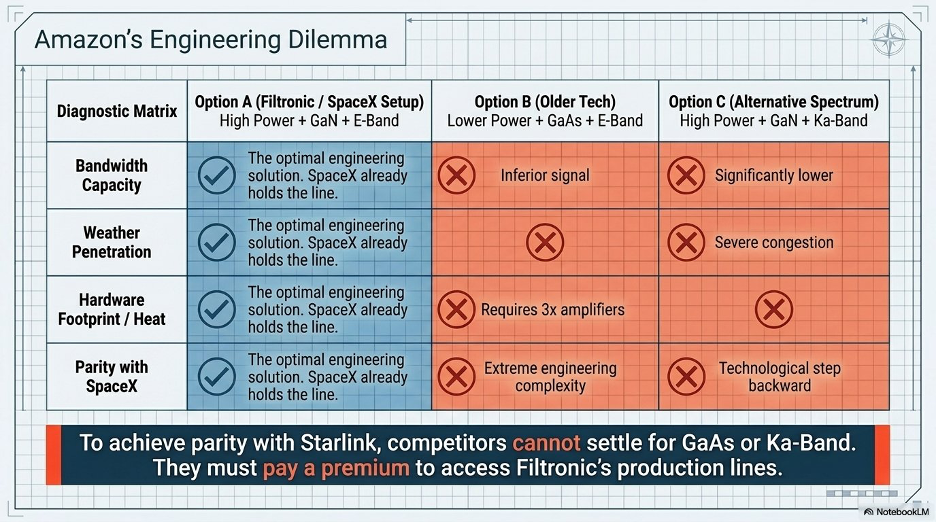
Take Amazon. Amazon is building its own LEO satellite constellation called Kuiper — a direct Starlink competitor. Amazon needs the same E-band ground gateway technology to make Kuiper competitive.

Their options? They can use older, weaker Gallium Arsenide amplifiers — but that puts them at a severe disadvantage against Starlink’s signal strength. Or they can stay in Ka-band, which is congested and limited. Neither option is good.

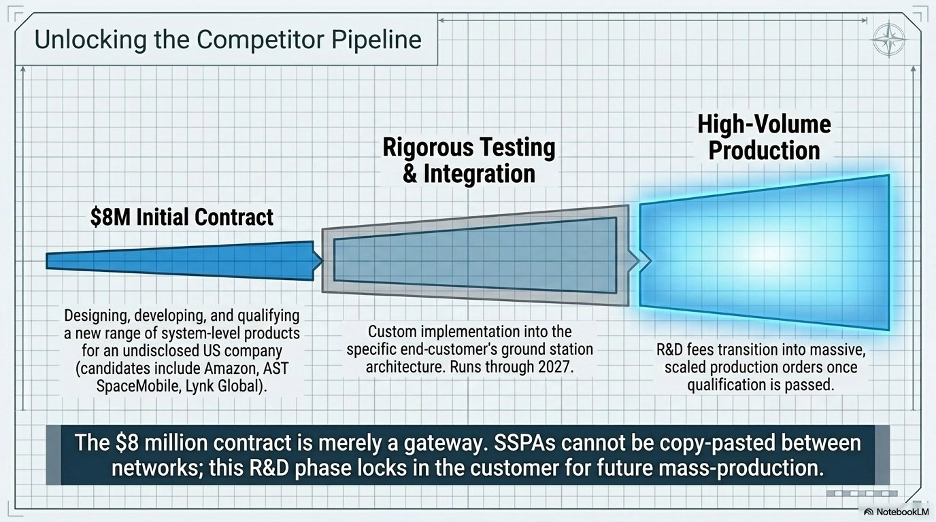
The most likely outcome: Amazon pays whatever Filtronic charges to get access to a production line. And analysts have noted that Filtronic’s recently announced $8 million contract with an undisclosed US company could be exactly that — a development deal with Amazon, AST SpaceMobile, or another Kuiper-tier player.

But that $8 million is just the qualifying round. It will be the productions contracts that really move the needle.

THE SPACEX PARTNERSHIP 

Here’s something else you might find interesting…

SpaceX didn’t just become Filtronic’s biggest customer. Elon is being strategic. There is a formal equity warrant agreement built into the deal.

SpaceX has been granted warrants — essentially options to buy shares in Filtronic — tied to commercial milestones. 

As SpaceX places orders and Filtronic delivers product, SpaceX can acquire up to 15% of Filtronic’s total shares.

So, SpaceX has a financial incentive for Filtronic to succeed and increase in value, making them structurally aligned.

And it gets better… 

The original deal was for E-band. But SpaceX then came back and effectively said: we want you to take this same GaN technology and engineer it for the other frequencies we plan to use in our next-generation networks.

SpaceX is funding Filtronic’s R&D. SpaceX already has FCC approval to launch thousands of next-generation satellites using V-band technology — which is the frequency that will eventually power true multi-gigabit speeds directly to consumer dishes on houses, RVs, and airplanes.

The total addressable market for E-band amplifiers is in the hundreds of millions of dollars — a few thousand ground station gateways globally. The total addressable market for V-band technology — which goes into tens of millions of consumer terminals — is a completely different order of magnitude.

Filtronic is positioned to ride both waves.

THE NUMBERS

I haven’t gone too deep into the finances, but the key metrics look phenomenal.

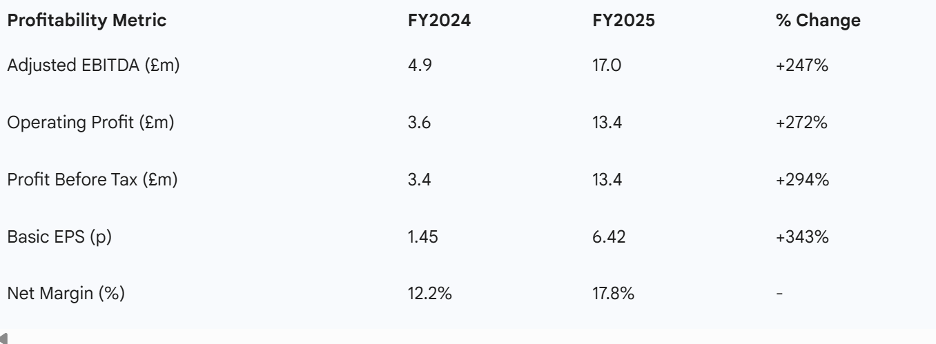
In fiscal 2025, Filtronic’s revenue grew 121% — from £25 million to £56 million. Adjusted EBITDA grew 247%. Operating profit surged 272%.

And the company is debt-free. They have debt on the balance sheet and £14.5 million in cash. 

Plus 90% of the revenue Filtronic expects to earn this year is already locked in through signed contracts and confirmed orders sitting in their order book.

In August 2025, they announced their largest single order ever: a £47.3 million contract — roughly $62 million — for next-generation GaN E-band technology. That contract delivers material revenues through 2027 and 2028.

This is not a startup burning cash and hoping for revenue. This is a profitable, cash-generative business with a defensible monopoly position growing triple digits year over year.

And outside of the company’s financials, the stock is riding SpaceX momentum that is likely to carry into the IPO.

THE RISKS 

So, what about the risks?

The big thing is obviously customer concentration. SpaceX makes up the dominant portion of Filtronic’s forward revenue. If SpaceX changes its constellation architecture, decides to bring manufacturing in-house, or reduces order volume — this stock gets murdered.

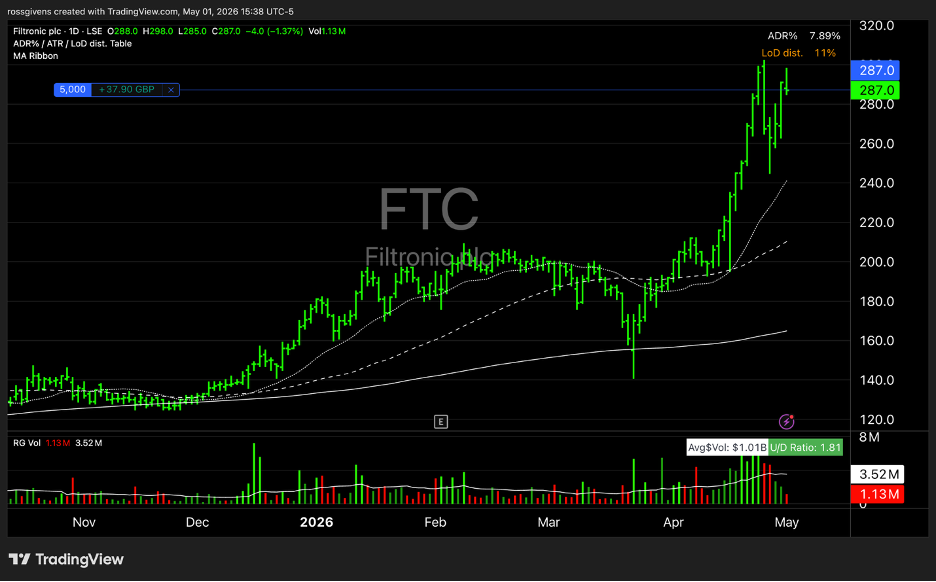
The stock is also extended – up 50% in the last month.

I picked up a few shares today (I tried to buy Wednesday but had to get approval to buy LSE stocks.) Depending on how it acts next week, I may add some more.

This is definitely a speculative play. And I really wish I had spotted it a month ago. But as the saying goes, ‘The best time to plant a tree is 20 years ago. The second best time… is now.’

Best wishes for your trading,

Weekly Update: The Setup No One Is Talking About

Good evening, and welcome to this week’s edition. Ross is on vacation with his family this week, so I am stepping in to cover the update. And this week, I want to talk about Bitcoin.

Now I know, you may be curious why I want to go over BTCUSD when it’s been dead for months, well let me explain below.

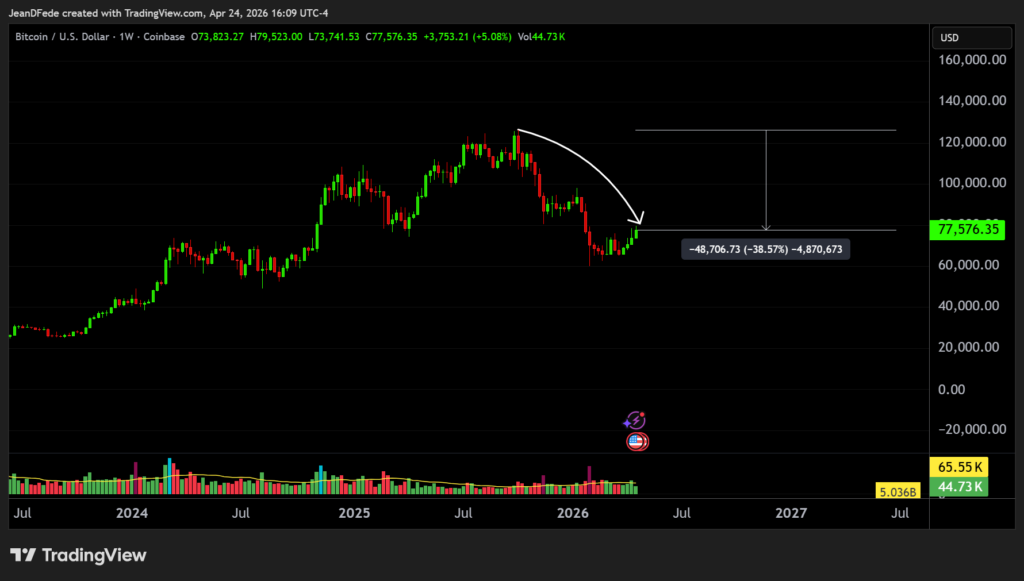
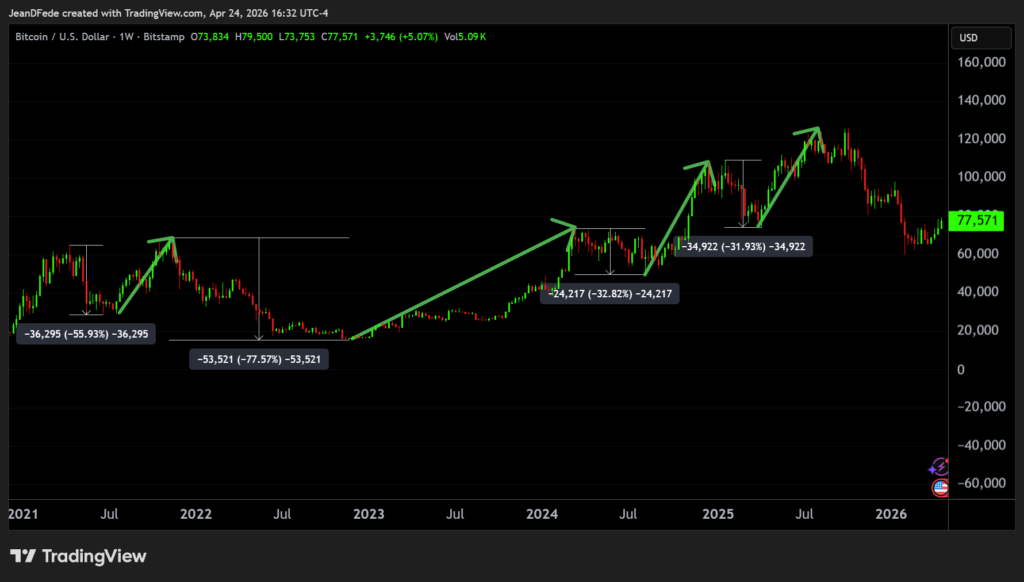
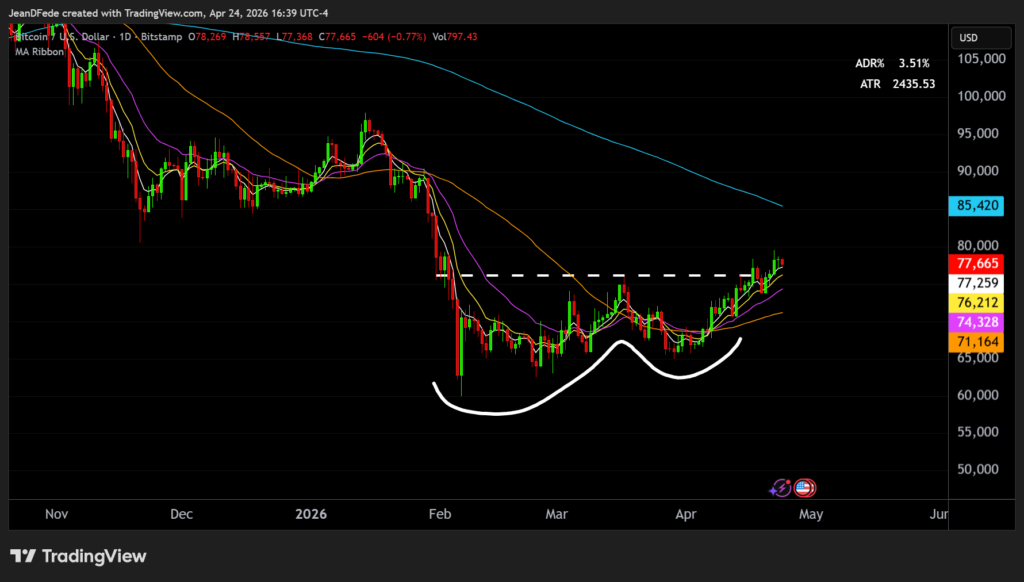
Bitcoin has been left for dead. The coin sits around $78,000 as I write this, roughly 38% below the $126,272 all-time high it printed back on October 6, 2025. “IBIT”, BlackRock’s spot Bitcoin ETF, tells the same story.

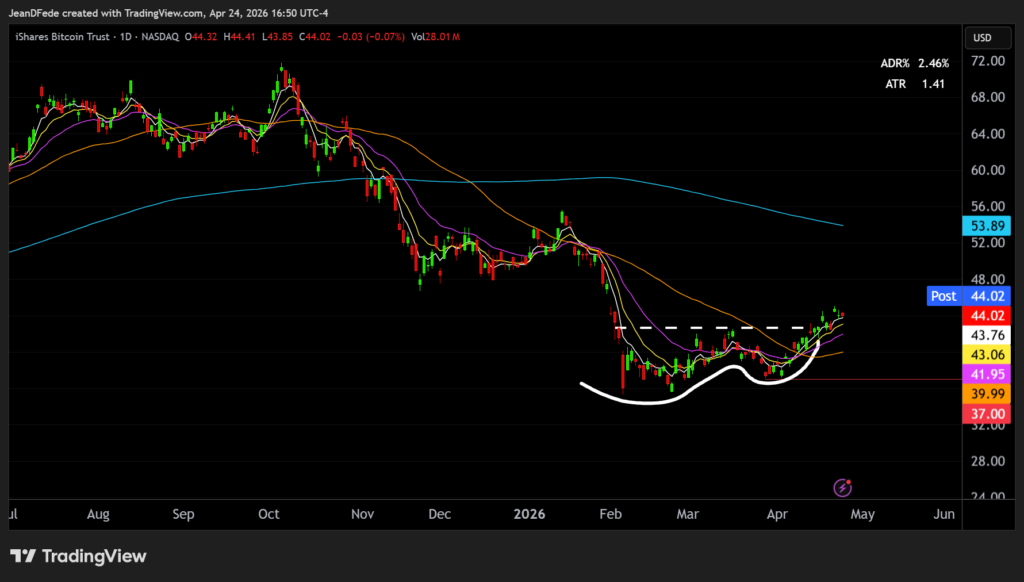
Shares closed today at $44.02, a vast 38.71% below the all-time-high that it made on that same October day.

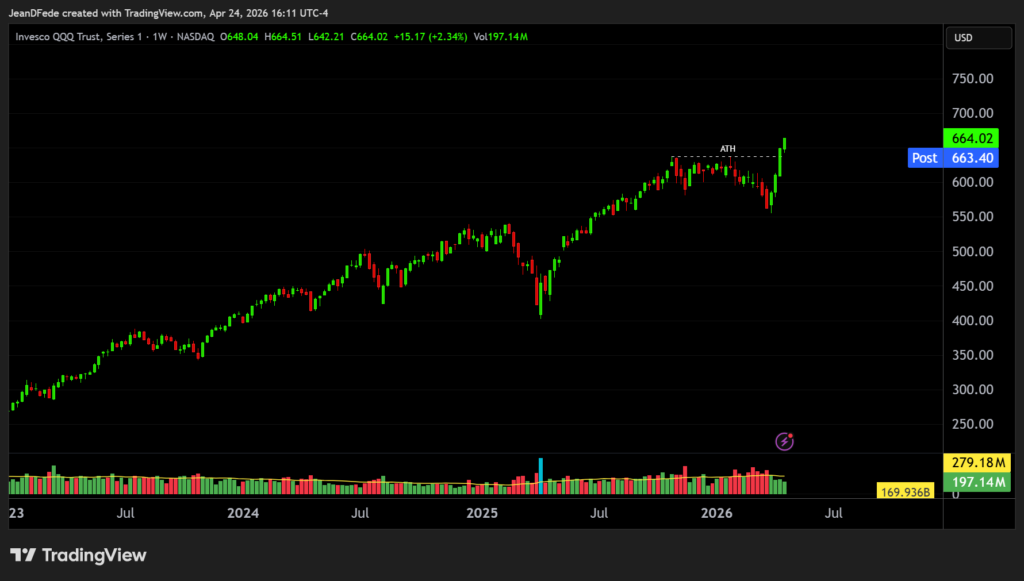
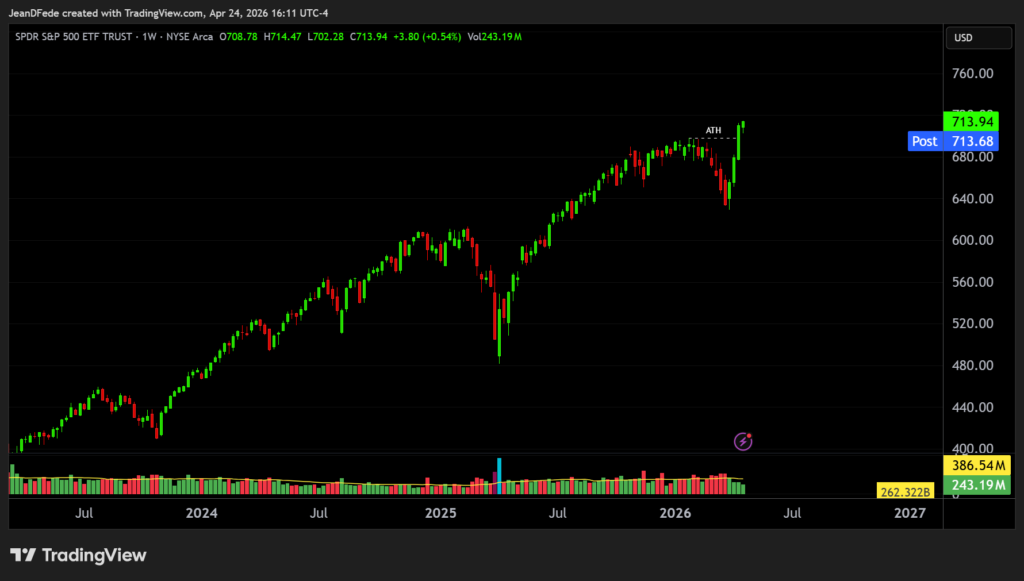
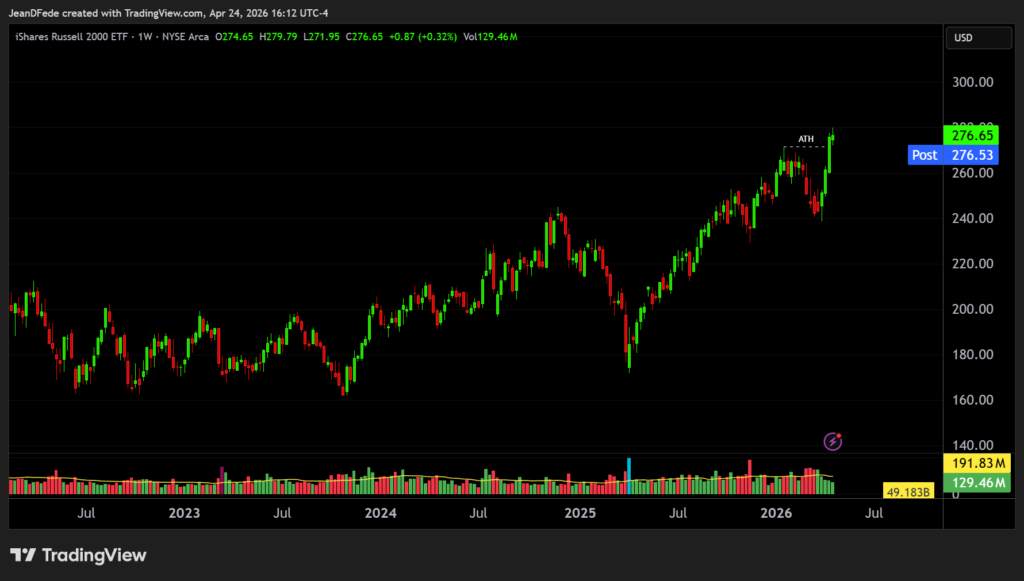
Think about that for a second. The QQQ, SPY, and IWM are all printing new all-time highs while Bitcoin is still down 38%.

This kind of divergence does not last forever and usually ends one of two ways.

So here is where we currently stand, and why I think this may be setting up for a multi month rally.

First, drawdowns of this size are not new territory for Bitcoin. They are the norm. A 50% pullback from the highs would be catastrophic for equities. In BTC, it is just another day.

Think about the history here. The peak-to-trough drawdown from April 2021 to June 2021 was 55%, and that happened in the middle of a bull market. The asset went on to double after.

The 2024 cycle saw multiple peak-to-trough pullbacks averaging around 32%. And if you want to see what real pain looks like, the 2018 cycle witnessed an 82% drop before Bitcoin ultimately went on to run over 1,000%.

I say all this to put the recent price action into perspective. If you zoom out and look at every major Bitcoin rally in history, every single one was preceded by a drawdown that looked exactly like the one we are living through right now.

Bitcoin is used to these steep drops. It tends to recover.

Second, the price action is starting to whisper. Look at a daily chart of BTCUSD. We have a clear series of higher lows stretching back to February 2026. Price has reclaimed every short and medium term moving average on the board and is now pressing toward the 200-day simple moving average around $85,000.

This structure has been in place for over two months, and it is trending higher, not rolling over. As long as BTC holds above the previous swing low at $65,000, the bullish case stays intact.

Third, and this is the part most people miss. Bitcoin has spent essentially three months doing nothing but frustrating everyone who owns it. That is how every multi-month rally in Bitcoin’s history has started. Not with a bang, but with a grinding consolidation that wears out the last of the believers.

Here is how I am thinking about expressing this view.

There are several clean ways to get positioned depending on your risk tolerance. You can buy spot Bitcoin directly through any major exchange if you want the underlying asset.

You can trade the BTCUSD CFD if you want leverage and flexibility without custody. Or you can buy IBIT, or any spot Bitcoin ETF, inside of a brokerage or retirement account.

For the equity expression, IBIT at the current price gives you direct correlated exposure without needing a crypto wallet or a separate exchange account.

A stop below $37 keeps risk aligned with the previous swing low and gives the trade room to breathe if BTC continues to range or whipsaw before the next leg higher.

For a more leveraged play, the IBIT Jan16 2027 $50 call currently trades around $5.10. If Bitcoin runs to $110,000 by year end, which would still be below the prior all-time high, IBIT should trade near $63, and that call should be worth $13, roughly a 100% return on the premium.

If BTC reclaims the highs, the numbers get substantially better.

As always, this is not a sure thing. Bitcoin could break the April lows, flush to $65,000, and invalidate everything I just wrote. Crypto does that. That is why the structure matters. A defined stop below $65,000 on the CFD, or below $37 on IBIT, keeps the loss contained.

But when you have a clean series of higher lows, a 52% peak-to-trough drawdown that has already done the work of flushing weak hands, and a chart now trending higher off the base, you do not wait for the all-clear. You stalk the setup, define your risk, and get positioned before the crowd remembers Bitcoin exists.

The selling feels heavy because it always does at these levels. That is the point.

Bitcoin is used to these steep drops. It tends to recover.

Best wishes for your trading,

Jean

Weekly Update: How to Profit from Higher Interest Rates

Good evening, and welcome to this week’s edition of Stealth Trades!

I hope you had a wonderful Easter with your family.

Our office was closed for Good Friday, so I am sending my weekly newsletter today instead of the usual Friday evening delivery.

And this week, I wanted to share my outlook on interest rates and lay out a trade that should make money if yields continue to rise.

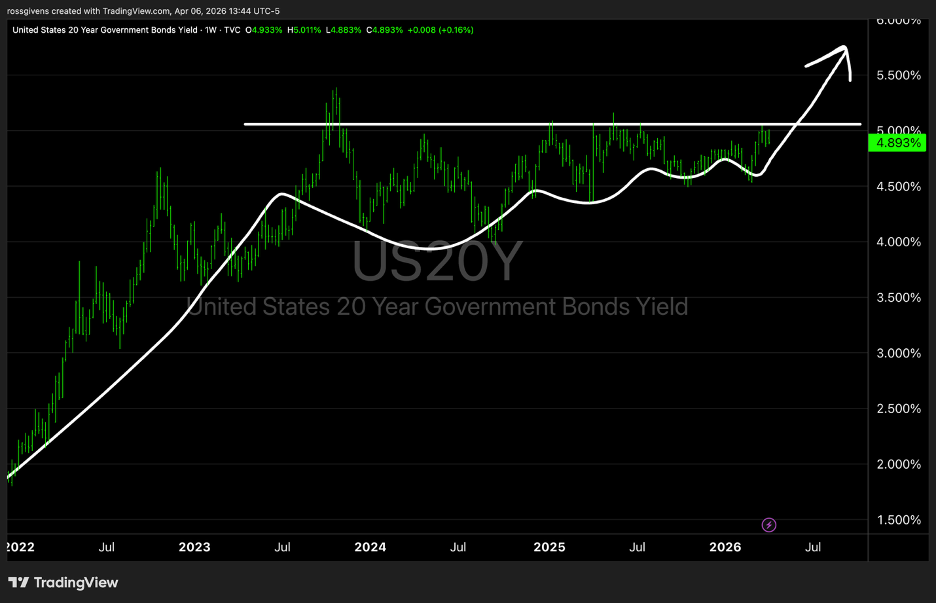
Below is a chart of the 20-year Treasury yield which currently sits at 4.9%.

If you look closely, you’ll notice a breakout pattern forming that wants to go higher.

It looks like this:

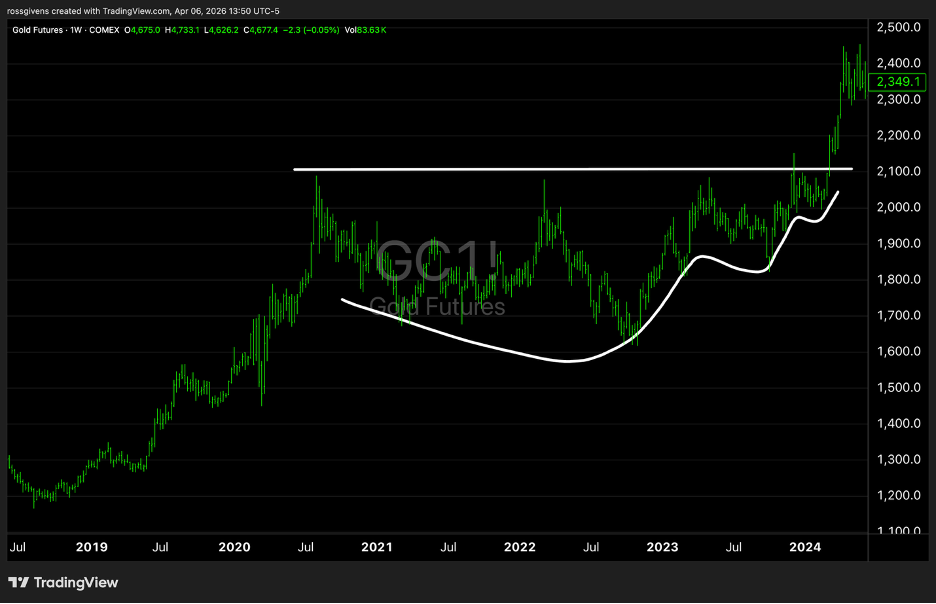
This is eerily similar to what I pointed out in gold in this very newsletter back in April 2024 when gold was breaking out above $2,300.

Now look, I don’t like this any more than you do. I was optimistically hoping for lower interest rates this year. They were all but promised by the Fed and the Trump administration.

But the bond market disagrees.

And when bond yields rise, the value of bonds goes down.

Here is a chart of TLT, the 20-year bond ETF:

It is the exact inverse of the 20-year yield chart.

I expect yields to go up and TLT to go down. And here’s how the math works…

For every 50 basis points (0.50%) that bond yields rise, TLT goes down roughly 10%.

For reference, bond yields have risen 50 basis points since the Iran war started, so it is entirely reasonable to assume we could see more by the end of the year.

To potentially profit off this move, investors can buy the TLT Dec18 $80 put option. As of this writing, it sells for $1.50 per share ($150 per contract).

This gives short exposure to the Treasury bond market until December 18, 2026. If yields rise 0.5% by then, the value of this option should double. If they rise a full 1% (which, again, is entirely reasonable given the rise in inflation) this option should deliver a 670% gain. 

This is, in no way, a sure thing. It is entirely possible that I am wrong, the Fed will cut interest rates despite above-average, rising inflation and increased debt spending.

If that happens, this trade will be a loser.

But, as much as he wants them, I just do not think President Trump is going to get lower interest rates this year. 

The recent spike in energy prices is ramping up inflation once again. The administration has proposed a 50% increase in the defense budget. Deficit spending is levels we have never seen outside of COVID. And the rest of the world is aggressively selling off their US debt holdings in a global trend of de-dollarization.

The research points me to assume higher rates. And this option trade will profit from that event.

Best wishes for your trading,
Weekly Update: It’s Not Pretty…

Good evening, and welcome to this week’s edition of Stealth Trades!

I like to think of myself as an optimist.

I do my best to weed through the muck and find opportunities in the stock market instead of harping on what’s going down.

But, at the same time, I have to admit when conditions are poor.

And right now, they are.

I have not sold any of my long-term holdings. I am just as bullish on gold, silver metals and the equity market over the next 2-5 years as I was before.

But for shorter-term swing trades, not much is working right now.

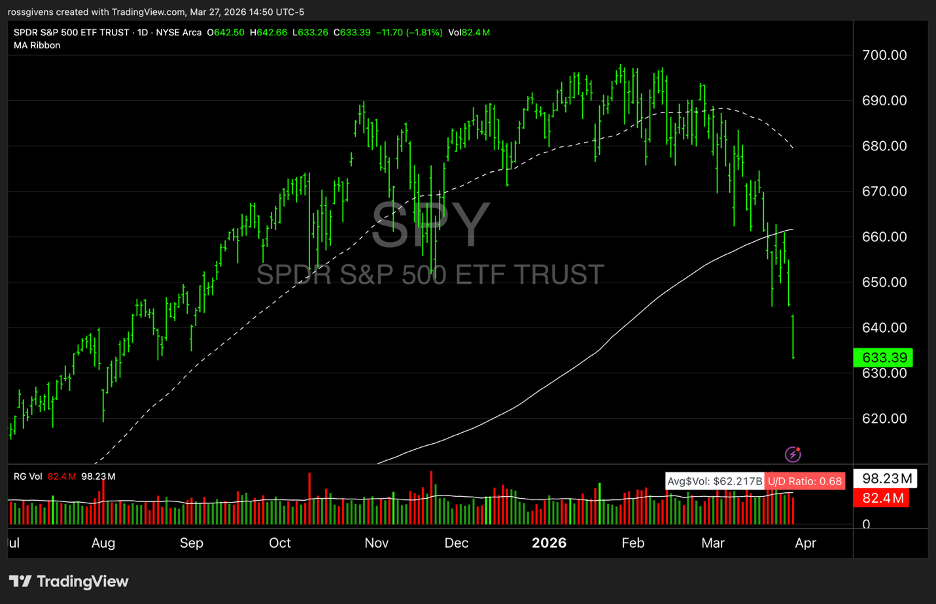
The S&P 500 index, which was fighting to hold onto the 200-day moving average, has thrown in the towel.

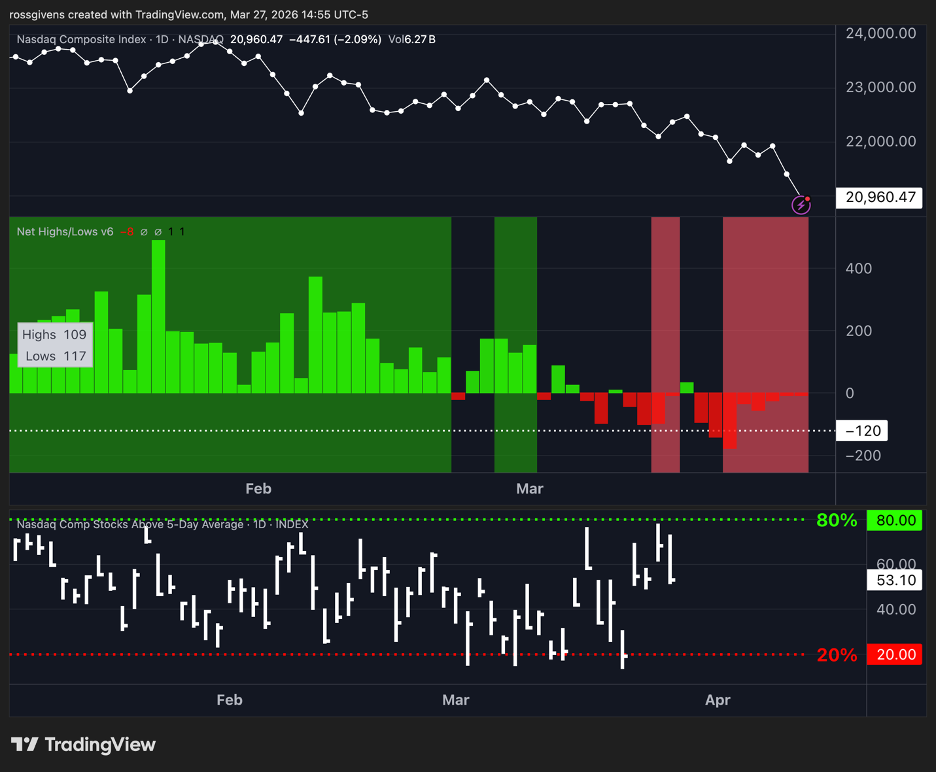
Stocks in the Nasdaq Composite have, as a whole, made more new lows than highs for the last 8 straight trading sessions. 

Not by an alarming number, but still not a great sign.

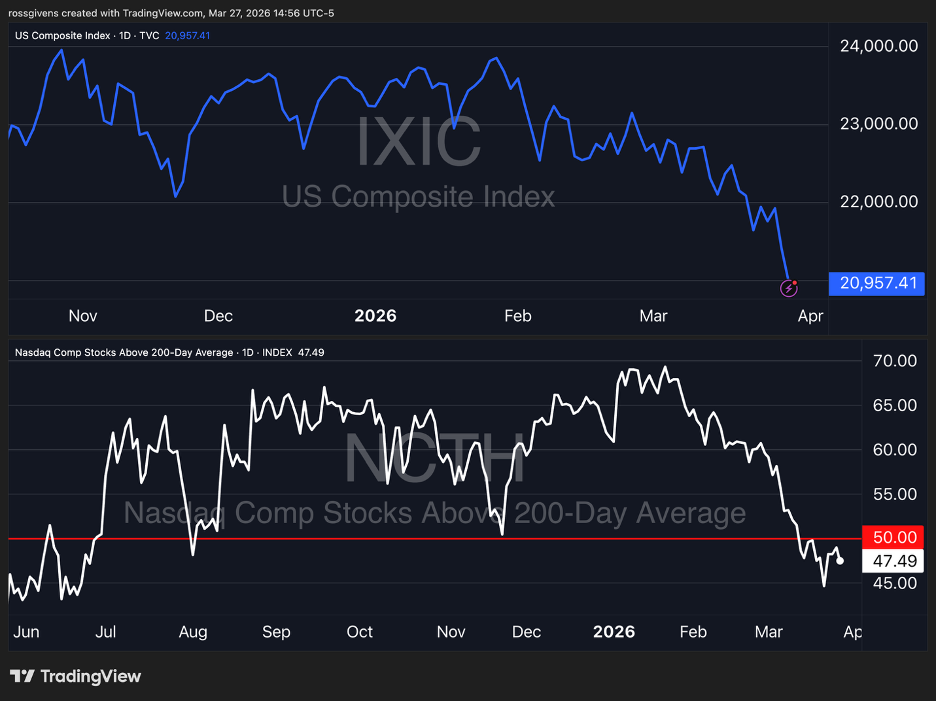
The percentage of stocks beneath their 200-day simple moving average has fallen below 50% for the first time since July.

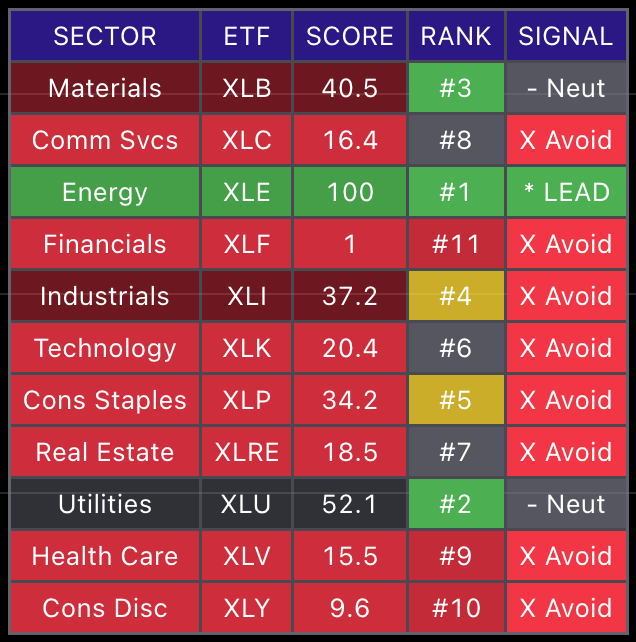
And outside of the energy sector, nothing looks promising at the moment.

This is not to say the market is crashing. The odds we will see a nasty bull market are still very low – there is no fundamental case for that any time soon.

But if you do this long enough, you’ll learn there are periods when conditions are ideal and you want to step on the gas… and periods where conditions are poor and it is best to dial back.

Right now, it is the latter.

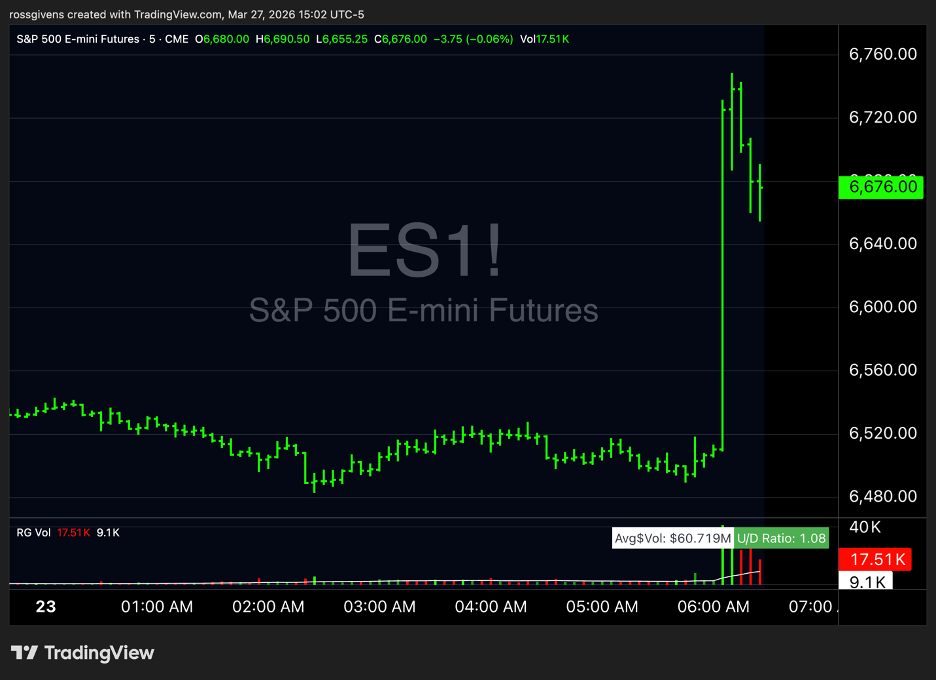
But in this news-driven environment, things move fast. 

President Trump made a Truth Social post Monday morning at 6am citing “very good and productive conversations” with Iran. 

That was all it took…

The entire index surged 3.6% in 5 minutes. 

And, when a real resolution is eventually reached, we could see a move several times this large.

But until then, my advice is to trade light or not at all. Focus on the areas holding up the best in this weakness.

Because, in all likelihood, those are the areas that will move the fastest when conditions improve.

Best wishes for your trading,

Weekly Update: Sell America. Buy Brazil

Good evening, and welcome to this week’s edition of Stealth Trades!

What if the US was not the best stock market to invest in?

What if another country had more natural resources, large energy production, and the stocks were selling for half off?

I’m talking about Brazil. And before you delete this email, hear me out…

The US stock market hasn’t been a lot of fun the last few weeks. The Iran war, stubborn inflation, and soaring energy costs have wreaked havoc on everything.

With the exception of crude oil, everything in the market is down – metals, commodities, stocks in every sector.

This made me take a deep dive – to look and see if there is a better value out there for investors.

And I believe there is.

Because the macroeconomic backdrop in the United States? Let’s just say it’s been better…

We just started a war. 

The Executive branch (Trump) is attacking Central Bank independence (Powell/Fed). 

Budget deficits are running at $2.5 TRILLION per year (and that’s with a good economy.) 

We have judicial interference with monetary policy (tariffs).

And our largest, most profitable companies are burning cash at record rates.

These are EMERGING MARKET characteristics, and yet the US equity market still carries a premium developed market valuation. 

In other words, our stocks trade for higher multiples of sales, earnings and cash than stocks in countries like Brazil, Poland and Spain.

But that premium is evaporating…

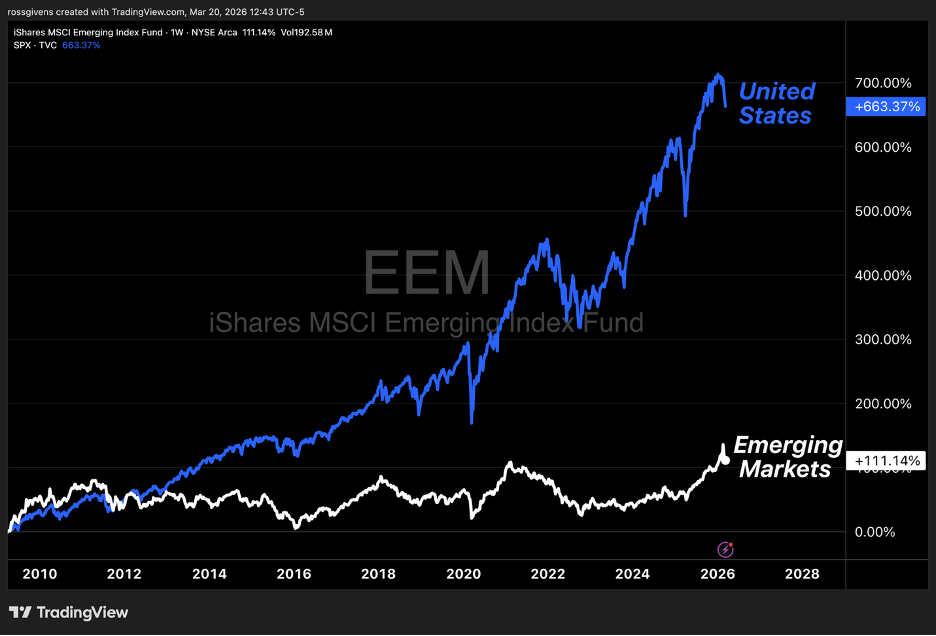
The S&P 500 returned 17% in 2025. Emerging markets returned double that at 33%.

And in 2026, that trend is likely to accelerate.

This is hard for some investors to grasp. Because for the last 17 years, the US has dominated.

Our stock market has experienced a historic rally since 2009.

But this has not always been the case.

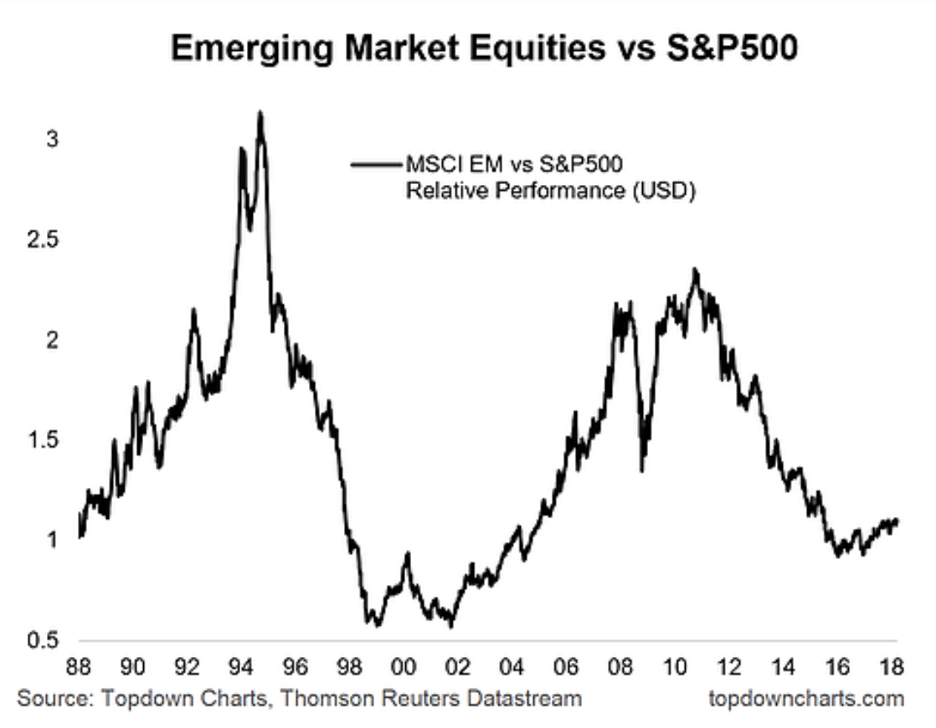
In the 1990s, emerging market equities massively outperformed US stocks.

This was the case in the early 2000s as well.

It is only since 2009 that the Nasdaq and S&P 500 have outpaced foreign markets.

And I expect to see this trend reverse in the coming years.

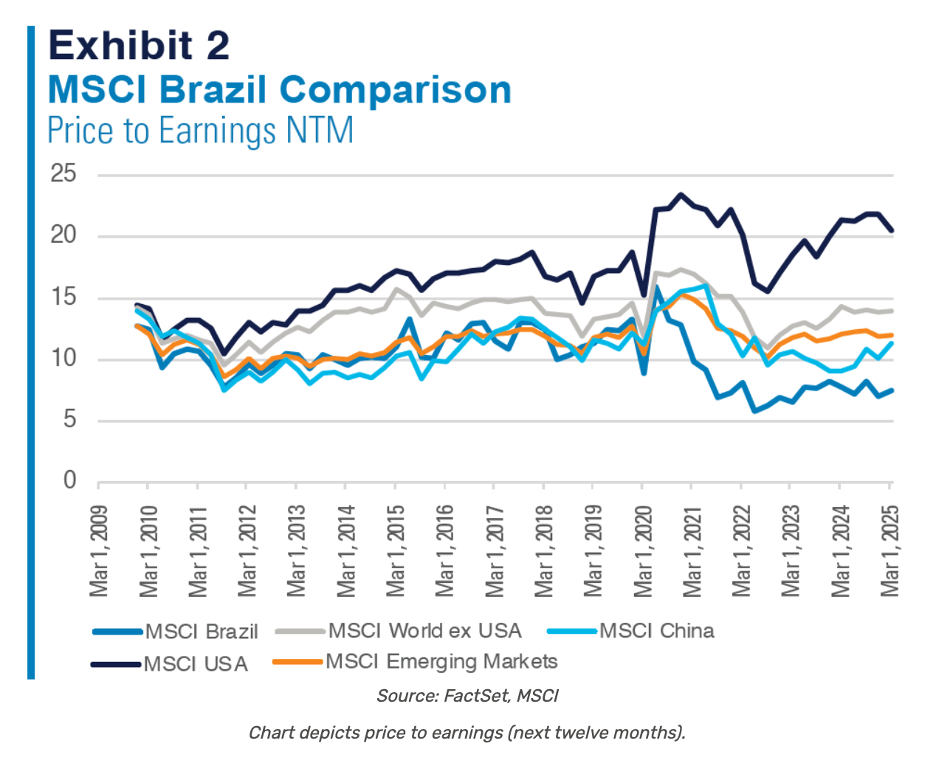
Look at the valuations…

As of last year, the US market trades at roughly 22 times earnings.

But the rest of the world trades at a 14X multiple.

Emerging markets are at 12.

And the Brazilian stock market has a P/E ratio of just 8!

Brazil, to me, offers one of the most attractive global investment opportunities today.

On top of a bargain valuation, you get a country rich in natural resources – petroleum, natural gas, gold, iron ore. Not to mention their agricultural exports like soybeans and coffee.

If you’ve been reading my newsletter for a while, you know how bullish I am on commodities with this inflationary backdrop. And Brazil is dripping in them.

The cherry on top?

Brazil is in the early stages of a rate-cutting cycle.

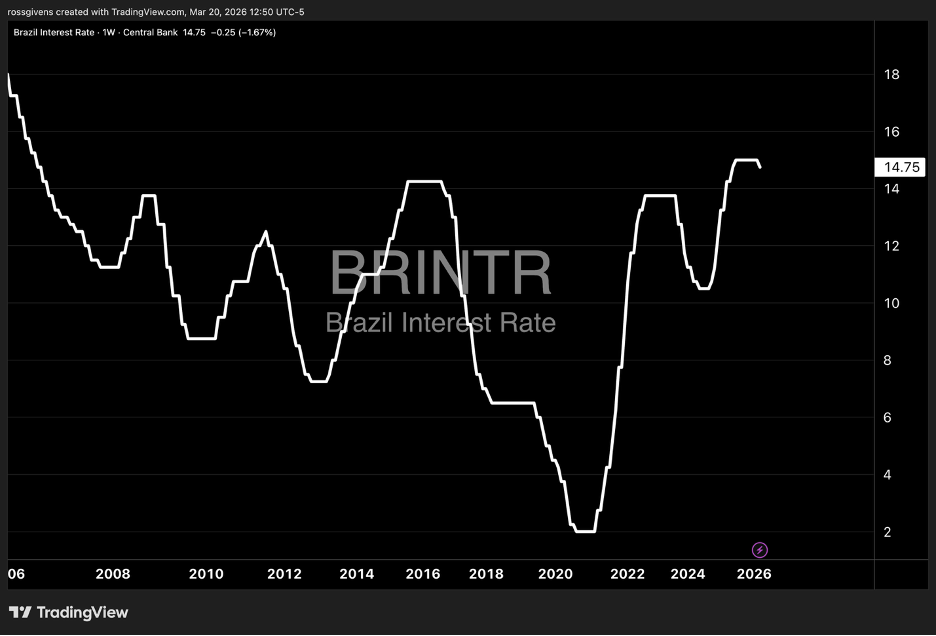
Interest rates in Brazil are 14.75% (you thought your 6.5% mortgage was bad).

But Brazil’s central bank just started cutting. 

And these cuts could be 5-10%… not the fractions of a percent we are hoping for here.

Interest rate cuts are one of the biggest drivers for stock prices. Cheap money is what fueled most of the bull markets here for the last twenty years. 

And it will be no different for our friends to the south. 

Do with this information what you will. 

Personally, I sold my Vanguard S&P 500 ETF (VOO) and put those dollars into the iShares MSCI Brazil ETF (EWZ).

This is not a bet against America. 

And I am not expecting a market crash.

I am simply allocating to where I see the most value for my investment dollars.

Best wishes for your trading,

Weekly Update: Is ORCL a Good Buy Here?

Good evening, and welcome to this week’s edition of Stealth Trades!

When there’s blood in the streets, buy real estate.

As I’ve pointed out over the last few months, the AI trade is long in the tooth. Former leaders like Nvidia and Microsoft are now underperforming the market.

Their valuations have become stretched, and these are unlikely to be winners until a real price correction takes place.

But one AI stock is beginning to look very attractive…

Oracle (ORCL) has seen its stock cut in half over the last six months.

At the same time, the company is quietly building what could become one of the most powerful positions in the AI economy.

Here’s the situation…

There is a real battle going on among the artificial intelligence giants.

Everyone thinks the future of AI is about models.

ChatGPT.
Gemini.
Grok.
Llama.

Billions of dollars are being poured into GPUs, training clusters, and massive data centers.

But billionaire Larry Ellison – the founder and CEO of Oracle – revealed a shocking truth in a recent interview.

All these AI models are training on the exact same data – the public internet.

Wikipedia, Reddit, news articles, websites…

Which means eventually, they all start to look the same. In Ellison’s words, they become commodities.

So, if the models eventually become commodities, what becomes the real moat? What makes one more valuable than the others?

Private data.

I’m talking about the financial records inside banks, the medical histories inside hospitals, the operational data inside Fortune 500 companies.

The data that never touches the public internet.

And that’s when this entire story starts to get interesting.

Because Oracle is the one company that already holds a massive portion of the world’s most valuable private enterprise data.

And if AI starts moving toward private data, Oracle will quickly become one of the most important players in the AI ecosystem.

Last year, Oracle signed a $300 billion infrastructure deal with OpenAI. So, with that kind of tailwind, why has the stock gotten hammered?

Well… investors got nervous.

They started questioning software companies in an AI world.

They worried about spending, and balance sheets, and that Oracle might be overbuilding infrastructure.

So, they sold.

But Oracle is now one of only a handful of hyperscale cloud infrastructure providers supporting AI workloads.

And because Oracle came late to cloud, their infrastructure specifically designed for AI training and inference.

This gives them an edge.

Oracle recently launched something called AI Database 26ai, and the idea behind it is simple…

Instead of training AI on private data, you let AI query that data in real time.

This technique is called retrieval augmented generation.

The AI doesn’t absorb the data. It simply reasons over it.

Which means a hospital could analyze patient histories without exposing records.

A bank could evaluate loan portfolios without leaking customer information.

A defense contractor could run AI analysis on classified systems.

All while the data never leaves the vault.

And if that model becomes the dominant way enterprise AI works, the companies controlling enterprise databases suddenly become very powerful.

And Oracle owns a massive portion of those databases.

Oppenheimer recently upgraded the company and suggested the stock could gain 25% from current levels.

Analysts, as a whole, remain bullish on the stock. 31 of them have Oracle as a STRONG BUY. 

Even after cutting management projections, they still believe Oracle’s earnings per share could double by 2030.

And right now, the stock trades at roughly 22 times forward earnings.

That’s cheaper than Microsoft, Amazon or Alphabet.

Yet its expected earnings growth is actually faster than some of them.

Now, just to be clear, this is not a swing trade.

This isn’t one of my typical short-term tactical setups.

This is a longer-term positioning idea.

You’re betting on the rise of enterprise AI; on private data becoming the real AI moat.

And you’re betting Oracle executes over the next several years. 

The next AI battleground won’t be the models. It will be the data.

And if that happens…

Oracle might be sitting right in the middle of it.

Best wishes for your trading,
Ross Givens