Weekly Update: The New “High Tight Flag” Trade Setup

Good evening, and welcome to this week’s edition of Stealth Trades!
As traders, we want to be in the stocks with the highest momentum. Many of these stocks will be making new highs.
One question I get a lot is, “Ross, this thing has already doubled. Isn’t it too late to buy?”
I don’t like to chase stocks. After a 50%+ move, the likelihood of a pullback is significantly higher.
The smarter move is to learn the chart pattern that tells you exactly when to enter an extended name — and when to sit on your hands.
This week I’m going to walk you through that pattern. It’s one of the most powerful momentum setups in trading. And it is the result of combining two legendary methodologies — Bill O’Neil’s original High Tight Flag from the 1980s, and the modern variation that Swedish trader Kristjan Kullamägi used to turn roughly $5,000 into over a $100million.
Let’s get into it.
Most retail traders blow up the same way. They watch a stock run 40, 50, 80 percent. Then they give in to FOMO and buy at the top — right before it pulls back 20 percent and shakes them out at a loss.
This isn’t bad luck. It’s the wrong entry method.
There’s a specific kind of chart action that tells you a stock has more upside left — and a different kind that tells you the move is over. The framework I’m about to share lets you tell the difference. And it works whether you’re trading a $90 million micro-cap or a trillion-dollar mega-cap.
Bill O’Neil — founder of Investor’s Business Daily — spent fifty years cataloging the biggest winning stocks in history. He found that before the very best names made their biggest legs higher, they almost always formed the same chart pattern.
He called it the High Tight Flag.
The textbook version:
- The stock advances 100 percent or more in 4 to 8 weeks. That’s the “high” — a powerful, fast move that shows real institutional buying.
- Then it pulls back no more than 25 percent off the highs. That’s the “tight” — small, controlled pullback, not a crash.
- It consolidates sideways for 3 to 5 weeks.
- It breaks back out on volume — and the next leg starts.
O’Neil considered this the single most powerful pattern in the entire stock market. When it forms cleanly, it’s been responsible for some of the biggest winners in history — Cisco in the late 90s, Apple in 2004, Netflix in 2013.
The problem?
In today’s market, the textbook version rarely forms cleanly.
Cycles are faster.
News-driven gaps are bigger.
Tight 3-5 week flags have been replaced by 5-10 day pullbacks that don’t qualify under strict O’Neil rules.
That’s where the modern variation comes in.
Kristjan Kullamägi — @Qullamaggie on Twitter — is a Swedish trader who turned roughly $5,000 into over $100 million between 2011 and 2020.
His entire journey is documented.
And while he has become reclusive over the last five years, he documented much of his methodology in live trading sessions you can still find online.
And one of his core setups is a direct descendant of O’Neil’s High Tight Flag — updated for modern market structure.
Here’s a head-to-head comparison of their rules:
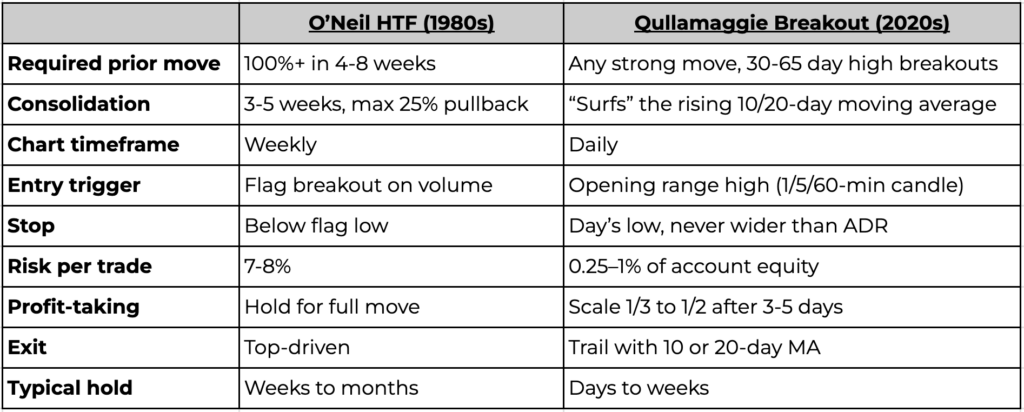
Qullamaggie’s version is more flexible, more disciplined on risk, and better suited to the algo-driven, news-gap-heavy market we trade in today.
But the full Qullamaggie execution — opening-range entries on the 1-minute candle — isn’t realistic for a lot of you who can’t watch screens at 9:30 AM Eastern every day.
So, here’s a hybrid version…
The Setup
The stock must have had a strong recent advance. I look for names breaking out to 30-60 day highs. Doesn’t need to be O’Neil’s strict 100% in 4-8 weeks — but the bigger the prior move, the better the eventual breakout tends to be.
Look for stocks showing real signs of strength: up 30%+ in the last month; new all-time highs after a big run; a big earnings gap that takes the stock to new highs; a breakout from a long base on heavy volume.
Ignore stocks that are not showing high momentum right now. This would be things like stocks chopping sideways for a year and barely ticking up to new highs or a dead cat bounce off of multi-year lows.
The Flag
After the run, Qullamaggie looks for the stock to “surf” its rising 10-day or 20-day moving average. That’s the modern tight consolidation that took place of O’Neil’s “flag.”
If the stock closes below its 20-day MA on heavy volume or pullback exceeds 25% from the recent high, the trade is broken. Don’t buy it.
The Entry
You’re looking for a breakout close above the consolidation high. So, on a daily chart, you want to see the stock end the day above the consolidation zone confirmed by above-average trading volume for the day.
Qullamaggie trades them with an opening range breakout entry – something I have demonstrated in our live Monday training sessions. But if you’re not trying to get fancy, just wait for the stock to close above that high and buy at the open the next day.
The Risk
This is the hardest part of trading. And it is what separates traders who survive from traders who blow up.
Stop loss: Below the flag low (the lowest closing price during the consolidation).
Position sizing: Calculate your size so that if your stop is hit, you lose no more than 1% of your account on the trade. Starting out, consider running closer to 0.5%. Qullamaggie was averaging around 0.25%, but he’s an absolute pro. And he admitted to risking more when his account was smaller.
If that stop is too large, put it at one ADR. ADR stands for average daily range. It tells you how much a given stock moves from high to low each day on average. If the breakout is real, it should not violate this.
Profit Taking
Sell 1/3 to 1/2 of the position after 3-5 days of strength. Move your stop on the remaining shares to breakeven. Use the 20-day moving average as your trailing stop on the rest. When the stock closes below the 20-day SMA, sell it the next morning.
Potential Setup
One stock setting up in this pattern today (and there are many) is Super Micro Computer (SMCI).
This was $120 stock two years ago. Today it trades for a quarter of that. But it just finished an 80% run in 7 weeks.
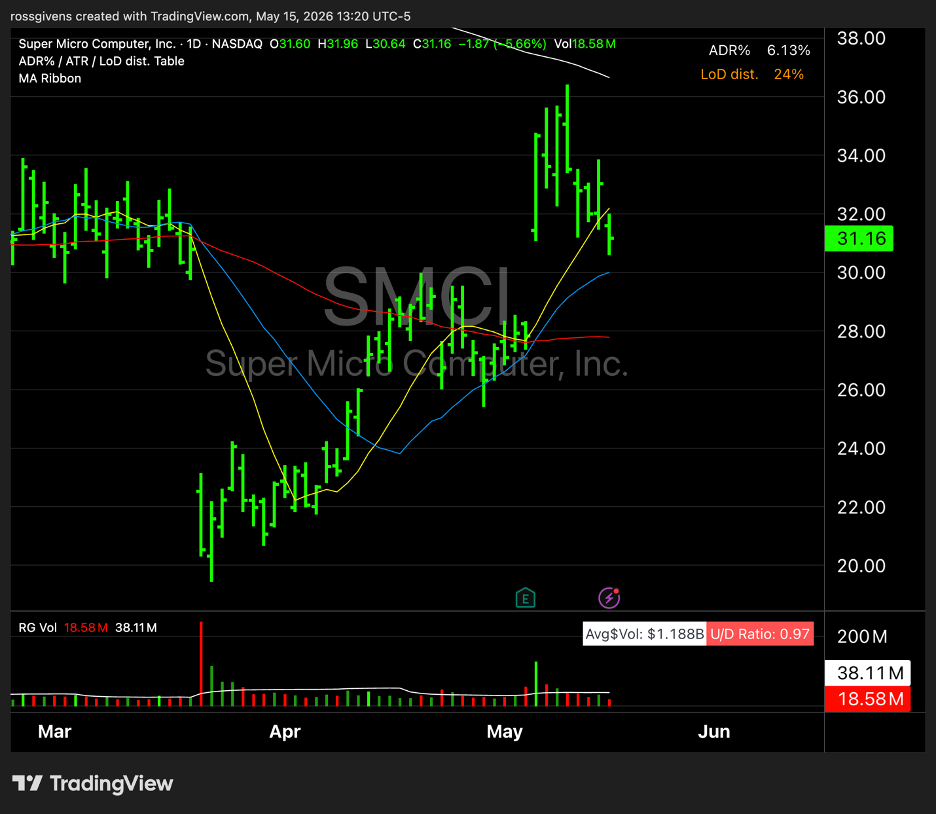
Here is the daily chart. Note the 14% pullback in between the 10-day (yellow) and 20-day (blue) moving averages.
If the stock breaks out and closes above $36 on higher-than-average volume, that would be your buy signal.
A 6-7% stop loss would handle the risk, and you’d look to sell half the position after 3-5 days.
This may or may not trigger. But semiconductors are the leading group in the market, and this stock has a lot of room above it.
Broadcom (AVGO) is another one that could trigger soon.
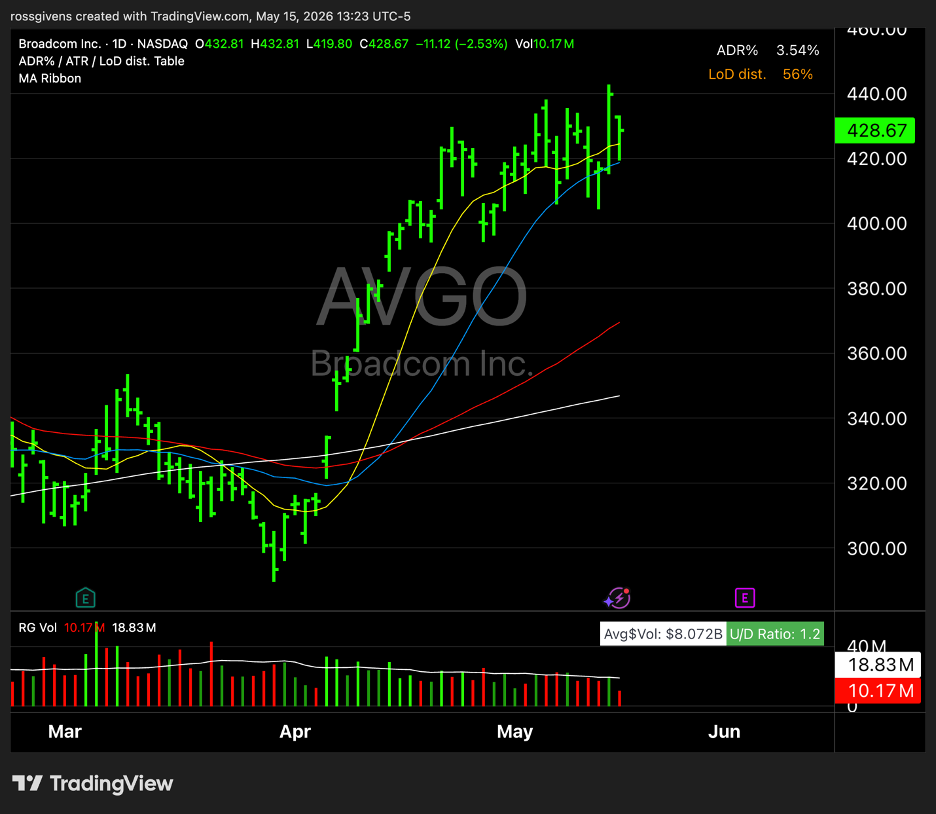
Hopefully this setup helps you trade some of these big movers.
I’ll be on our live mentoring session Monday at 9am ET. We can walk through these setups in real time. Bring your watchlist.
Best wishes for your trading,