Weekly Update: The Bull Market was Fake
Good evening, and welcome to this week’s edition of Stealth Trades!
This chart will blow your mind…
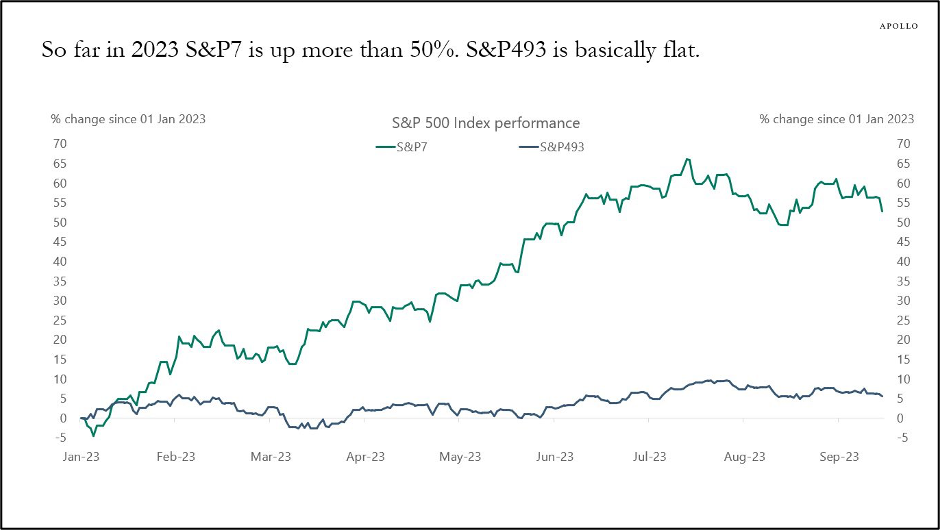
It compares the year-to-date performance of the 7 largest stocks in the S&P 500 (green line) with the other 493 (black line).
Meta, Apple, Amazon, Alphabet, Nvidia, Microsoft and Tesla all delivered huge gains – propelling the Nasdaq up 48% to start the year. But without the “Magnificent 7” the market was basically flat this year.
How is this possible?
Indexes are market-cap weighted. Bigger companies like Google, Amazon, and Apple have far more of an impact than smaller ones.
These 7 stocks have been holding up an otherwise lackluster market. In other words, the 2023 bull market was fake.
The chart below shows the percentage of stock trading above their 200-day moving average.
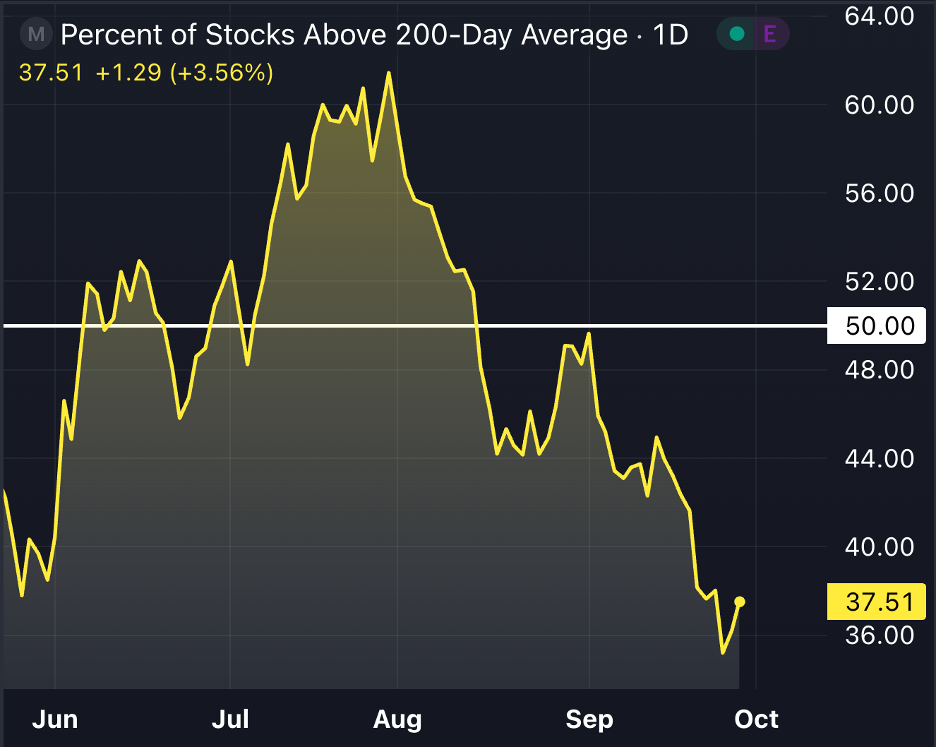
As of today, only 37% of stocks are above their 200-day moving average. In other words, 63% of stocks are in severe downtrends.
This figure has been trending in the wrong direction since the end of July, and it is not the sign of a healthy market. In order to make any real progress, we must see broad participation in stocks.
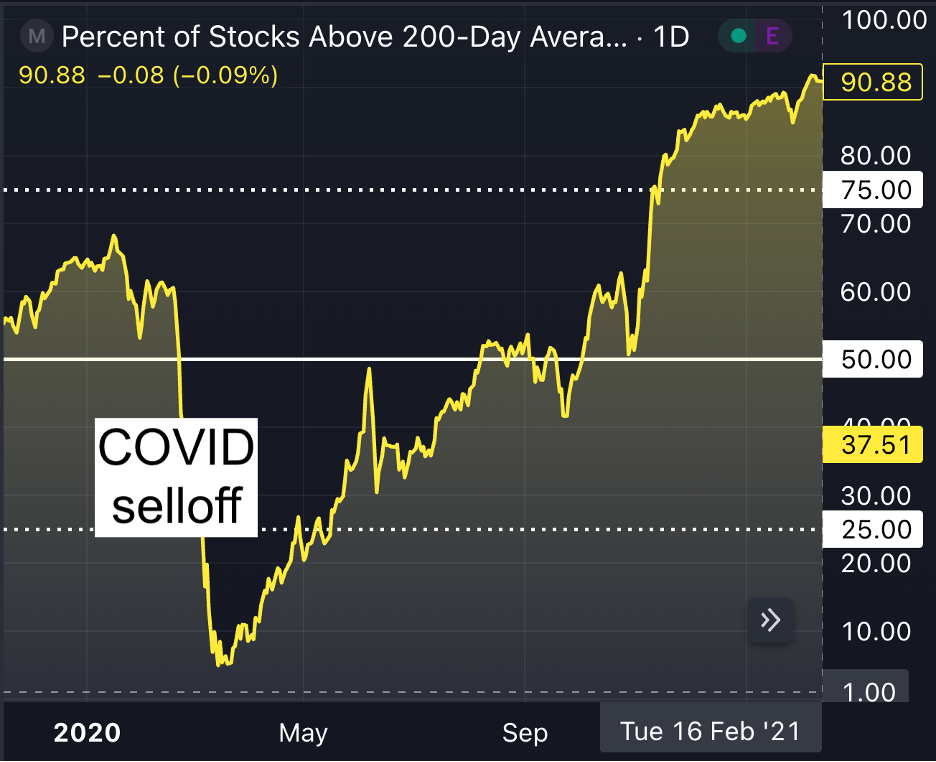
By contrast, this is what the same chart looked like during the “healthy” bull market in 2020.
So, when is the selloff going to end? Here’s what I expect…

Since topping at the end of the Summer, markets have been choppy and range bound. We have seen a series of lower highs and lower lows as reality and rising rates caught up with stock prices.
Following an ugly September, we are likely due for a short-term bounce higher. This small rally is unlikely to penetrate the 50-day moving average, at which point I am expecting a final flush lower.
This will make the final bulls throw in the towel and hit everyone’s stop losses. Once pessimism sets in… once everyone is bearish and bracing for another bear market, that is when stocks will begin to rise – catching everyone off guard as it always does.
One of my favorite indicators to watch for potential bottoms is the Put/Call Ratio. It measures the amount of put buying versus call buying. When this ratio is high, it is telling you investors are overly bearish and expecting lower prices.
Most think a high put/call ratio is a bad sign. But it is just the opposite. We almost always see a spike in this ratio at the bottom of the market.
Below is a chart of the put call ratio. I have added a 10-day simple moving average in yellow (a tip from John Carter) to smooth out the reading.
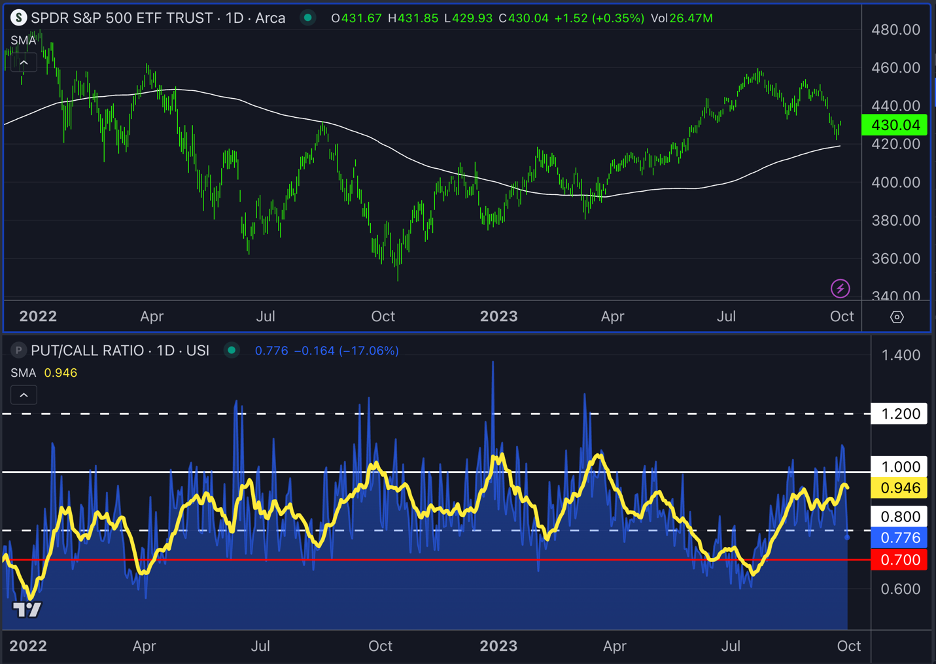
For the last two years, this moving average hitting the 1.00 level has been a perfect buy signal.
I have circled each of these occasions on the chart below:
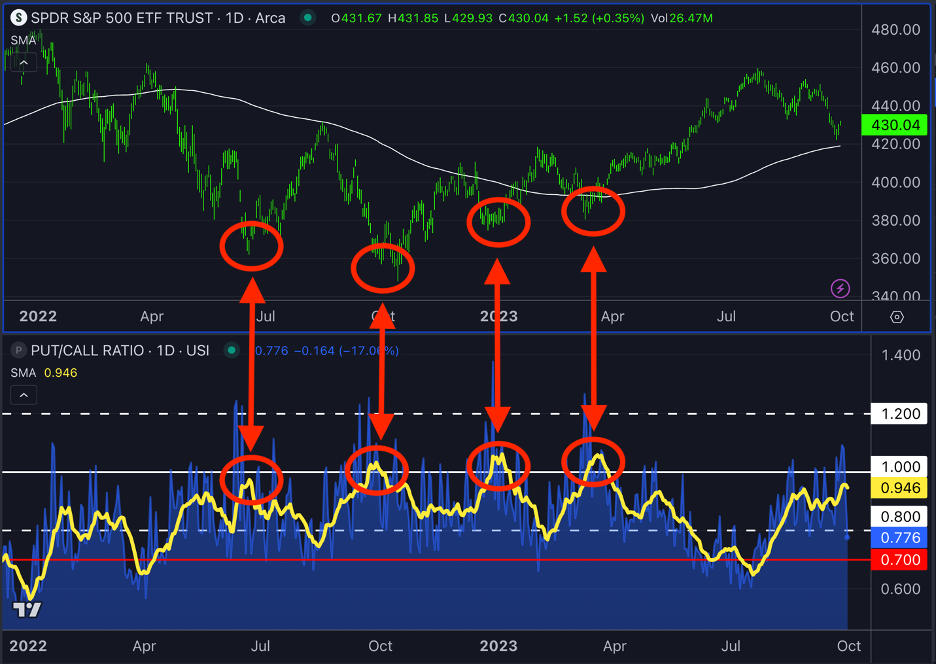
Today, we are very close to this level. But we have not hit it yet. I expect to see one final flush lower to turn the final bulls into bears.
That is where I will be looking to buy.
Best wishes for your trading,