Weekly Update: It’s Time to Buy Gold
Good evening, and welcome to this week’s edition of Stealth Trades!
The case for gold and silver just keeps getting stronger…
The global money supply surged $13.6 trillion year-over-year. That’s a 10.4% increase in a single year, to a record $144 trillion.
That makes $44 trillion dollars created, just since 2020.
Outside of wartime or severe crises, money creation has never happened this fast.
And that has huge ramifications for the prices of gold, silver, even platinum and palladium.
My job is to keep you ahead of major investment opportunities; to make sure you get in early.
I alerted readers to buy gold almost 2 years ago when it first crossed $2,000 an ounce.
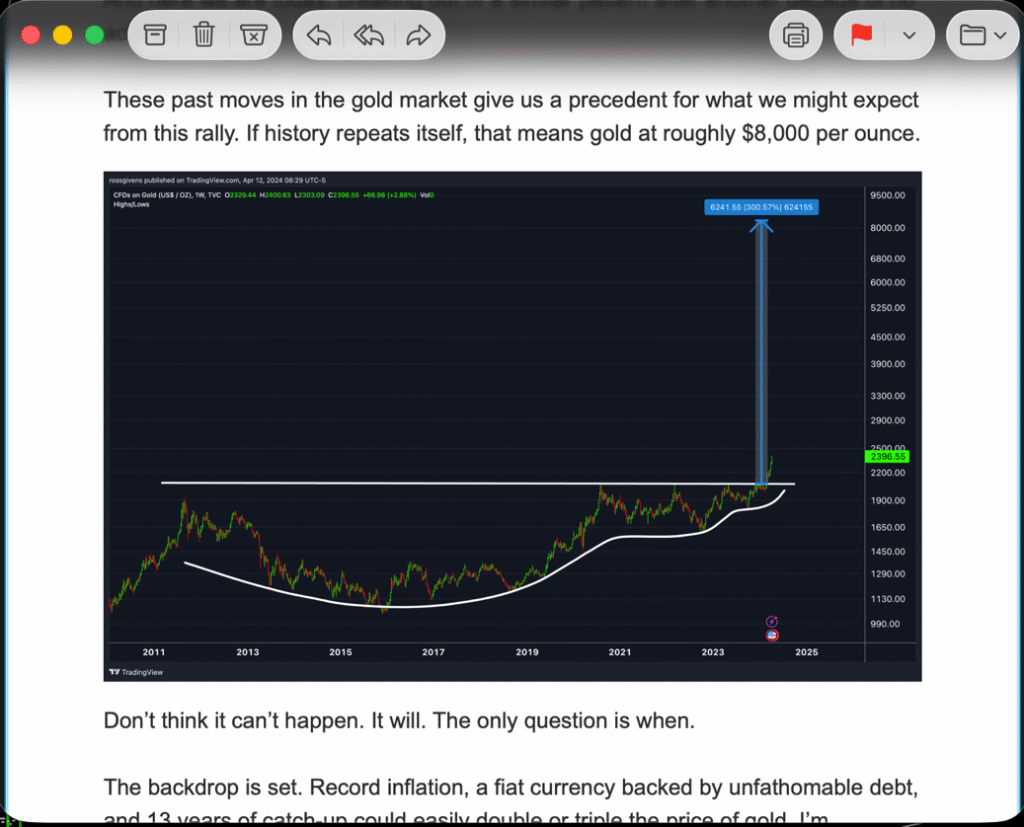
I spotted the multi-year breakout pattern and gave a price target of $8,000 an ounce.
Nothing has changed in the last two years. In fact, the bull case for gold and silver has become exponentially stronger.
There are three main forces driving gold and silver higher:
#1 – INFLATION
Inflation is caused by one thing and one thing only – printing money. Prices rise when more dollars are added to the system chasing the same number of goods and services.
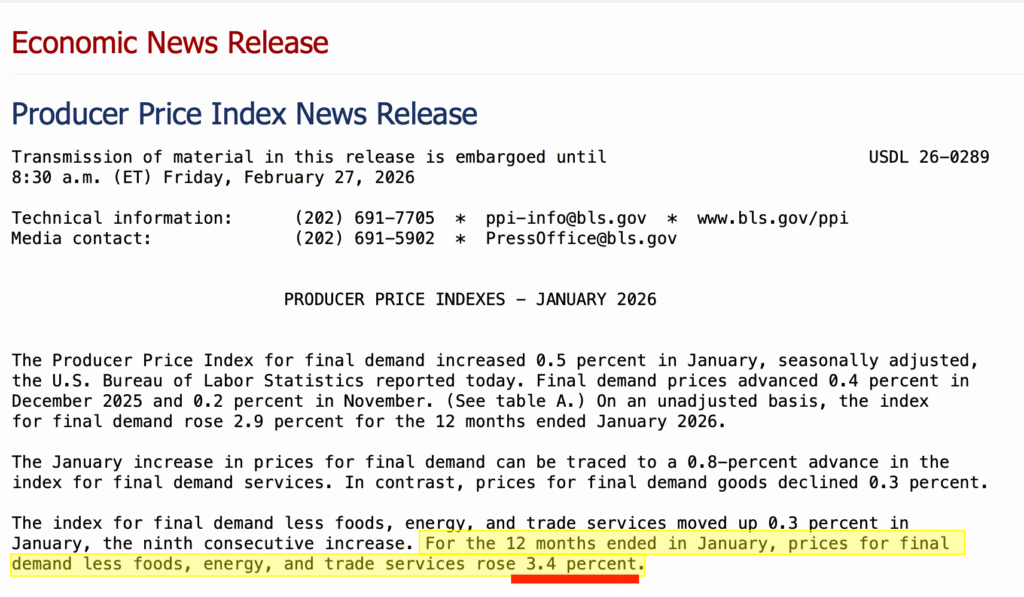
On Friday, the US Bureau of Labor Statistics released January PPI data showing higher-than-expected inflation once again.
This should come as no surprise. It’s an inevitable result of the ever-increasing money supply I mentioned earlier.
Global money supply was $26 trillion in the year 2000. It’s $144 trillion today.
The money in existence has grown more than 5-fold in two and a half decades, and it continues to surge even in some of the best economic conditions.
Meanwhile, U.S. debt is over $38 trillion.
Interest payments have tripled in five years.
Over $1 trillion annually just in interest payments, and the government still has an annual deficit of $2.5 trillion dollars.
Governments have two choices when debt explodes:
- Default (they won’t).
- Inflate it away.
Inflation makes debt smaller in real terms.
And gold is the only monetary asset that has kept score for 5,000 years.
- 1970s: Gold +2,300%.
- 2008: +170%.
- 2020: +40%.
If gold returned to its 1980 money supply ratio, it would imply $9,700 gold today.
If money grows 5% annually, models point toward $13,000 by 2050.
If money grows 7%?
Long-term models stretch toward $25,000 an ounce.
Crazy enough, there are options trades floating out there betting on $20,000 gold.
I’m not saying that happens tomorrow.
But the math makes sense.
#2 The Technical Picture
Gold has been steadily trending higher since early 2024.
Last year, the average gold price was $3,400 an ounce.
Last quarter it was $4,100.
Today gold trades for $5,260. And this is only the beginning…
Goldman Sachs just raised their 2026 forecast to $5,400.
JP Morgan’s base case is $6,300.
Their bull case? $8,000 to $12,000 an ounce.
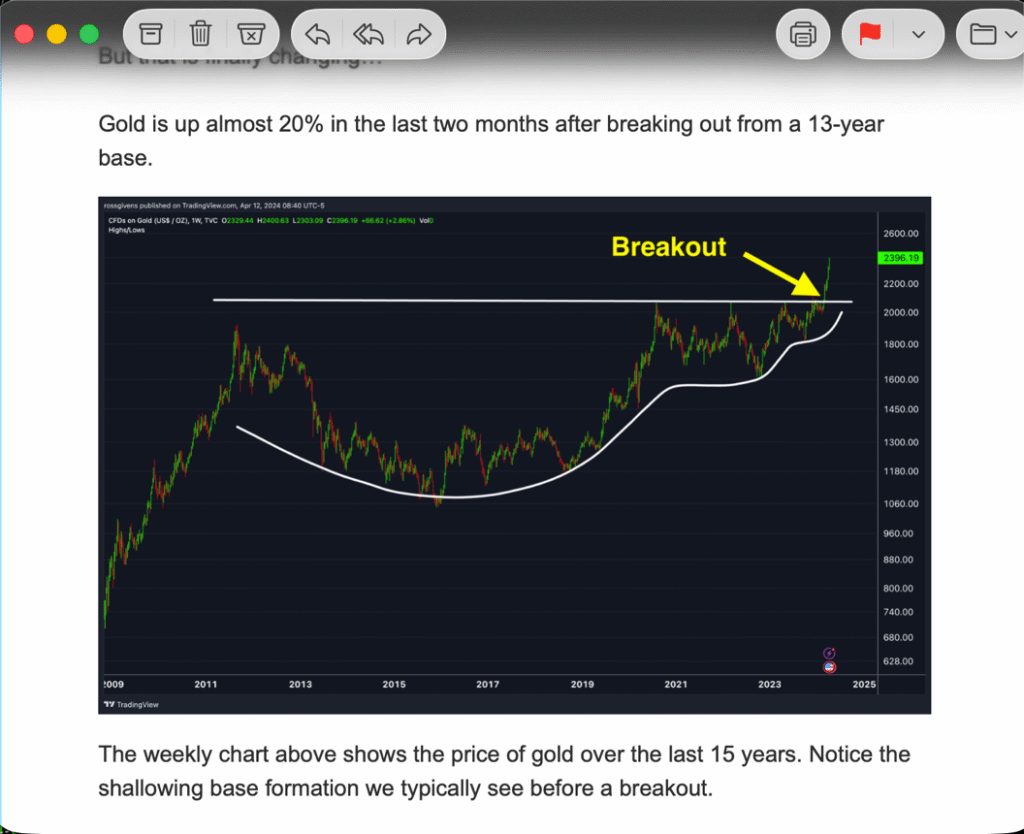
On the daily chart below, you’ll notice gold emerging from a shallowing consolidation pattern – almost identical to what we saw in December and before every major rally in the last two years.
From a technical perspective, this appears to be a great place to add gold and/or silver.
#3 Increase in Demand
And finally, we are witnessing record demand.
All markets, whether we’re talking about stocks, housing, or rare Pokémon cards function on the principles of supply and demand.
When demand exceeds supply – when there are more people trying to buy something than sell it – prices go up.
This is a basic economic law that has been true since the beginning of time.
And right now, that is the exact situation we find ourselves in.
Demand for gold and silver are near the highest ever recorded.
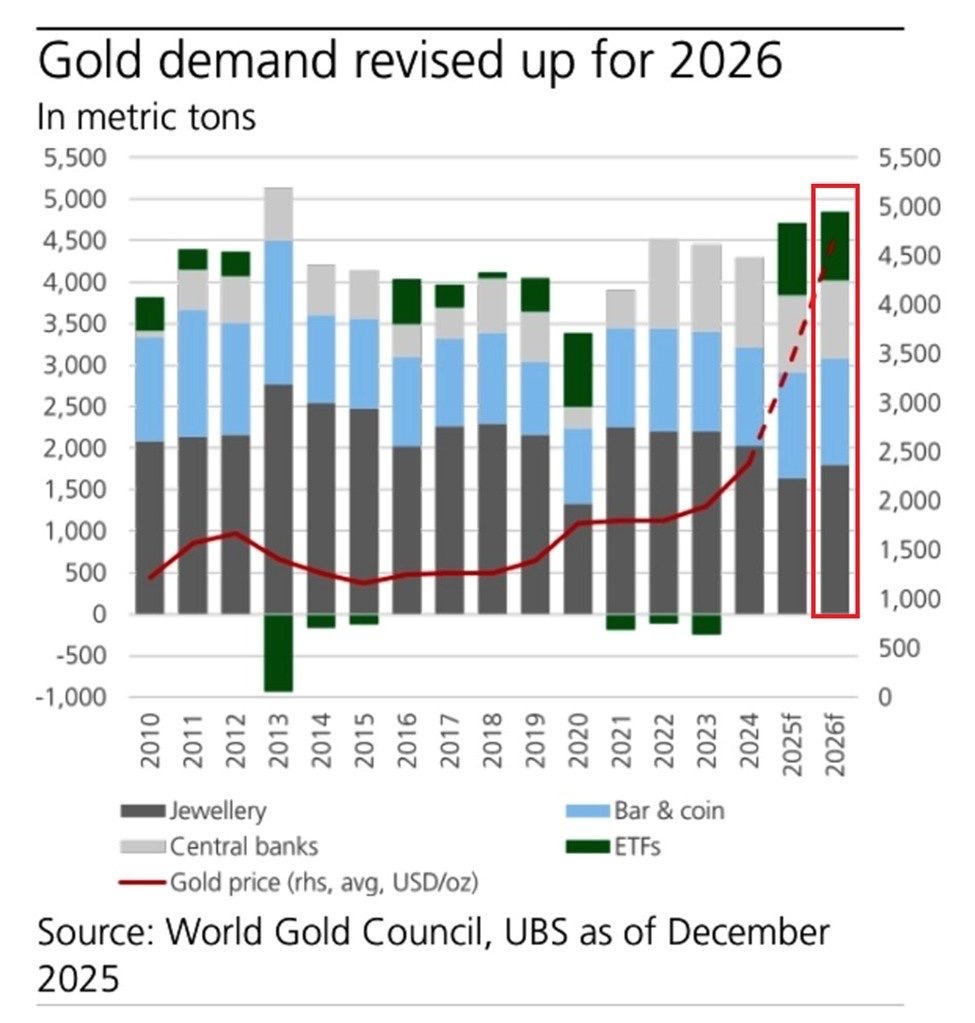
Central bank purchases have quintupled since 2022, and they’re expected to buy another 1,000 metric tonnes of gold in 2026.
Jewelry demand is estimated at 1,700 tonnes.
And physical-backed gold ETFs, which are seeing record inflows, are set to record 900 tonnes of purchases for the second consecutive year.
That is not even including regular folks like you and me who buy a steady 1,300 tonnes annually and climbing.
China bought gold every single month in 2025.
Goldman Sachs calls this a “structural shift.”
And 95% of central banks expect global gold holdings to increase.
What we are witnessing is de-dollarization on a global scale.
And here’s the wild part…
Despite gold’s biggest rally in half a century, average portfolio allocation to gold is less than 1% globally.
Morgan Stanley recommends 15–20%.
When I was at JP Morgan, I always recommended at least 5–10%.
But retail barely owns it.
If portfolios shifted just half a percentage point more, JP Morgan models gold at $6,000.
At 5%? 10%? We’d easily be pushing $10,000 an ounce.
Now let’s talk silver…
COMEX silver inventory sits at ~82 million ounces.
That’s 75% lower than 2020.
In one week, 47 million ounces were claimed for delivery.
That’s over HALF of total inventory.
Silver has been running supply deficits since 2021.
Total deficit? ~800 million ounces.
That’s nearly an entire year of global production missing.
Industrial buyers used to hold 3–4 months of supply.
Now?
About one month.
AI chips… solar panels… batteries…
Industrial demand is not slowing.
And unlike gold — silver has a true industrial squeeze.
So, here’s the macro picture. We have:
- $144 trillion global money supply and growing
- $44 trillion printed since 2020
- Central banks hoarding physical gold
- 4,900 metric tonnes of annual demand
- Silver inventories down 75%
- 800-million-ounce supply deficit
- Global retail allocation under 1%
Look, the January 30 dip in metals prices was painful. I get it.
But that’s all it was – a dip.
And dips, if you’re playing the long game, are a gift.
Many of the same people who sold silver when it fell to $75 will be back buying at $175.
It happens every time.
Nothing goes straight up. Prices need to correct, absorb sellers, and consolidate before starting their next run higher.
That’s where we are today.
And that’s why I believe this is the time to buy.
Best wishes for your trading,