Weekly Update: Fed Cuts Rates. What Will Stocks Do?

Good evening, and welcome to this week’s edition of Stealth Trades!

The Fed cut interest rates Wednesday for the first time in 2025, blaming a weaker labor market. A jobs revision earlier this month showed that 911,000 fewer jobs were created last year than previously thought.

If you’re not aware, the Federal Reserve has two jobs which they refer to as a “dual mandate.” Those are to control inflation AND ensure a healthy labor market.

When prices rise and inflation gets out of control, they raise rates to combat it. That is what happened in 2022 which triggered a bear market.

But, when the economy is weak and unemployment is rising, they lower interest rates to stimulate the economy. And that is what happened this week.

Powell and his buddies at the Fed have found themselves in a precarious position…

On the one hand, the economy is slowing, job growth is dwindling, so they need lower rates to fix this

On the other hand, inflation is at 3% – firmly above their 2% target. Historically, the Fed does not cut rates when inflation is this high. In fact, they haven’t done so in more than 30 years. But this week they had no choice. Rate cuts, after all, will only add to the inflationary trend.

The September “dot plot” showing where Fed members see rates landing over the next 2 years shows a definite trend toward more and faster cuts.

So, what does this do to stocks?

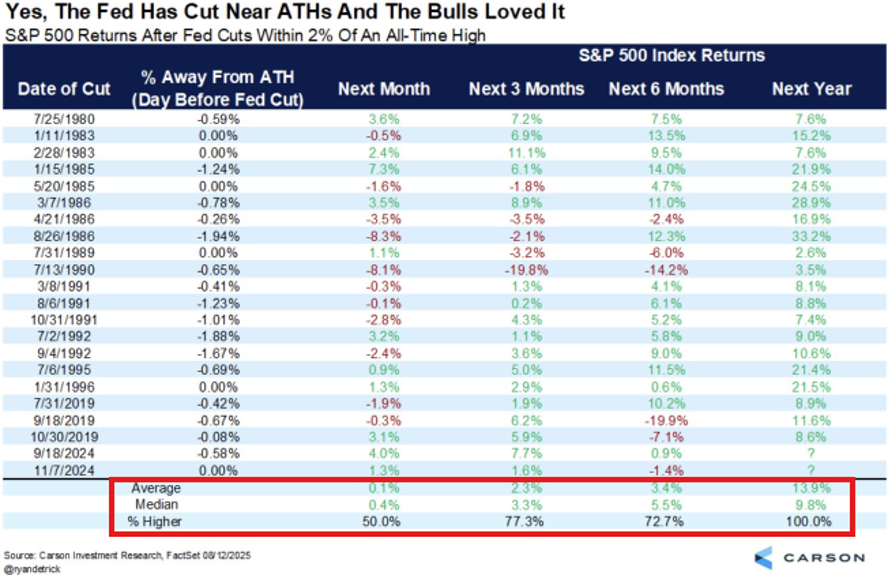
If history is any indication, the market goes up from here.

Only 20 times in history has the Fed cut rates with the S&P 500 at all-time highs. And in each of those occurrences, the market was higher 12 months later by an average of 13.9%
Mortgage rates, which had already priced in this week’s 0.25% cut, have actually ticked up since Wednesday.

Below is a chart of 30-year bond yields:

Following the record-setting negative jobs revision, yields came down in anticipation of a September rate cut by the Fed.

After hearing that cut would be 25 bps and not 50, yields came up by 0.10% the following day. So don’t expect lower mortgage rates until we see more cuts.

What we are likely entering now is a period of what’s known as stagflation. This is when you get stagnant economic growth but high inflation.

It’s not a good thing. And investors need to be prepared.

The last time this occurred in the US was in4 1970. Unemployment rates were above average, GDP growth was minimal, but prices were rising faster than usual. So, things got more expensive, but people were not making more money.

Right now, GDP is growing at a 3% clip. This is interesting given the weakening jobs numbers. As you can see below, the unemployment rate has been trending upward for the last 12 months.
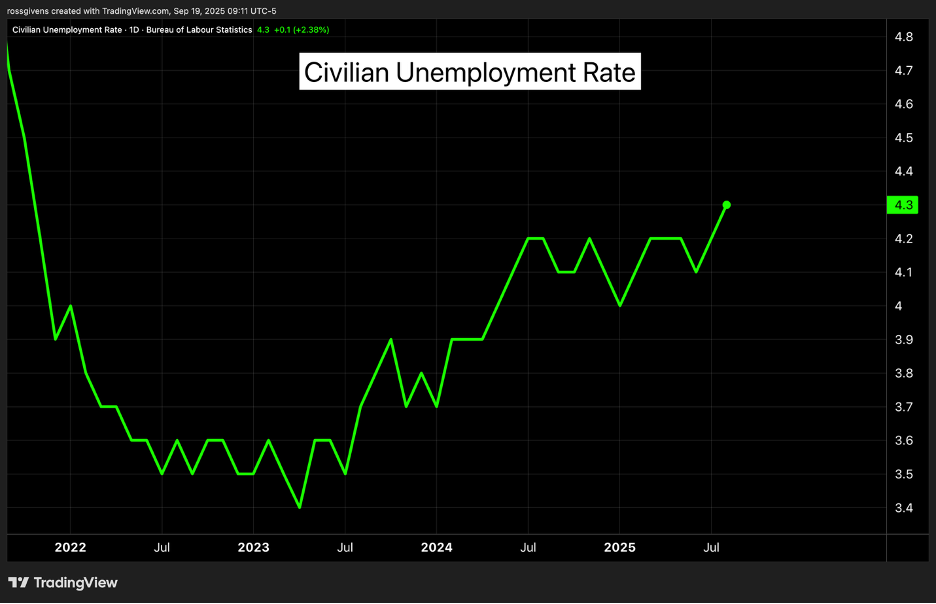
My guess is that AI and other new technologies are making American workers more efficient, so even with fewer people in the labor force, they are still able to produce more goods and services.

And the cherry on top?

All of this is happening while stocks are trading at the highest valuations in history.

Using all traditional valuation metrics – P/E, P/B, P/S, Market Cap/GDP – today’s stock market is the most overvalued in history.
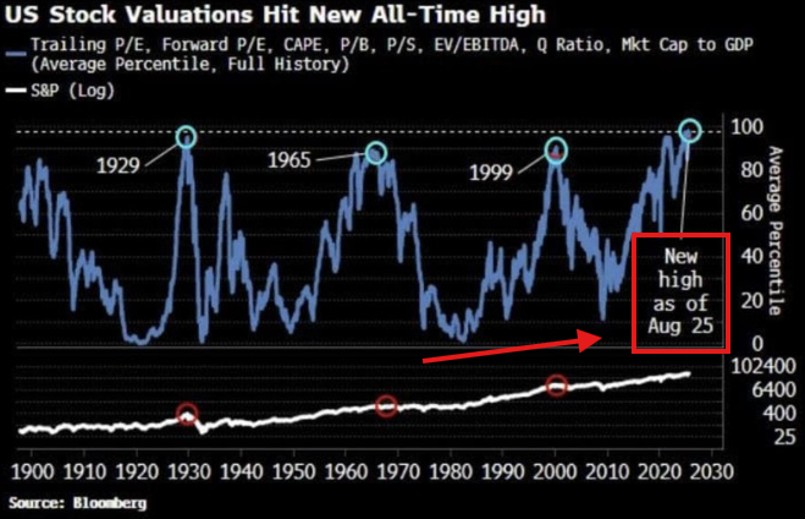
 This is a dangerous formula…

Strong GDP growth pushes stocks higher. Rate cuts, which we are expecting 4-6 more of over the next year, also make stocks go up. So does inflation which remains above average.

So, unless we see massive productivity growth in the age of artificial intelligence, it is hard to imagine a scenario that does not lead to an epic market crash.

It happened in 1929. It happened in 1999. And it is likely to happen again sometime this decade.

Will we see a crash next year? Unlikely. The data points to higher prices and every macroeconomic factor confirms that trajectory. But it will happen eventually.

Don’t let this scare you. There have been 18 bear markets since 1929, and we have recovered from every one of them. The next will be no different.

When conditions sour and the party comes to an end, we will let you know. Until then, put your foot on the gas, make some money, and let’s party like it’s 1999.

Best wishes for your trading,

Weekly Update: Stocks Come Ripping Back (Charts Inside)

Good evening, and welcome to this week’s edition of Stealth Trades!

After a volatile few days of trading last week, stocks came ripping back to tack on 2% for the week.

The Nasdaq and S&P 500 both made new all-time highs today.

The home construction sector is holding strong, but we are also seeing “risk on” movement as solar, crypto and quantum computing stocks showed tremendous strength this week.

Instead of wasting time on lengthy analysis, I am instead going to share some of my favorite stocks in a few of the hottest sectors.

Quantum Computing

D-Wave Quantum (QBTS)

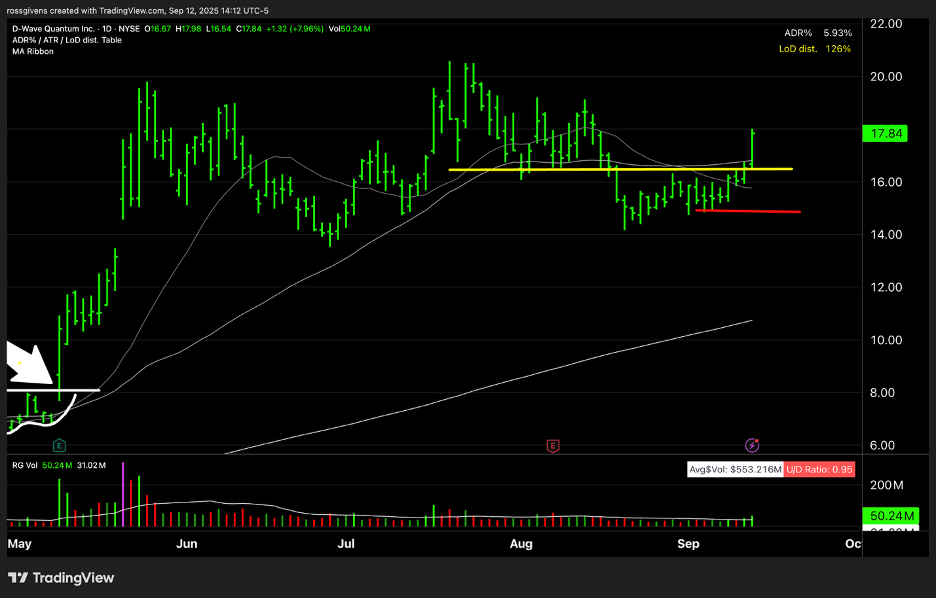
I shared this trade idea in Tuesday’s “Two Trades in Two Minutes” YouTube video, recommending a buy above $16.50 on a breakout. That triggered yesterday and then surged another 8% today. This was a clean breakout on above-average volume that should lead to a re-test of the highs and potentially new highs.

Quantum Computing (QUBT)

This chart is nearly identical to QBTS above but, believe it or not, these are different companies and different stocks.

Personally, I would trade one or the other. Both are pre-profit firms with almost no current revenue, so they are purely momentum trades.

Roblox (RBLX)

Roblox has been a market leader for the last year and a half, and it has tripled since November.

The stock finally took a breath in August to consolidate and absorb the move, but it looks poised for another rally on a move above $136.

Nuclear Energy

The nuclear sector has cooled, and Wall Street appears to be consolidating their bets. 6 months ago, every nuclear stock on the exchange was surging. But today funds are getting more selective and homing in on the ones most likely to succeed long term.

SMR has been one of my favorites for the last few years, but it has completely run out of steam. OKLO, on the other hand, is pressing against its highs.

Oklo, Inc. (OKLO)

I initiated a small position in this stock on Thursday at $80. I also placed a limit order to buy more at $75 since I was/am hoping the stock consolidates a bit more to absorb more supply before beginning its ascent.

That $75 buy may or may not get filled. In a perfect world, I’d like to see OKLO come in and trade tight in the $75-$80 for a week or two and then rip to new highs.

Cameco (CCJ)

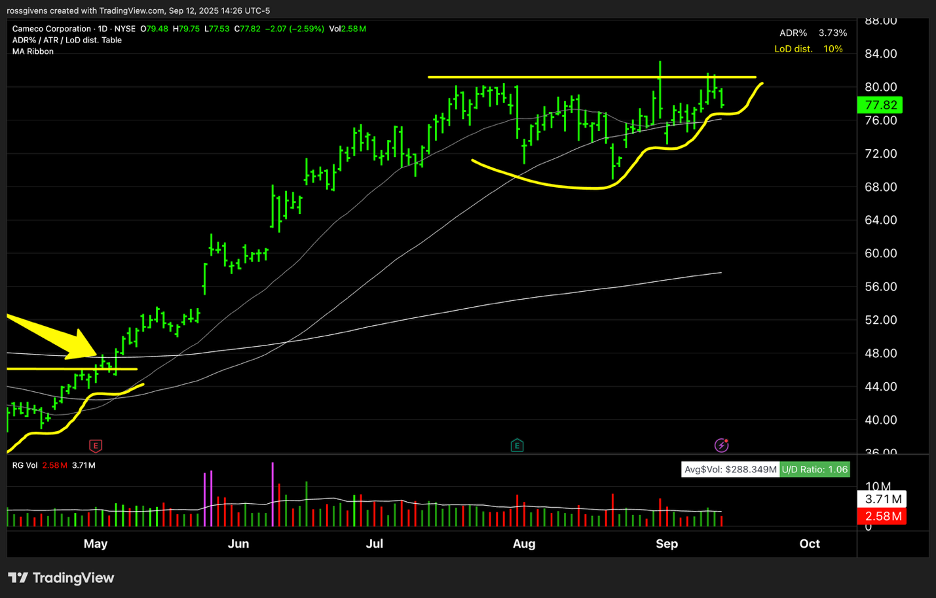
Uranium miner, Cameco, also looks strong. After a failed breakout attempt on August 29th, the stock pulled back into its base and continued to compress.

CCJ looks poised for another run higher.

Interestingly, we are seeing stocks rally alongside precious metals. This is historically rare since they tend to move inversely. Gold and silver have long been viewed as a hedge during uncertain times.

But the US federal government has proven they are unable to cut spending in any meaningful way. And investors are starting to see the writing on the wall. Debt continues to climb, and Uncle Sam will be forced to keep printing money at an ever-accelerating pace.

This means two things – inflation and a devaluing of the US dollar. Both will cause demand to weaken for government bonds. And with $37 trillion worth of federal paper already out there, investors are beginning to look elsewhere for stores of value.

That, in my opinion, is why we are seeing such a powerful rally in gold and silver.

Mining stocks typically make exaggerated moves in the direction of metals. Since their profits are leveraged due to mining costs, even a 10-20% rise in gold can cause these stocks to double. So, it is unsurprising that miners have been one of the strongest performing areas of the market this year.

The VanEck Gold Miners ETF, GDX, is up 27% from where I bought it in my retirement account in August:

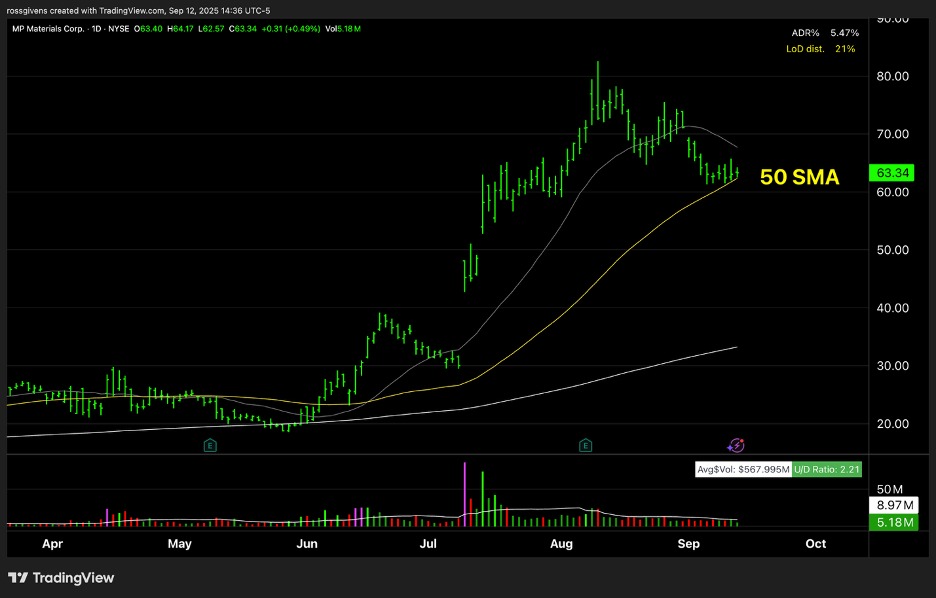
MP Materials (MP) is a rare earth miner securing huge deals with the Department of War and other major players.

It just touched the 50-day simple moving average (yellow line on chart below) for the first time in months.

This is a great place to make a pullback buy on what has been a monster mover.

Trend followers looking to hitch their wagon to a winner may consider Sandstorm Gold (SAND), Coeur Mining (CDE), Iamgold (IAG) or First Majestic Silver (AG). All are showing tremendous relative strength and showing no signs of slowing down.

We can walk through these in greater detail in Monday’s live trading session. We have begun hosting these on YouTube to deliver a better viewer experience and your feedback has been positive.

Here is the link to join Monday’s session at 9am ET: https://youtube.com/live/DCAkq6BHivQ

I hope to see you there.

Best wishes for your trading,
Weekly Update: Bitcoin Is Out of Gas

Good evening, and welcome to this week’s edition of Stealth Trades!

On July 10th, I called a BUY in Bitcoin.

It was emerging from a classic breakout pattern. The stock market was full steam ahead. It was a “risk on” environment.

It should have run 40-50%…

But it didn’t.

BTC rose nicely for 2 days, but that was it. No follow through. No rally to 140k like I was expecting.

After a few weeks I sold my position near breakeven. And after taking a step back on the chart, I probably should have known better.

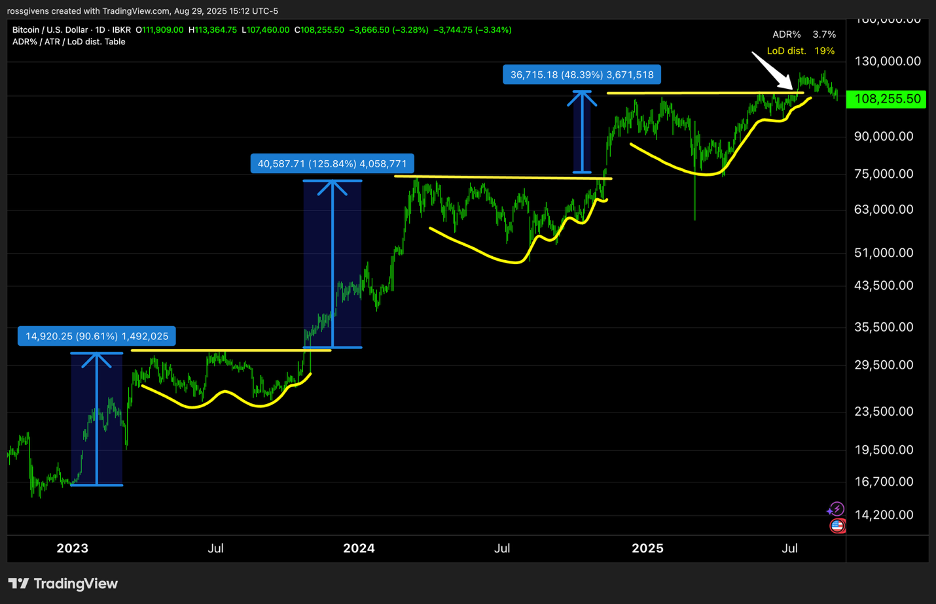
Below is a daily chart of Bitcoin from January 2023 to present.

I put it in logarithmic scale in order to equalize the rally heights.

You’ll notice a very clear pattern here…

Big move higher, followed by a 6 to 12-month consolidation, leading to another big move higher.

The July breakout was to be the 4th such move. It was late in the cycle. And betting on another burst higher was a low odds bet.

Most stocks (or cryptocurrencies in this case) see 3 to 4 rallies during a Stage 2 uptrend. If you can catch the first one, you will make a lot of money very quickly.

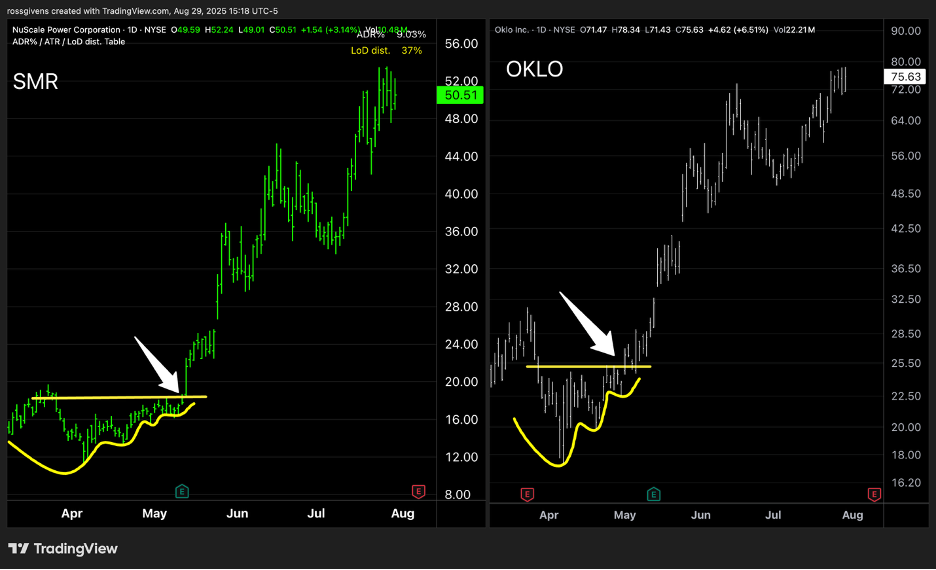
That’s what we did with SMR and OKLO back in May when the market was just coming off the bear market lows.

The second breakout, assuming you are still in a healthy bull market, can be equally powerful.

The third one is a little riskier. Your odds of success go down a hair and the percentage move is generally a bit less, but I will still take them.

After that though, the odds go way way down.

Fourth and fifth phase breakouts have a much higher failure rate. In hindsight, I should have focused on other stocks in earlier Stage 2 advances. Or just sat out until new opportunities emerged.

Sometimes, the best trade you can take is to stay in cash.

This is a tough one for me. I hate seeing my money sit idle. I want to find a new opportunity to keep the compounding going.

Lately I have been focused on the solar, homebuilding and building materials sectors. These have outpaced others over the last few months and appear to be emerging as new areas of leadership.

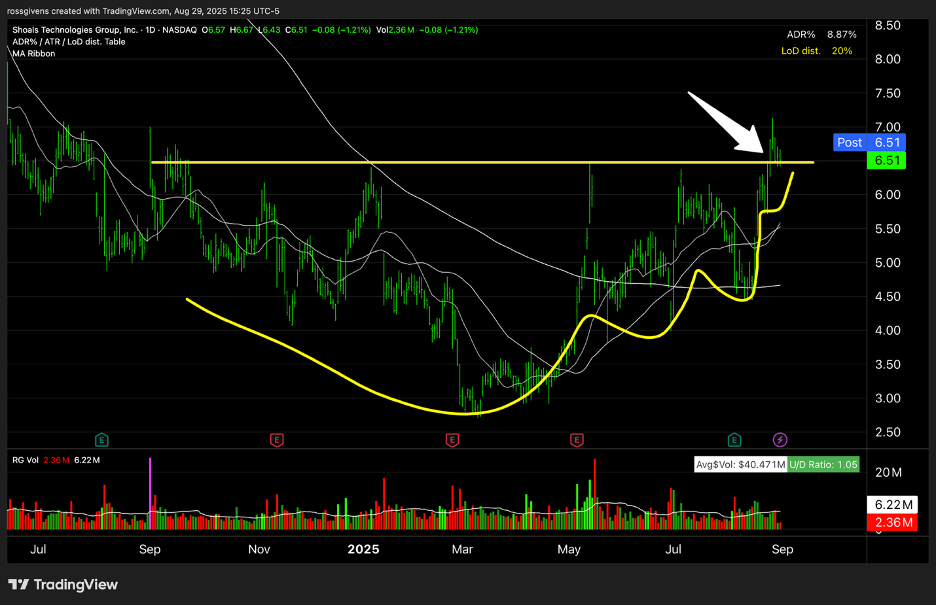
I took a position in Shoals (SHLS) last week on this breakout through $6.50.

It showed initial strength but has failed to follow through.

Today we got news that core CPI came in at 2.9% which is the highest we have in six months. This is also the Fed’s go-to inflation metric, casting doubts on a September rate cut.

This took a toll on the indexes Friday and stalled rate-sensitive stocks like lenders and homebuilders.

I hope to get more clarity from the market after the September 17 Fed meeting. If Powell decides not to cut, we will likely see a short-term pullback of 5-10%. A 50-basis point cut, on the other hand, would send stocks soaring.

Once again… Powell holds the reins.

Best wishes for your trading,
Weekly Update: Powell Sends Stocks Higher

Good evening, and welcome to this week’s edition of Stealth Trades!

Fed Chairman Jerome Powell has been hesitant to cut interest rates.

After massive money printing following COVID led to record-level inflation and the Federal Reserve was humiliated when their “transitory” prediction proved to be completely false.

Despite calls for lower rates from the President, Secretary of the Treasury, several Fed governors, and pretty much every Fortune 500 CEO, Powell has stubbornly refused to cut.

On Friday, Powell spoke at the Jackson Hole Symposium. Investors hung anxiously on his every word to hear whether we might finally get cuts in September.

And, lucky for us, that’s exactly what we got…

Powell came out dovish for the first time all year and all but confirmed rate cuts at the September meeting.

Investors cheered. Stocks soared. And bond yields came down today.

But, as expected, some areas did better than others. If you have been to any of my live events in the last few weeks, you have heard me talk about the strength I am seeing in the homebuilding sector and why I am extra bullish on those stocks.

Lower rates mean lower mortgages, and homeowners with 3% mortgage “golden handcuffs” might finally come into the market. I expect a housing boom in 2026 and 2027. And it appears that investors agree…

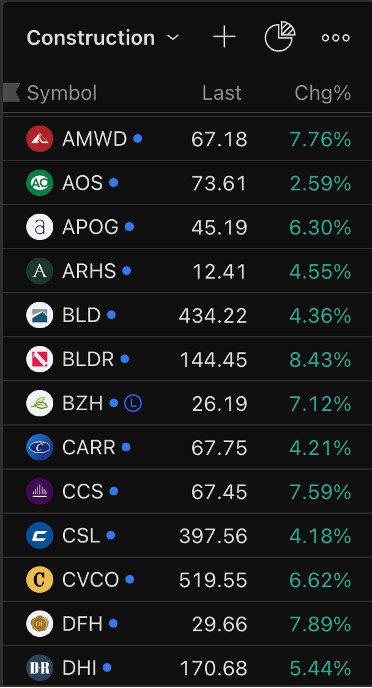
Homebuilders and building materials stocks soared, and many made new multi-month highs.

Mortgage and lending stocks also saw big gains with companies like Rocket Companies (+9.27%) and Upstart (+8.27%) leading the way.

A quick look at our sector performance charts shows a clear favoritism for this sector among institutional investors.

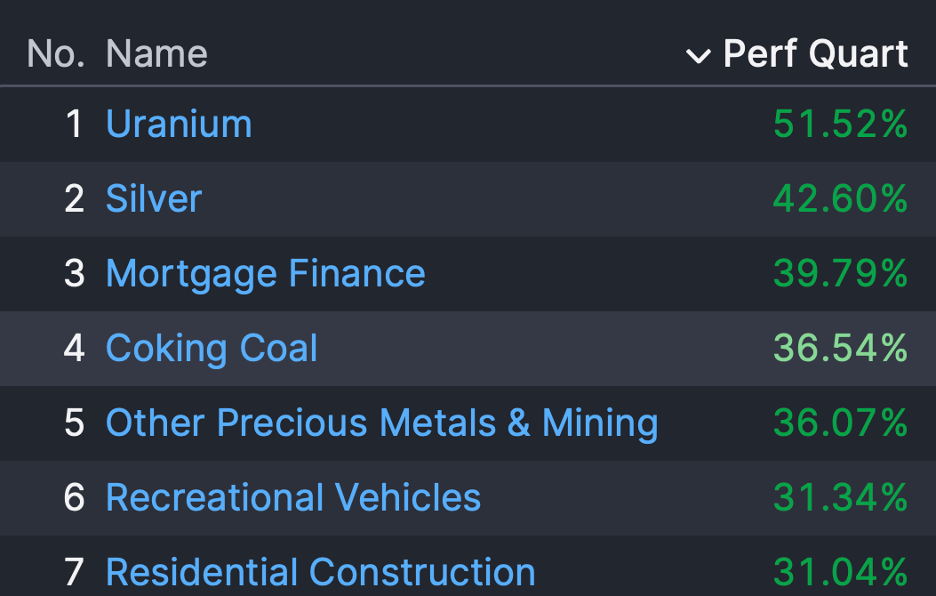
Tyler – a Traders Agency member and regular attendee of my Monday morning live sessions – sent me a link to an even bigger scanner from Finviz. It scans 144 industry sectors to identify which ones are leading the pack.

Look at the leaders this month: mortgage firms, residential construction, home improvement stores…

There is a similar pattern over the last quarter:

Nuclear and mining stocks have been hot all year, but construction is quickly climbing up the ranks.

Many investors – even some legends that I have great respect for – have begun sounding the alarm that the top is in.

But I see no evidence to support that…

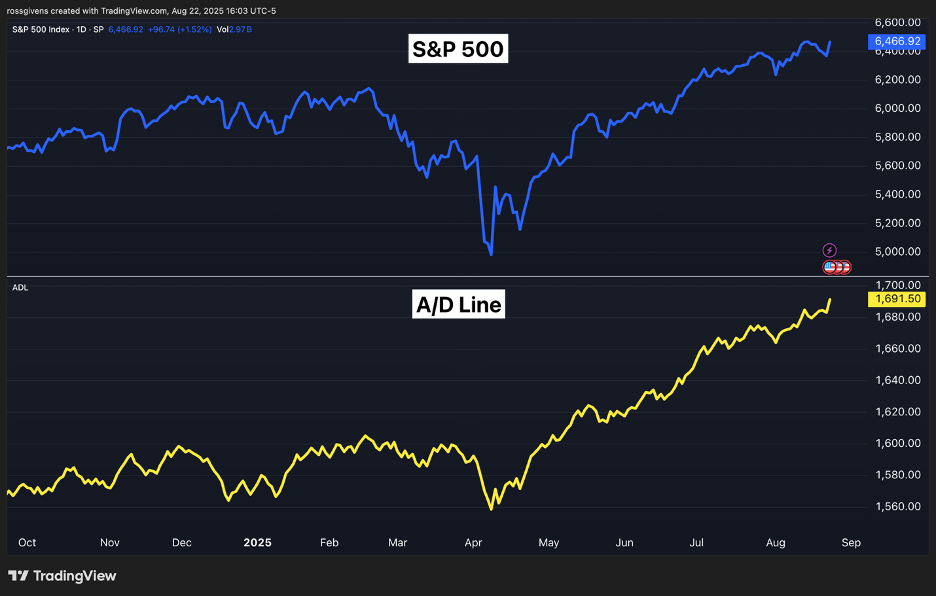
The market continues to print net new highs. It has every day but one since mid-May.

The advance/decline line – which typically breaks down in advance of stocks before a market decline – is ripping to new highs.

This not only shows no signs of a pullback but points to higher stock prices in the near future.

Don’t get too caught up in the noise. Don’t listen to the whiners, naysayers and perma-bears. Just trade what you see. And right now, I see a healthy market with a lot further to run.

Best wishes for your trading,
Weekly Update: Buffett’s $5B Mystery Buy

Good evening, and welcome to this week’s edition of Stealth Trades!

For weeks, the Wall Street rumor mill has been stirring over a mysterious new $5 billion investment by Warren Buffett.

This morning, we learned what it was…

Despite reports by several sources claiming one large bet, it ended up being $5 billion invested in a small handful of stocks.

The biggest was United Health (UNH). Following the CEO’s assassination earlier this year, UNH stock has been battered. It is down more than 50% from its 2025 highs and Buffett decided to take advantage.

He purchased 5,039,564 shares between April 1 and June 30.

The rest of his buys, at least the major ones, came from the real estate/housing/construction space.

The Oracle of Omaha more than tripled his position in homebuilder Lennar (LEN). He also added 2 million shares of Pool Corp (POOL) – a clear bet on a boom in new home construction.

Berkshire Hathaway reported new positions in the real estate investment trust, Lamar (LAMR), and the building materials company, Allegion Plc (ALLE).

We have been seeing strength in the construction sectors for the last couple months now as I have discussed in our recent live webinars.

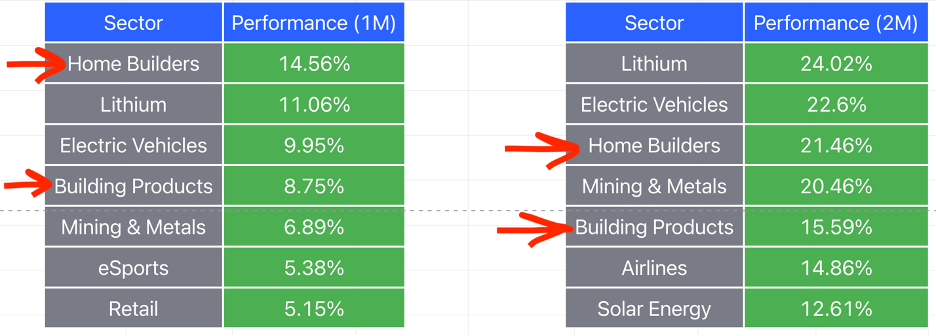
The 1 and 2-month sector performance charts below show these areas steadily rising up the ranks.

Buffett, along with myself and a lot of Wall Street, are betting on a housing boom.

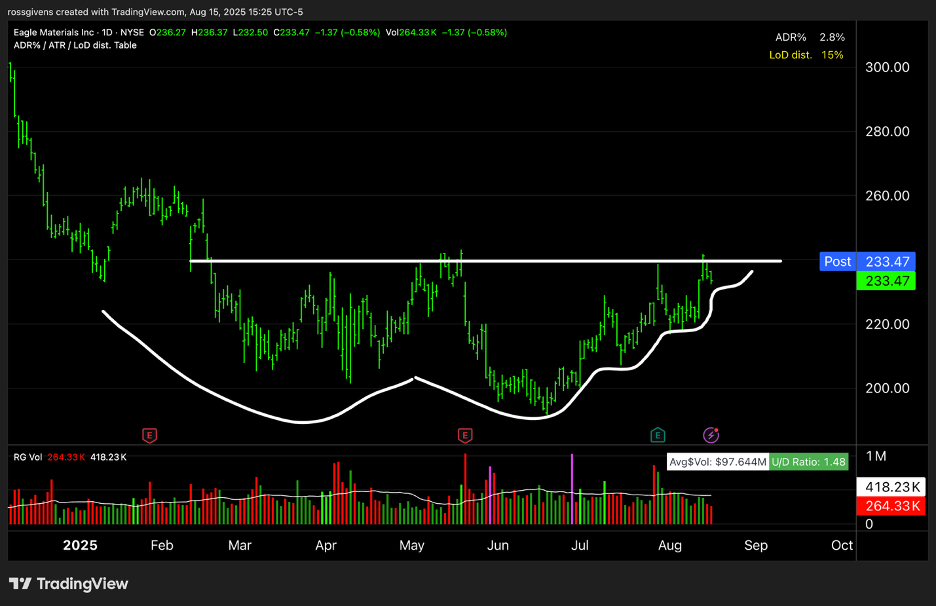
I recommend watching stocks in these areas for potential breakout trades. Eagle Materials (EXP), for example, looks primed for a strong move higher.

I made a video walking through Buffett’s 13F filing as well as a few ways to position your money to profit from a move in this sector. Here’s the link if you want to take a look: https://youtu.be/Z02U-gx_mlY

We will discuss this more in Monday’s live training session at 9am ET. I’ll see you there.

Best wishes for your trading,

Weekly Update: Eye Opening Chart

Good evening, and welcome to this week’s edition of Stealth Trades!

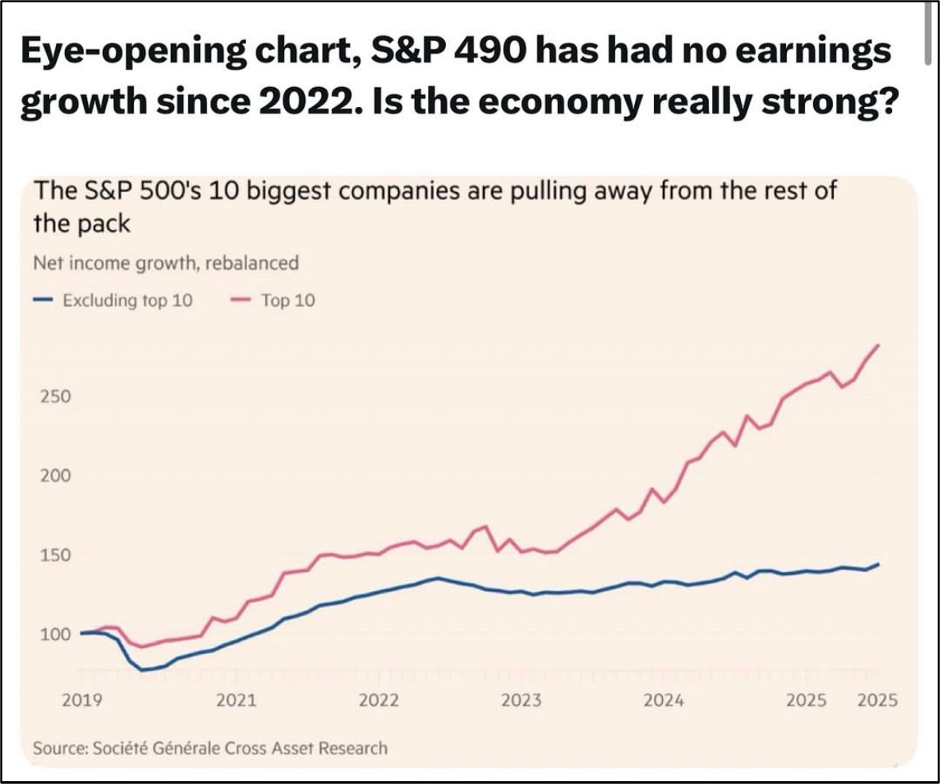
Here’s a scary chart…

Excluding the top 10 stocks (Nvidia, Apple, Amazon and the usual suspects), the other 490 stocks in the S&P 500 have seen almost no earnings growth since 2022.

For some people, this is alarming. They think the stock market has gone up too far too fast with no fundamental reason.

But nothing could be further from the truth…

You’ve heard me talk about the “theme” of the market and how I like to laser focus on the areas seeing the most strength.

Because guess what? Those are the stocks that ARE seeing big earnings growth or are at least expected to in the coming months.

The 2009-2020 bull market did not take place because the entire economy grew at record pace. GDP only grew at about 2% in each of those ten years. The stock market, on the other hand, gained an average of 13% each year.

How is that possible?

One word… concentration.

Just as the top 10% of earners pay the majority of all income taxes, the top 10% of stocks generate the majority of the profits.

In the 2010-decade, big tech was leading the charge. Facebook, Amazon, Google, Apple and Netflix saw MASSIVE earnings growth. As a result, they saw their share prices and market caps soar.

This meant the companies with the fastest earnings growth were also representing a larger and larger share of the market indexes.

We saw the same thing with Nvidia over the last few years.

In 2021, Nvidia represented just 1% of the S&P 500 index. Then came the AI boom. They have grown earnings at 74% PER YEAR for the last five years. This one stock now makes up a whopping 8% of the S&P 500.

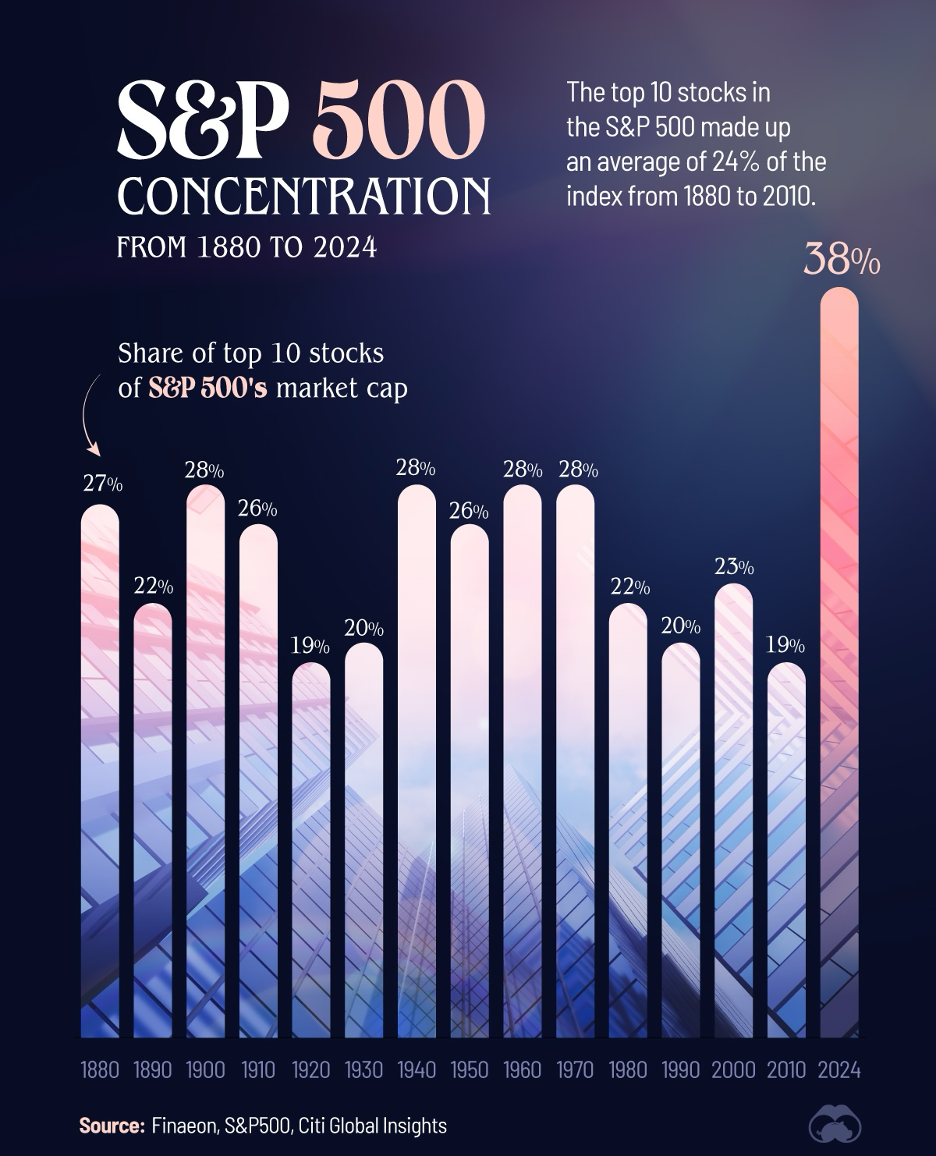
Today, the top 10 stocks control 38% of the index.  This is higher than usual, but not as much as you think.

Even as far back as 1880, the 10 largest companies were a quarter of the overall market.

Today that figure is at 38%. But it makes sense…

Globalization has allowed firms to expand worldwide quickly and efficiently. Companies like Google and Netflix can expand across the globe with nothing more than a few offshore server farms to support the load. Everything is digital.

Sky high profits also mean deep pockets, and big tech has been systematically gobbling up its competition for years to grow by accumulation.

If I were to guess, I would bet that 38% figure is higher in ten years, not lower.

I always laugh when I hear someone say they have a concentrated portfolio of 10-20 stocks. Because 9 times out of 10, those are the same 20 stocks everyone else holds – Apple, Alphabet, Nvidia, Microsoft, etc.

You’re not going to outperform the market with those mega cap stocks… you ARE the market.

Personally, I’m glad the growth is only coming from select areas. That’s what gives us our edge. If out of 500 stocks, only 40 or 50 of them delivered all the earnings growth, think about how much better you will do by owning just those?

I don’t want to own the whole market. I don’t want to “ride the index” like every other sucker. I want to be where the action is. I want to be in the fastest growing stocks during strong bull markets and watch those stocks double and triple.

That’s the recipe for a big performance. That’s how you beat the market.

Best wishes for your trading,

Weekly Update: Here’s Your Pullback

Good evening, and welcome to this week’s edition of Stealth Trades!

One of the great fallacies of trading is that we wish for a pullback but when it comes, it is hard to buy.

Right now, stocks are pulling back. The Nasdaq opened today below its 20-period moving average for the first time in 100 days.

But believe it or not, this is a good thing…

The market experienced an incredible rally over the last four months – a 40% move in just 115 days. But strength like this is not sustainable.

The market needs to ebb and flow. Powerful moves higher must be digested and absorbed before the next advance can begin. When it doesn’t, the inevitable crash is always painful.

We saw this in the dot-com bubble of the late 90s, the post-COVID tech and crypto boom, and countless other examples where market euphoria drove certain stocks to irrationally high valuations.

We need sellers. We need investors to take profits, sell short and put up some resistance in the market in order to keep prices fair and orderly. Great stocks will still outperform, and breakouts will still work. In fact, breakout trades will work even better after sellers have been absorbed and supply dissipates.

As of this morning, the major indexes are down about 2% on the day. Tariffs kicked in today and Trump did not extend the deadline like usual. In fact, he imposed a wave of new tariffs that could slow economic growth.

Amazon fell 8% overnight after earnings showed lower-than-expected growth in AWS. Coinbase also gapped down on weak numbers. This didn’t help either.

But, in my opinion, this retracement is a positive thing. Many of the top stocks I am watching are extended. I like to buy from tight consolidation areas – not at the top of a 60% advance. This pullback will allow some of those names to compress and set up fresh new entries.

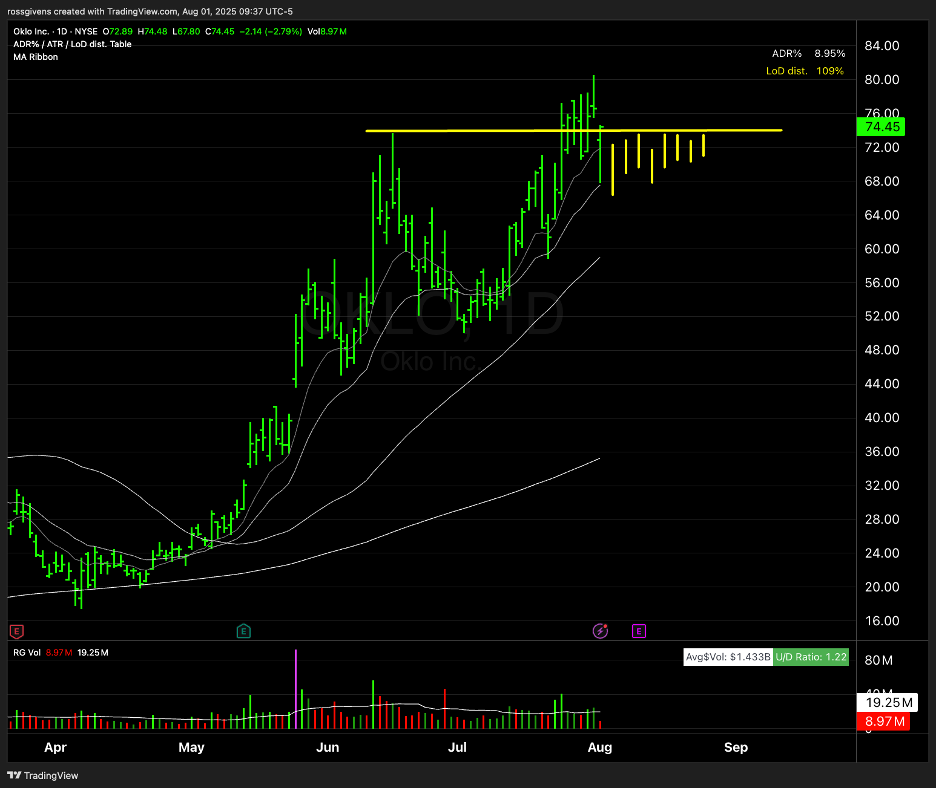
Nuclear is still my favorite sector right now. OKLO, which I bought on the initial breakout in April, has tripled. But if it can tighten up, absorb the sellers, and do something like what I’ve drawn below, I would love to get back in.

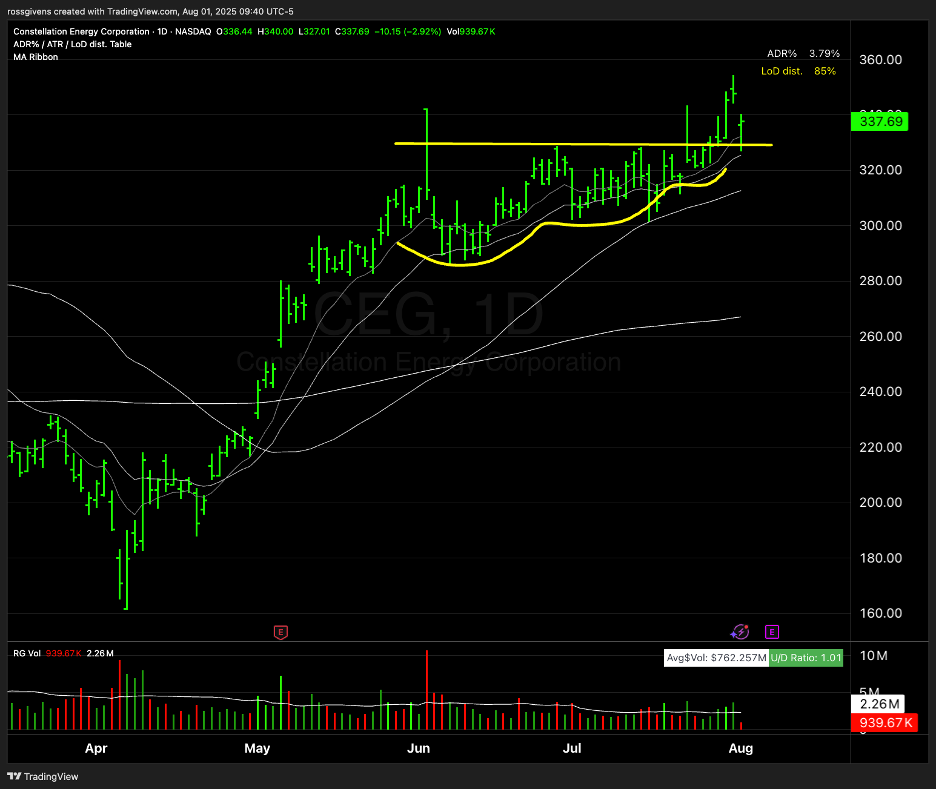
Another nuclear stock, Constellation Energy (CEG), is retesting the breakout area:

So is Dennison Mines (DNN):

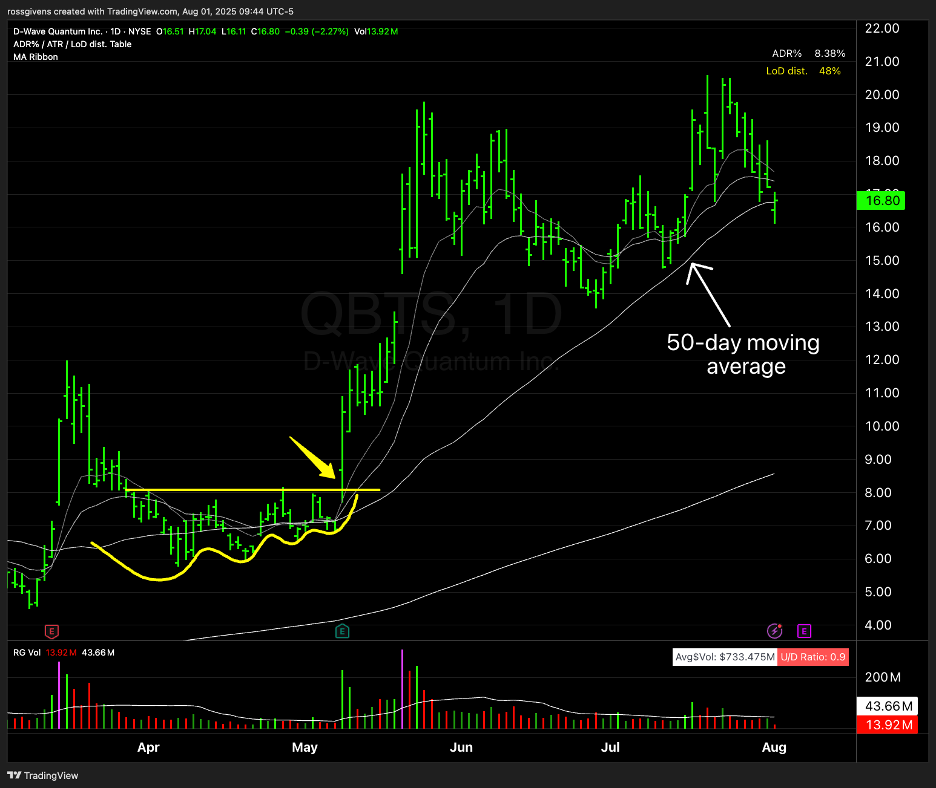
D-Wave Quantum (QBTS) is kissing the 50-day moving average for the first time since the May breakout:

Historically, the first touch of the 50-day is almost always a great entry in a market leading stock.

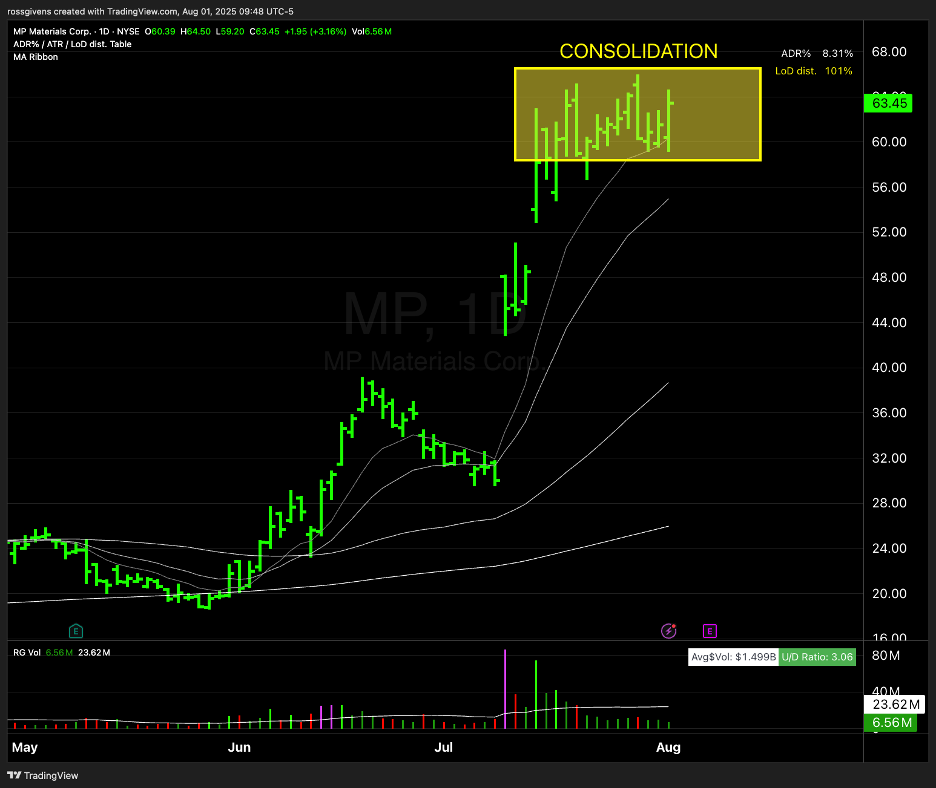
MP Materials (MP) is making huge deals in rare earth minerals with everyone from Apple to the Department of Defense. This stock has been a monster, and it is completely ignoring the market dip.

Watch for a push through this consolidation area. This stock may very well run some more.

I don’t like buying stocks just because they are down. It’s like trying to catch a falling knife. You never know how far it will fall.

But these periods of market weakness are a great stress test for leading names. My preference is to buy pullbacks to support areas (key moving averages and previous breakout levels) or after they consolidate and set up for a fresh move higher. And that is exactly what I am looking for right now.

Best wishes for your trading,
Weekly Update: Is It Time to Buy Solar?

Good evening, and welcome to this week’s edition of Stealth Trades!

Follow the money. That is my investing mantra. And if you have been reading my weekly email for any amount of time you know that means focusing on the strongest areas of the markets – the ones where money is flowing into.

For the last several months, leadership has been clear – nuclear, quantum computing, AI, crypto and metals.

But I am beginning to see signs of life in a once forgotten corner of the stock market…

Solar stocks have been complete garbage for the last four years. After peaking in 2021, the solar sector has marched steadily lower as can be seen in the Invesco Solar ETF pictured below.

That is beginning to change, however.

The market strength scan I run each week shows the solar group quickly marching up the ranks.

Solar energy is now one of the top-performing sectors over the previous one, two and three-month periods.

This could be the start of a new Stage 2 move, and it is one we need to stay on top of. Because these stocks, especially after falling 80-90%, are capable of making big moves to the upside.

This is not an area I want to get super aggressive in right away. But it is worth taking a stab at a few setups here, and… if they work… start putting our foot on the gas.

Canadian Solar (CSIQ), for example, is coming out of a 10-month base formation.

Higher highs, lower lows, shallowing pullbacks… It has everything I want to see in a stock coming off its lows.

This was a $65 stock a few years ago. Today it trades for $12. If this thing gets legs, it could easily double or triple from here.

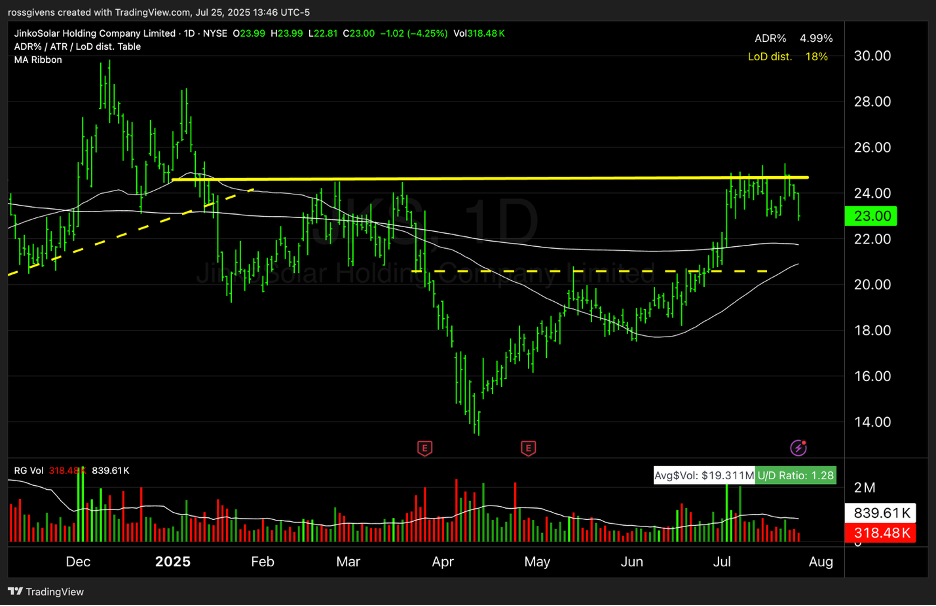
JinkoSolar (JKS) is another one…

After nearly doubling off the April lows, the stock is consolidating in the $23-$25 range where it found resistance earlier this year. After absorbing this supply, the stage will be set for another possible surge higher.

SolarEdge (SEDG), although choppy, is showing similar characteristics…

This stock fell 95% from its post-COVID highs. Three years ago, it was worth $360 a share. It now trades for just $27.

Right now, the action is volatile. Solar companies are regrouping after the federal subsidies that drove revenue growth a few years ago have been officially cut off.

But the market is never wrong. And whenever I see strong broad-based price action like this, positive news typically follows.

Will subsidies be back on the table? Has there been a technological breakthrough that will bring down production costs or increase efficiency? Have Chinese tariffs strengthened domestic manufacturers?

I don’t know. And frankly… I don’t care. Someone is buying, and they’re buying big. So, I am adding this to my list of groups to focus on.

If you don’t already have one, make a watchlist of solar stocks you can flip through periodically. In fact, I’ll save you some work. Start with these:

FSLR, ENPH, NXT, HASI, RUN, SEDG, ARRY, CWEN, ENLT, SHLS, JKS, CSIQ, DQ, ENRG, SPWR, RNW, MAXN.

I probably missed a few, but that’s a good list to start with.

Best wishes for your trading,

Weekly Update: My Top 50 Stocks

Good evening, and welcome to this week’s edition of Stealth Trades!

I have said it a thousand times, but it bears repeating…

If you want to make big money in the stock market, you need to focus on the leading groups.

These are the stocks that Wall Street is buying. Their pockets are deep. They invest billions at a time. And the areas where they are investing will rise faster than others.

Over the last two years, AI has been the dominant theme. The smart money wanted everything even remotely related to artificial intelligence. So, most of the big winners came from the semiconductor, data and software groups.

I focus almost exclusively on whatever groups are leading.

Will there be good trades in other areas of the market? Sure. But I want to stack the odds in my favor. I want every possible advantage. And buying names with big institutional support is nothing short of a cheat code for traders.

Right now, there are 5 groups dominating everything else – CRYPTO, NUCLEAR, METALS, QUANTUM COMPUTING and ARTIFICIAL INTELLIGENCE.

These are the honey holes. Look for trades on the top stocks in these 5 groups and I can almost guarantee you will outperform.

Earlier this week I published a short video covering how to build a powerful stock watchlist. If you didn’t see it, watch it here: https://youtu.be/GIJjqVHz_iE

Over time, this list will change. Certain areas of the market will become more popular, and others may fall out of favor. But doing this exercise just once a month will keep you in sync and focused on the right areas.

If you’re feeling lazy, my list is below. These are what I believe to be the top 50 stocks right now.

Each of these stocks ranks in the top 10% for relative strength, has an average daily range of at least 2%, and comes from one of the five leading groups I listed above.

There are a lot of big winners in this list. And many of them are just getting warmed up…

Crypto/Digital Payments: NASDAQ:COIN, NASDAQ:HOOD, NASDAQ:MSTR, NASDAQ:CORZ, NASDAQ:GLXY, NASDAQ:CIFR, NASDAQ:CLSK, NYSE:NU

Nuclear: NYSE:CCJ, NYSE:SMR, NYSE:OKLO,AMEX:LEU, AMEX:UEC, NASDAQ:CEG, AMEX:DNN, NASDAQ:NNE, AMEX:UUUU, NASDAQ:EU

Quantum Computing: NYSE:QBTS, NASDAQ:QUBT, NYSE:IONQ, NASDAQ:ARQQ, NASDAQ:RGTI, NYSE:ORCL, NYSE:COHR, NASDAQ:LRCX, NYSE:TSM, NYSE:RBLX

Mining & Metals: NYSE:MP, NYSE:CRS, NYSE:SAND, NYSE:CDE, NYSE:IAG, NYSE:AG, NYSE:KGC, NYSE:AU, NYSE:AEM, NYSE:WPM, NYSE:GFI

Artificial Intelligence: NASDAQ:NVDA, NASDAQ:PLTR, NASDAQ:PEGA, NASDAQ:NFLX, NASDAQ:AVGO, NASDAQ:META, NASDAQ:AMD, NASDAQ:SOUN, NASDAQ:SYM, NASDAQ:UPST, NYSE:AI

Best wishes for your trading,
Big Beautiful Breakout

Good evening, and welcome to this week’s edition of Stealth Trades!

“[Trump voice] Would you look at that? What a beautiful move. Look at that breakout.  Wow. I know breakouts and let me tell you… this one is the best. Really incredible.”

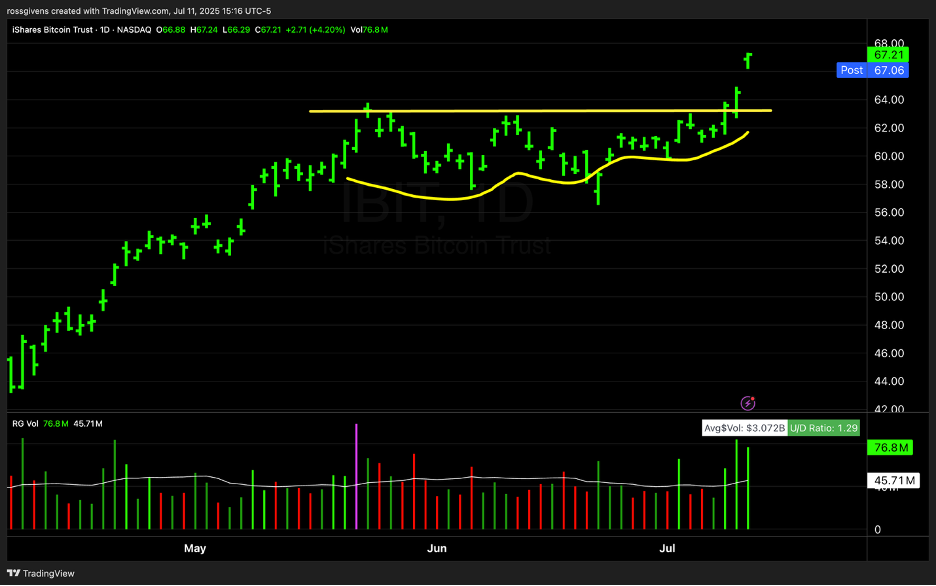
In all seriousness, this is a textbook move. If you didn’t get my text yesterday, Bitcoin broke out from a near perfect consolidation base.

After climbing nearly 50% from April to May, BTC consolidated for two months. A series of shallowing pullbacks and a clear resistance level formed the setup. And the buy signal was a breakout to new all-time highs.

The chart above is actually an IBIT – an exchange traded fund that holds bitcoin but trades like a stock on the regular stock exchanges.

Purists like to buy the actual cryptocurrency. I don’t trust most of those sketchy offshore crypto brokers, plus it is easier to buy an ETF since I can do it from any major brokerage account.

Bitcoin, at least to me, is one of the easiest instruments to trade. Since it has no sales or earnings like stocks, there are never any surprises. Transactions are driven purely by supply and demand.

Because of this, it tends to trend well and trade in an orderly manner.

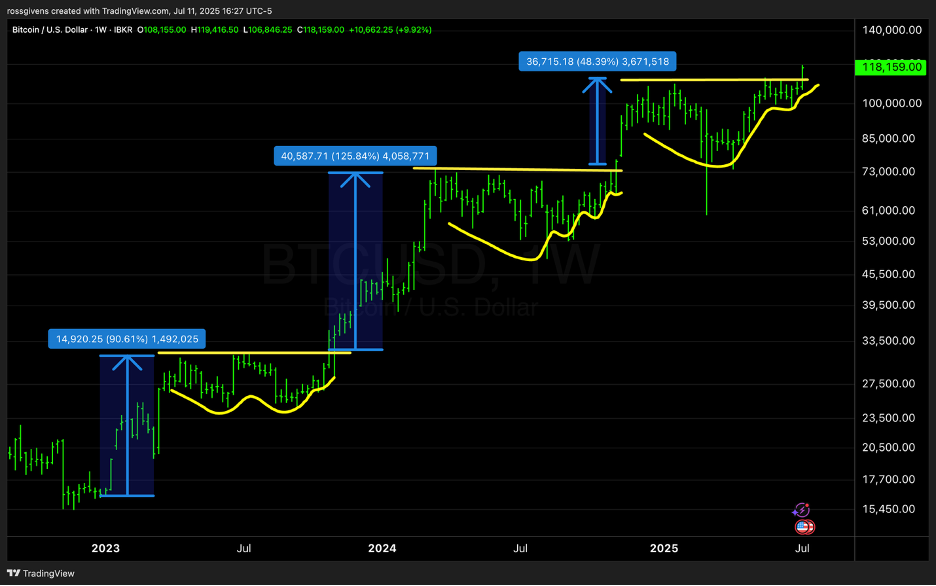
Below is a chart of Bitcoin over the last few years. Notice the pattern…

Strong move. Consolidation.

Strong move. Consolidation.

Strong move (which was stalled by the trade war). Consolidation.

It’s rinse and repeat. Nothing is guaranteed. And when the stock market undergoes a deep correction, BTC tends to follow suit.

But right now, the major indexes are trading at all-time highs. Inflation is tamed. GDP growth is healthy. And analysts expect 6 rate cuts over the next year and a half.

The stage is set for another powerful move higher for Bitcoin.

Best wishes for your trading,