Weekly Update: We Just Got BIG News for The Stock Market

Good evening, and welcome to this week’s edition of Stealth Trades!

Inflation is getting better. The job market is getting worse.

And this combination of declining inflation and a weakening job market means we are almost guaranteed another interest rate cut in January.

Thursday morning, the US Bureau of Labor Statistics released the latest CPI number.
CPI stands for Consumer Price Index. It measures the change in prices paid by consumers for a basket of consumer goods and services.

It tracks the prices of housing, clothes, food, utilities and medical care – all the basic necessities.
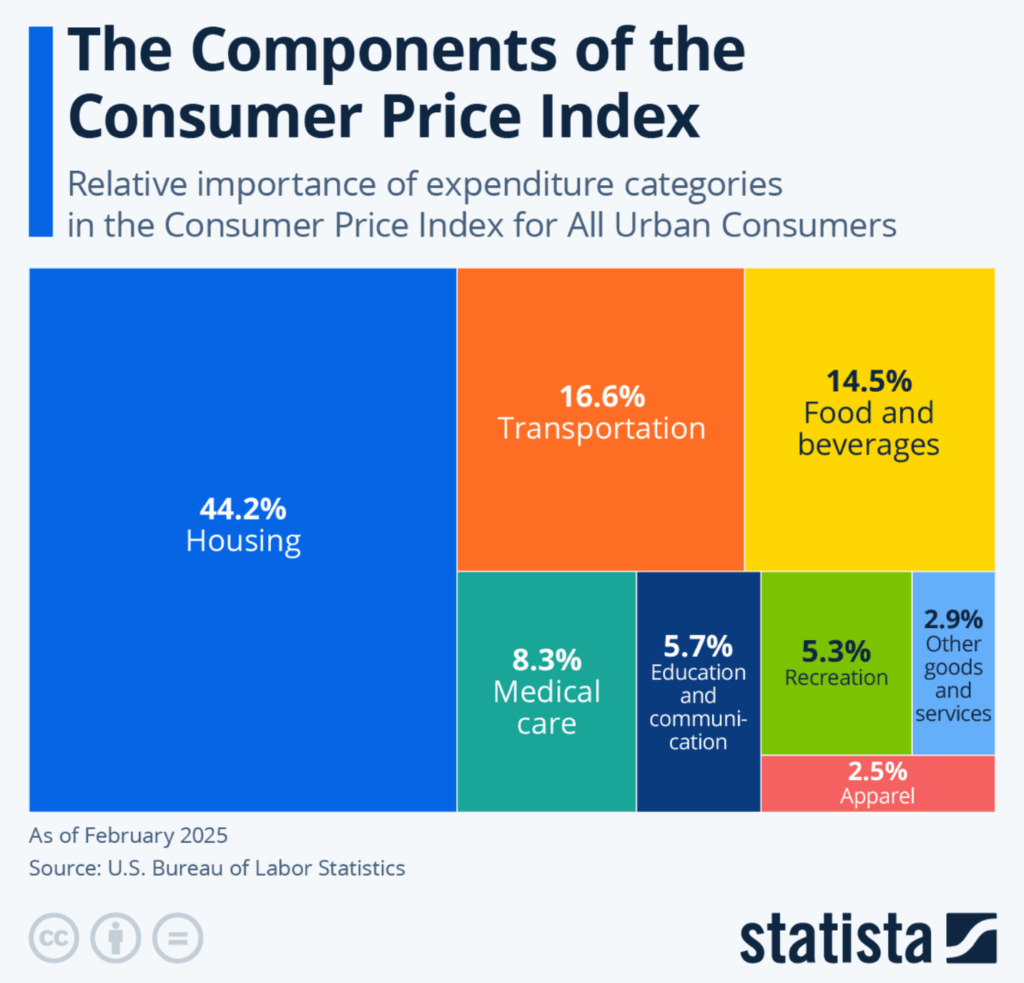
And once a month, the US Bureau of Labor Statistics compiles this data and publishes the number. Inflation is how much this figure went up compared to the same month last year.

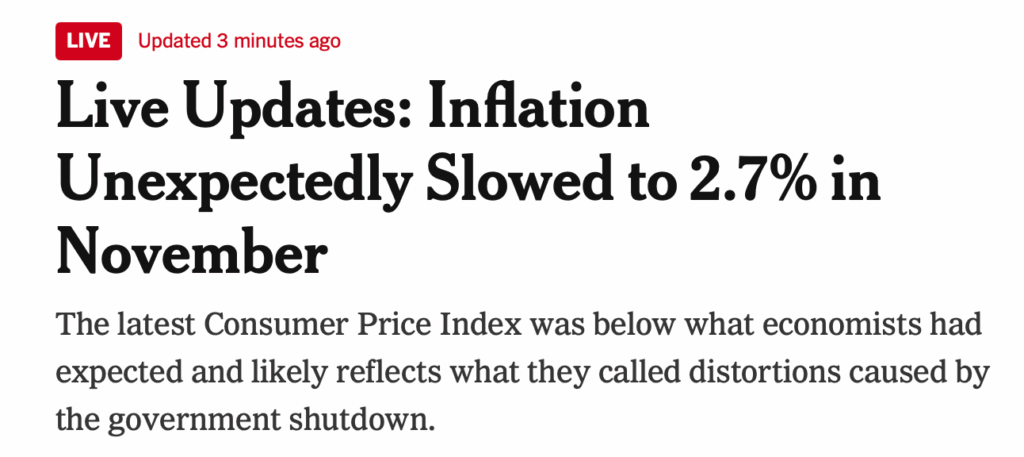
And shockingly, inflation came down in November. Prices were higher, but not by as much as they had been in previous months.

Core CPI, which is everything except food and energy prices which can be volatile, was up 2.7% year-over-year.

And while this is still above the Fed’s long-term 2% target, it is better than expected.

The August number was 3.1% – a new 6-month high.

September came in around the same at 3%.

There was no report in October due to the government shutdown, but most economists were forecasting around the same 3%.

So, 2.7% was a surprise… and a good one. But the ramifications are far bigger than saving 10 cents on beef at Piggly Wiggly.

It means the odds of a January rate cut just went way up.

Because lower-than-expected inflation isn’t the only piece of news we got this week.

On Tuesday, a new jobs report was released.

And it showed that the US labor market continues to weaken.

They released data for October and November at the same time.

The US lost 105k jobs in October and gained 64k in November – a net DECLINE of 41k jobs.

Look at the trend over the last four years.
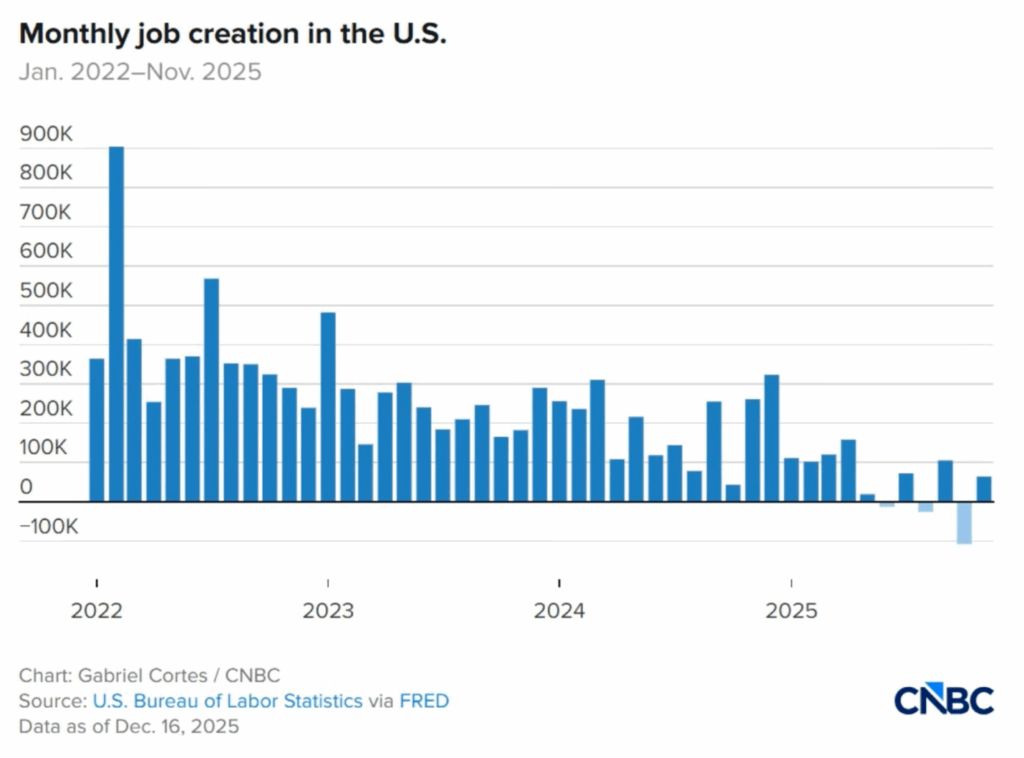
These are the jobs added on a monthly basis since 2022.

You don’t need to be an economist to see that the job market is in trouble. The numbers are steadily declining.

But it’s the last 6 months where things have really taken a turn for the worse.

In 3 of the last 6 months, the US economy has lost jobs. We haven’t lost people.

So, the unemployment rate is rising. It is at 4.6% and climbing.
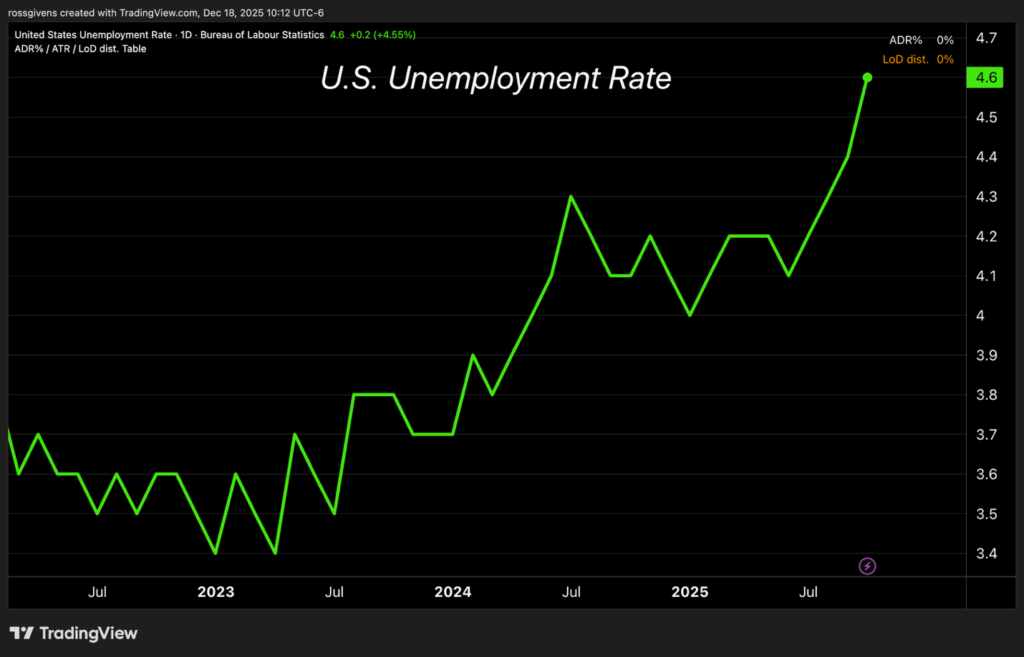
Another thing to keep in mind is that these numbers are not accurate. They will most likely be revised downward and most perhaps heavily.

Back in September, we learned that the 2024 jobs numbers were overstated by 911k.
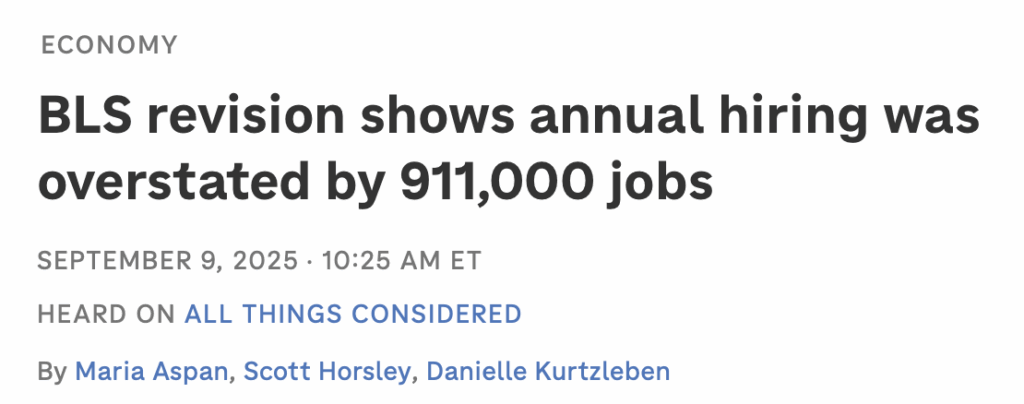
Nearly a million jobs that we thought were created vanished overnight.

Even Jerome Powell, the Chairman of the Federal Reserve, recently said that most likely these job figures are being drastically overstated.

Powell said that he suspects that the job numbers are overstated by as much as 60,000 jobs per month.

So the “official” data is bad. And the “real” data is probably even worse.

The weak labor market is why the Federal Reserve has been cutting interest rates – to stimulate the economy and create more jobs.

In my opinion, the only thing holding the Fed back from cutting by half or even three-quarter percent has been stubborn inflation.

Cutting rates into above-average inflation creates worse inflation.

And that has been the rock and a hard place the Fed has been stuck in all year.

On the one hand, inflation is high which means they should not cut rates.

On the other hand, the labor market is deteriorating. Unemployment is high and getting worse. They need to lower interest rates in order to stimulate the economy. As rates fall, consumers spend more, producers invest, and more jobs are created as a result.

So, this week’s data is giving them an out. The data is saying “it’s okay Jerome… you can cut… inflation isn’t that bad…”

Jerome Powell has said repeatedly that unemployment is the single most important data point for the labor market.

And that picture could not be any clearer.

Another metric the Fed looks at, when deciding on interest rates, is hourly wage growth.

And it’s not looking much better…
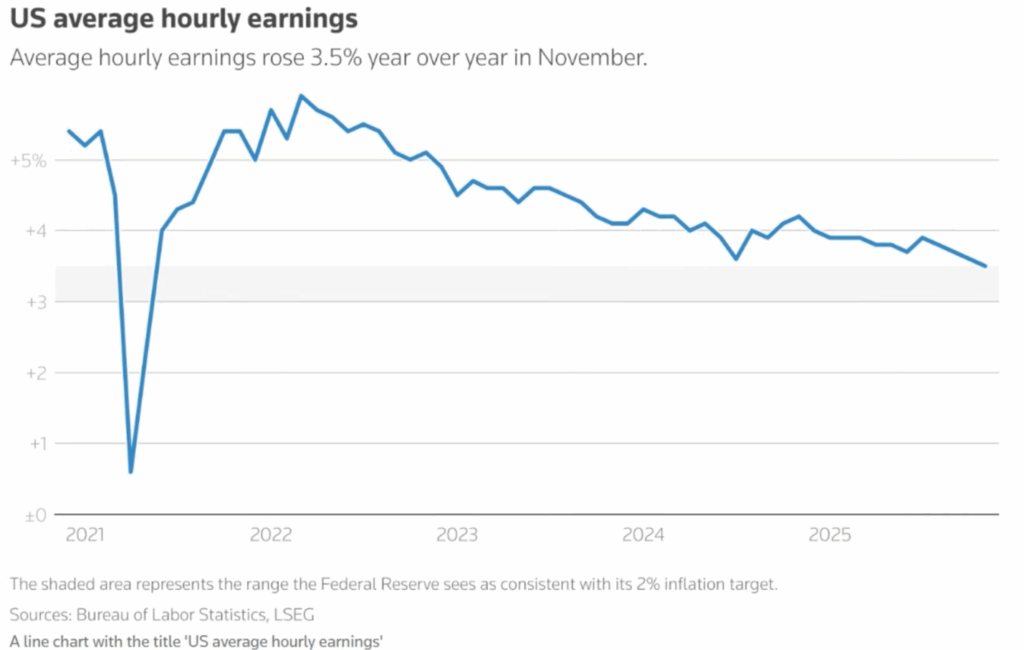
Hourly earnings rose 3.5% year over year.

You might think, “Well inflation is 2.7% but wages are up 3.5%, so the American worker is winning, right?”

Wrong.

The real inflation is closer to 6%.

You see, the CPI basket – the goods and services tracked to determine inflation – has not seen a major revision since the 90s.

It doesn’t reflect consumer reality.

For example, what was your cell phone bill in 1995? Zero. Today it’s probably a couple hundred bucks. Things like childcare and medical costs eat up a much larger portion of incomes today than they did 30 years ago.

Beef and steak prices, which are a staple in my house, are up more than 50%.
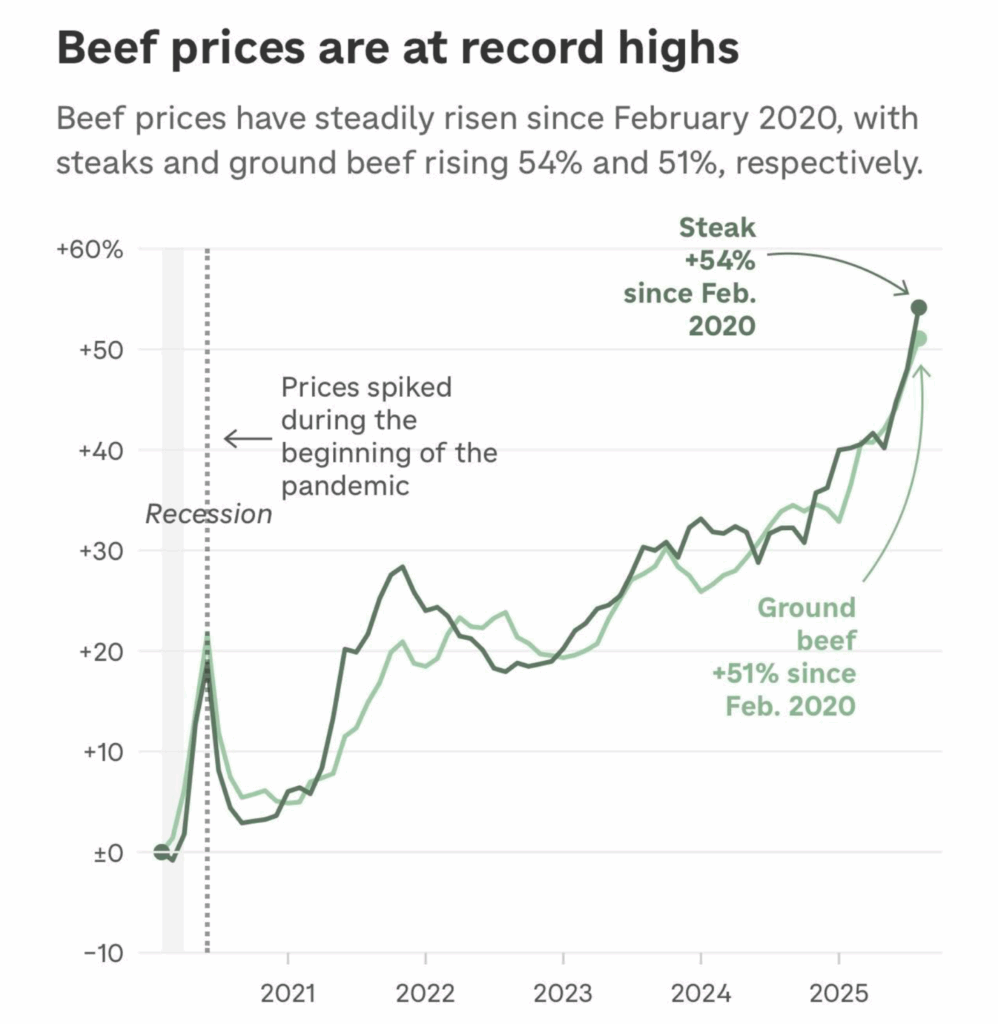
So, if real inflation is closer to 6%, that means wages are not keeping pace with inflation. So not only are more people losing their jobs, but the ones that have them are seeing pay cuts in terms of actual purchasing power.

This week’s data is going to unshackle the Federal Reserve. Not only are we likely to see another 25bps rate cut in January, there is a chance we could see an even bigger 50bps cut as an emergency measure to rescue the labor market.

And while all of us benefit from lower interest rates in the short term, they are going to make inflation worse over the long term.

Especially with the Federal Reserve’s announcement that they would be turning the money printers on again.

Powell didn’t mention it. The Fed tried to downplay it. But here it is, at the bottom of the official press release.
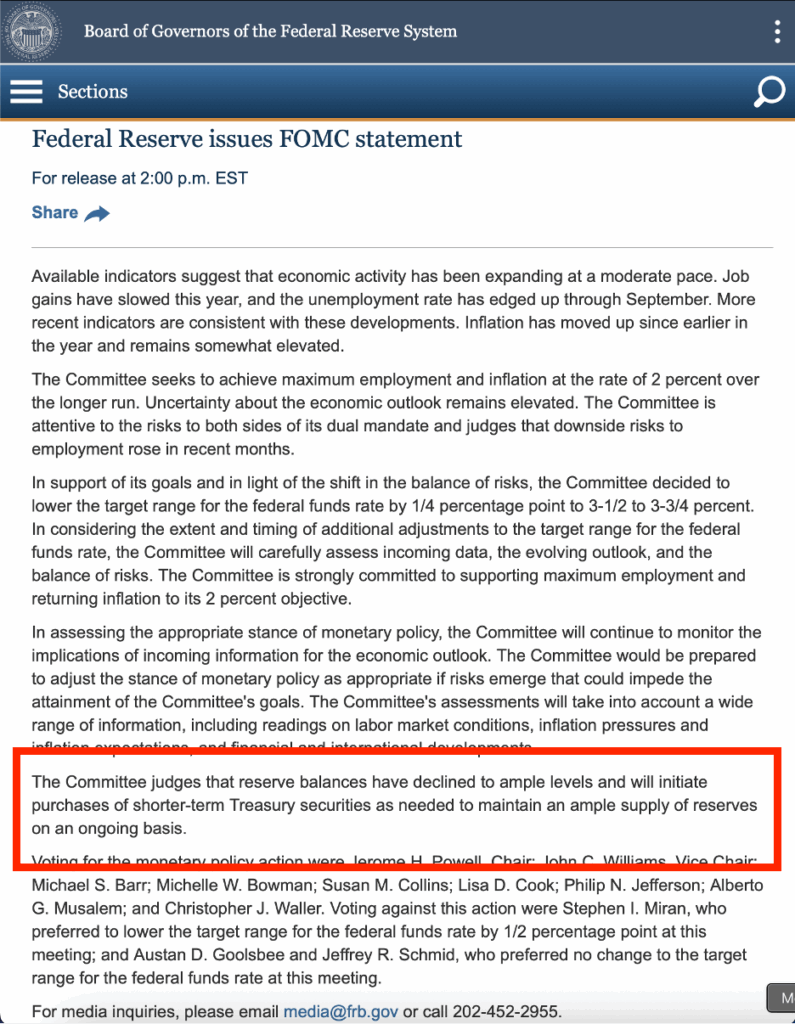
The Fed is ending its policy of quantitative tightening. They are done shrinking the balance sheet.

And will now “initiate purchases of shorter-term Treasury securities as needed to maintain an ample supply of reserves.”

So, they’re going to start buying bonds. Powell says $40-$60 billion worth a month. Where do they get the money to buy those bonds?

They print it. It is created out of thin air. Billions of dollars of new money flooding the system.

And this produces, as it always has, only one possible outcome…

More inflation.

More dollars chasing the same number of goods and services makes prices go up. That’s it. It’s not any more complicated than that.

And that’s exactly what the Fed has done for the last hundred years.
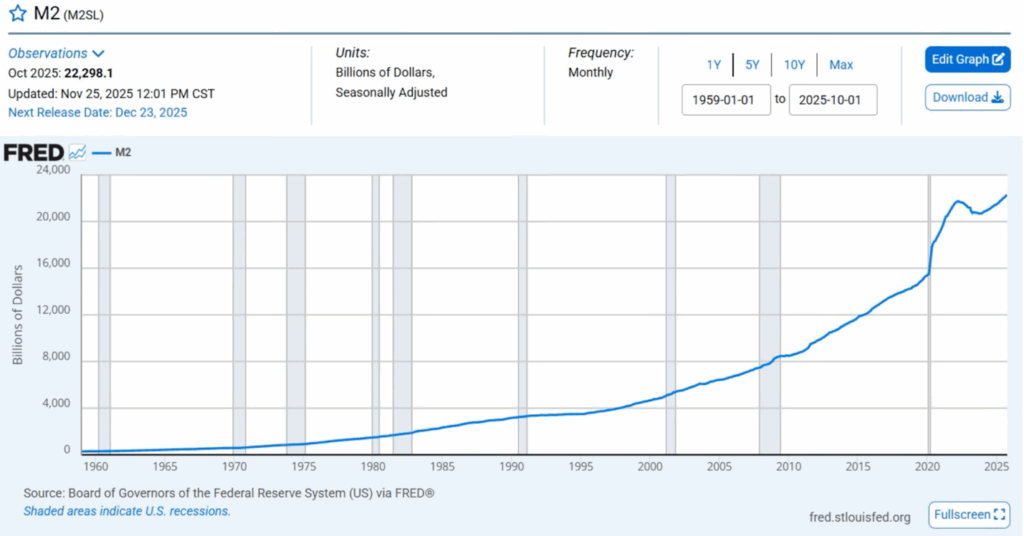
This is the M2 money supply – how much money is in the US economic system. $23 trillion and climbing.

Here’s a closer look at the last ten years…
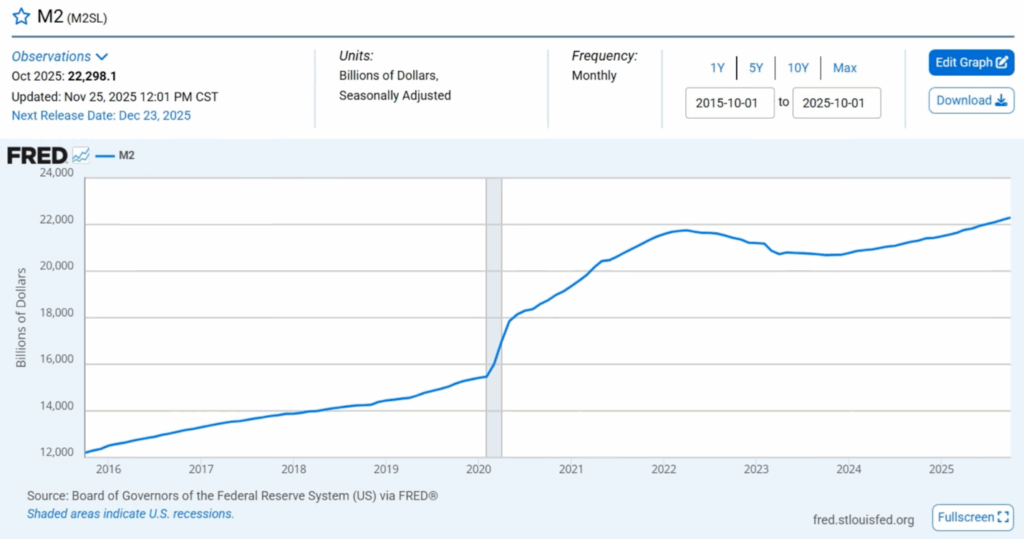
You can see the huge jump in 2020 when the government printed trillions of dollars for stimulus and bailouts. They kept spending into early 2022 until the Fed pivoted and began shrinking its balance sheet.

Remember the 2022 bear market? This, coupled with big rate hikes to fight inflation, are what caused it.

Anyway, the money supply has been growing at an annualized rate of approximately 5%.

And that’s with healthy +3% GDP growth… in a period of rising interest rates with the Fed shrinking its balance sheet.

Now the money printers are turned back on.

Interest rates are being cut. So, there’s going to be even more money loaned into existence.

We also have a federal government with $2 trillion dollars a year in deficit spending. That’s 2 trillion dollars more than it brought in that has to be printed just to make ends meet.

Interest payments on our debt now exceed the defense budget.

Think about that for a second…

The US government pays more in interest… on money they already spent… than it spends on the military.

And heads up… it’s not going to get better. The spending, the deficit, our national debt… it’s only going to get worse.

So, what does all this mean going forward? Here’s my outlook…

Money printing, which the Fed is again doing, raises stock prices.

The same inflationary forces that drive up housing and food prices also push stock prices higher.

Lower interest rates are also good for stocks.

It lowers margin rates, brings in new money from money markets and fixed income, and allows stock valuations to rise and remain competitive with dwindling bond yields.

And with this month’s inflation report coming in lower than expected and a labor market on life support, the Fed will have no choice but to cut again in January – another quarter or even half percentage point.

 If you’ve been waiting to buy a house or refinance your 7% mortgage, 2026 will likely be your best opportunity.
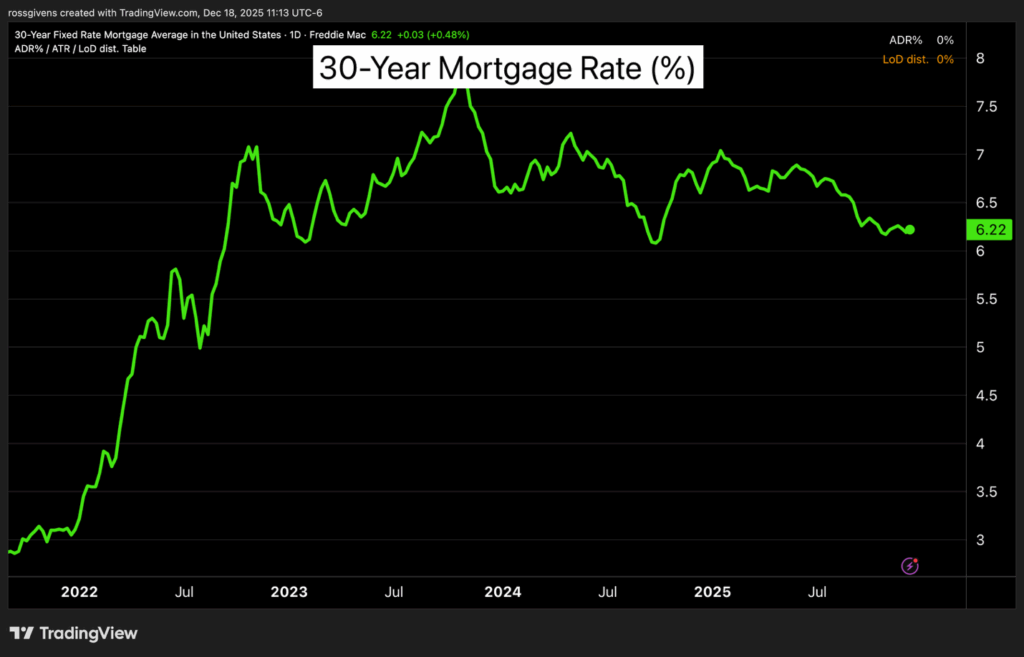
Mortgage rates will likely fall into the high 5s in the first quarter and possibly to as low as 4.5% by the end of the year…

It just depends on how aggressive Trump’s new Fed Chair pick decides to be.

My guess is that he comes out swinging.

But when the inevitable inflation shows up, they’ll have no choice but to raise interest rates again. So don’t expect another 2021 scenario with 2.7% mortgages.

The writing on the wall is clear. This is one of the best times to own assets and a hugely bullish backdrop for the stock market.

Best wishes for your trading,

Weekly Update: 3 Stocks Driving the Next AI Wave

Good evening, and welcome to this week’s edition of Stealth Trades!

Artificial intelligence remains the major theme of the stock market. But money is rotating out of the obvious plays (chipmakers like Nvidia) into new companies that will allow AI to scale.

Earlier this year we saw huge moves in nuclear stocks as Wall Street bet big on a clean energy solution to address the power shortage for data centers.

We also saw big momentum in quantum computing stocks – an offshoot of the AI play.

But today I am seeing a new theme develop in the AI space – optical core cables. These specialized data cables will allow data centers to move data at much higher speeds – well in excess of the limits of today’s copper versions.

I won’t get too technical, but here’s the basics of it…

Data centers (the ones that power all the artificial intelligence models) are essentially giant warehouses of computer servers. Those servers are mounted in 6-foot tall racks that look like this:

Data is transferred between the servers, compute notes and top-of-rack switch via advanced copper data cables.

But copper has a limit to how much data it can transfer at high speed.

Today, most AI server racks are operating at a speed of 112Gbps. They move 112 gigabytes of data every second. But they can only do so for a distance of 2 meters. Past that, the cables suffer signal loss.

The next generation AI infrastructure will operate at 224 Gbps. At that speed, cable can move data less than 1 meter before running into problems.

By 2028, servers are expected to push data at a lightning fast 1.6 terabytes per second – 14 times today’s rate which is already pushing the physical limits of modern data cables.

A lot of this is beyond my technical comprehension, but the consensus bet is on a transition to linear drive optics. And there are three companies leading this move.

I am not recommending these as an official buy, but I would encourage traders to keep them on your watchlist. I’m watching for clean setups in these names and would welcome any opportunity to get in.

MACOM Technology Solutions (MTSI)

MACOM’s high-performance analog chips could become the most critical components in the chain. They possess a rare, high-barrier analog pedigree that digital-first competitors lack. Their 30% revenue growth is primarily driven by data center demand, and they are uniquely positioned to profit as the industry shifts to custom optical engines.

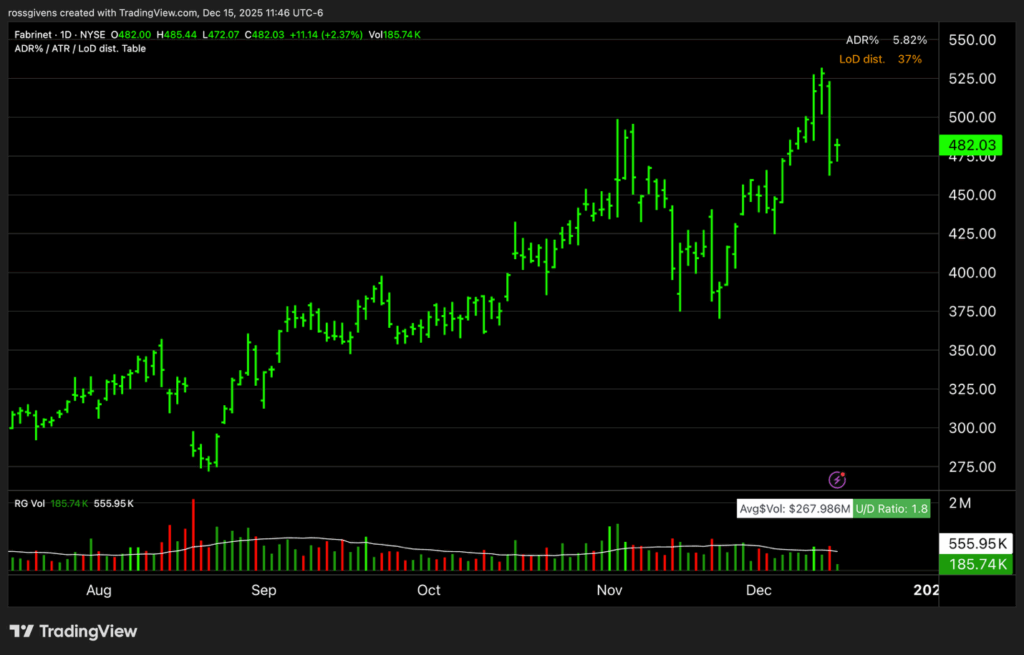
Fabrinet (FN)

Fabrinet feels like a less risky play here since, instead of betting on new technology, it just executes the manufacturing for the winners. As the primary manufacturer for Nvidia’s complex optical interconnects and a key partner for Lumentum and Coherent, they are an inevitable beneficiary of volume growth. 

Coherent Corp (COHR)

This company manufactures something called indium phosphide lasers and modulators, which would allow speeds up to 1.6Tbps.

You’ll notice that all three of these charts look similar – strong trends heading to the upper right. This correlation is further evidence that Wall Street is making a bet in this specialized sub-sector.

Best wishes for your trading,

Weekly Update: 8 Reasons Stocks Will Keep Rising

Good evening, and welcome to this week’s edition of Stealth Trades!

The stock market is already up big from the April lows. But in all likelihood, this is just the beginning.

Here are 5 reasons I believe stocks will continue to advance in 2026:

#1 – The biggest technological advancement of our lifetime

Artificial intelligence is rapidly increasing efficiency and driving down costs. We haven’t seen a boom like this since the internet in the 1990s. And the Nasdaq index surged 271% in the final 16 months of that bull market.

#2 – Ongoing Fed rate cuts into a stock market at all-time highs

This has happened 23 times in the last fifty years. In every case, stocks were higher a year later. Check out the data below.

#3 – Trump’s appointment of a new Federal Reserve Chairman

Powell’s term ends in May. Don’t let the door hit you on the way out, JPow. President Trump has picked his replacement and will announce it by next month.

The consensus is that he will tap Kevin Hassett – a Trump ally who believes in aggressively cutting interest rates and lower corporate taxes. Both actions lead to higher stock prices.

#4 – $700 billion in annual CapEx from tech companies

Thanks to the AI arms race, big tech is spending 700 billion a year on chips, data centers and other infrastructure. All of that money is leaving their company treasuries and entering the economy.

#5 – The end of Quantitative Tightening

As of December 1st, the Federal Reserve ended its QT program. They have been reducing their balance sheet for over a year which added selling pressure to the market. That has now come to an end.

#6 – The most market-conscious US President ever

Love him or hate him, Trump views the stock market as his presidential scoreboard. He wants to see GDP growth, foreign investments, and record profits reflected in the market indexes. He’s even said he will fight to keep markets at all-time highs.

#7 – $2 trillion in annual deficit spending

I hate deficits. The fact that our government takes a third of our income and still can’t make ends meet is disgusting. No sitting member of Congress who votes to spend more than we take in should be allowed to run for re-election.

But nobody asks me. So, this is the game board we must play on. And the facts are simple…

The deficit will continue to widen. The debt will keep going up. And Washington will print money to fill the gap like it always has. Inflation will get worse, and it will push stock prices up with it.

#8 – 13% year-over-year earnings growth in the S&P 500

Historically, earnings grow at about 9% a year. That is the long-term average for the S&P 500 since 1957. This year they grew at 13%. That’s almost 50% above the norm. And earnings drive stock prices.

I don’t see how anyone could be bearish and think the market will crash under these conditions.

Are valuations stretched? Sure.

Will some of today’s high-flying AI stocks come crashing one day? Absolutely.

But markets operate on liquidity. If there is more money going in than out, prices rise. And this is exactly the scenario we are in today.

The bull market continues.

Best wishes for your trading,

Weekly Update: Rare Strength in an Ugly Market

Good evening, and welcome to this week’s edition of Stealth Trades!

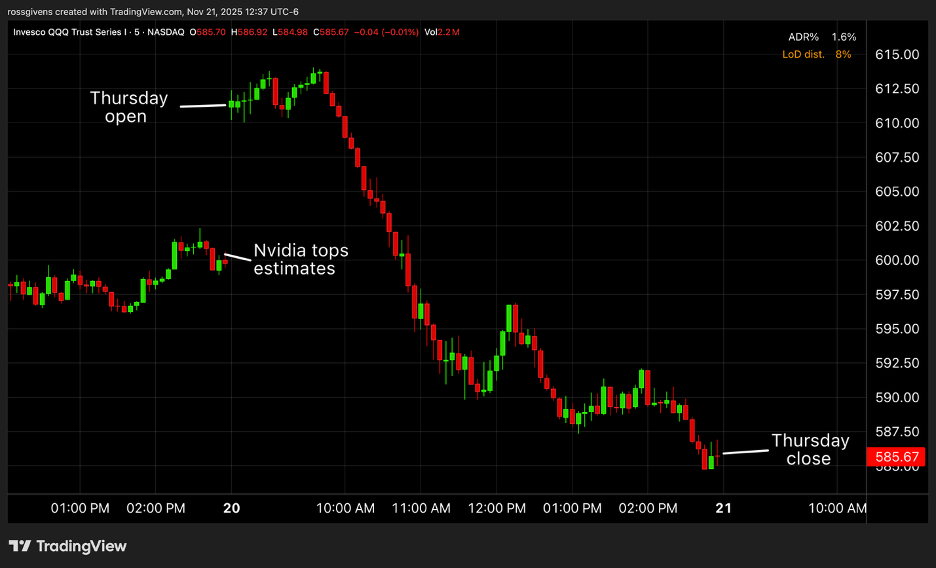
In one of the most volatile trading sessions of the year, stocks went from “way up” to “way down” in just a couple hours Thursday.

Nvidia reported a big earnings beat the Wednesday after the close. It, along with just about every other tech stock, opened higher the next morning.

But an hour into the trading day the selling started. And it didn’t stop until the closing bell rang.

It was a bloodbath from start to finish.

Days like this are exceptionally rare…

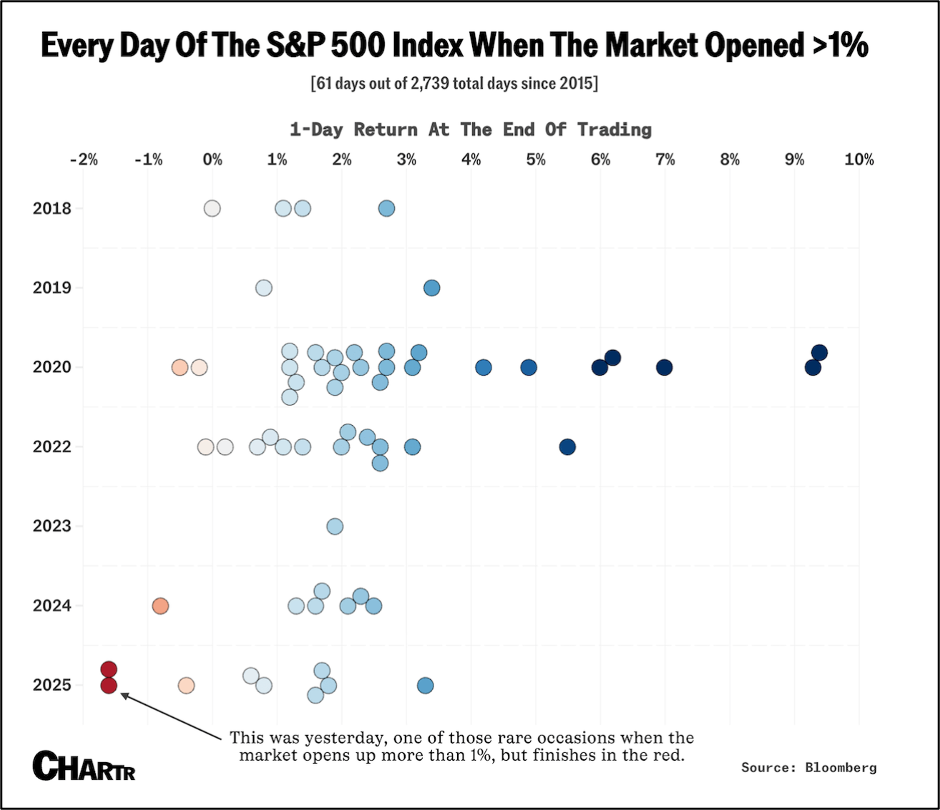
When the market opens up by more than 1%, it almost never finishes the day in the red. It has only done so 7 times since 2015.

And the worst two occasions both came this year.

The first was April 8th when stocks melted down on tariff-related news. The other was yesterday.

Even more surprising is that this came on no apparent news…

Unemployment ticked up every so slightly (4.4% vs 4.3% est).

The Labor Department announced they would halt the October jobs report. This wasn’t great news since it lowers the odds of a December rate cut, but nothing catastrophic.

The biggest piece of news on the day was actually positive– Nvidia’s crushing 3rd quarter sales and revenue numbers. So why the big selloff?

I’ll be honest… I don’t know.

There is no obvious reason. In all likelihood, this was systematic liquidation by a large hedge fund. Maybe somebody got spooked and decided he wanted the firm’s portfolio in cash. Immediately.

Perhaps Norway or the Saudis reduced exposure in their trillion-dollar sovereign wealth funds.

Anything is possible.

But this is one of those events we just cannot predict. At the end of the day, the stock market is an auction. It is buyers and sellers trying to agree on price.

At any time, sellers can overwhelm buyers. Supply can outstrip demand. No matter the reason and whether they’re right or wrong, when a big player wants out, there is going to be collateral damage.

I’m reminded of a scene in the 2011 movie “Margin Call” where the CEO of a major investment bank decides to liquidate their entire portfolio. If you haven’t seen it, it’s worth a watch.

Here is the clip

This is a dramatic example, but the same thing could have transpired at a hedge fund or major endowment fund Wednesday evening.

The indexes recouped some of Thursday’s losses today. I am writing this 2 hours before the close with the S&P 500 up 1.44% on the day.

There is a silver lining to events like this, however. It stress tests the market… shows you where the weakness is… and also the strength.

A clear standout on Thursday was the biotech sector. Below is a daily chart of XBI – the biotech ETF.

Do you see the selloff? I don’t.

The biotech sector looks like business as usual. Its uptrend is completely unphased. So, at least for right now, this is an area I will be looking to find new setups.

One of our analysts, Tyler, has been focused on this space for a few months. And he sent over a couple of his favorites.

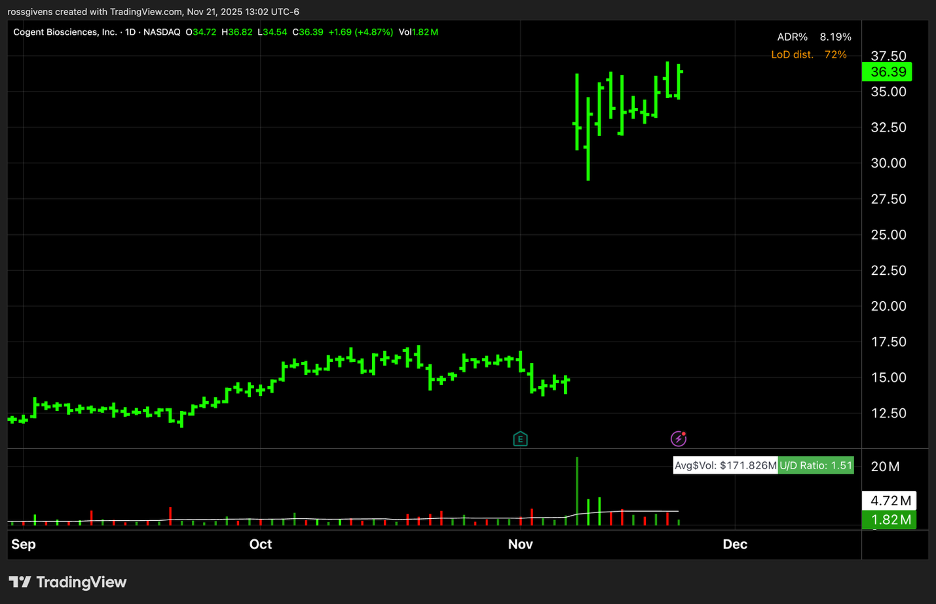
One is Cogent Biosciences (COGT).

Peak Phase 3 drug trials for its new drug, Bezuclastinib, showed tremendous success. I won’t pretend to understand the science, but the chart looks beautiful.

Following a 119% overnight gain, shares have held their ground. In fact, they are drifting higher. This is likely the start of a much longer run higher.

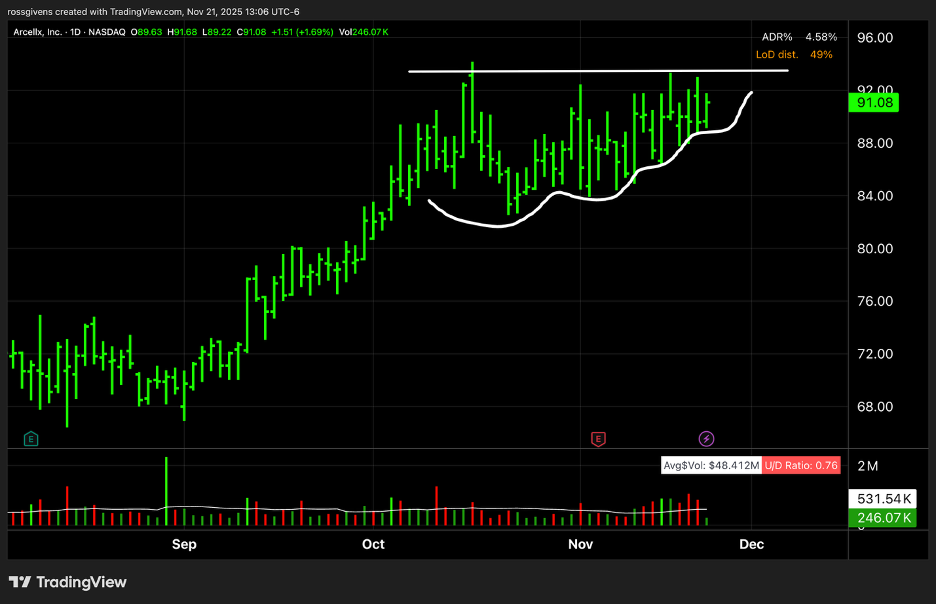
Arcellx (ACLX) also looks great.

This mid-cap biotechnology company has nearly doubled off its April lows.

It is now setting up what looks like a potential breakout move higher.

Look, Thursday was tough. I get it. I took a lick just like everybody else. But this is, unfortunately, just part of the game.

We pick ourselves up, wipe off the blood, and climb back in the ring. Weeks like this are what mold seasoned traders.

Best wishes for your trading,

Weekly Update: My 2026 Retirement Portfolio

Good evening, and welcome to this week’s edition of Stealth Trades!

Here’s how I am allocating my retirement account for 2026:

  • 40% Equities
  • 25% Energy
  • 25% Metals
  • 10% Real Assets & Infrastructure

Today I am going to lay out my full allocation with ticker symbols, exact percentages, and the rationale behind each.

I am not instructing you to do the same. This is where I, at 42 years old, am putting my money. And it is based on a number of assumptions you may or may not agree with.

Only you can decide that.

Now, to be clear, this is the play for ONLY my retirement account. Most of us have multiple investment accounts.

I, for example, have 529 accounts for each of my children’s college savings. They hold a simple market index fund and get automated deposits every month. I don’t touch them.

I also have a few trading accounts where I am more active. I go from long and on margin to completely in cash sometimes overnight.

But I am far less active with my wife and my retirement accounts. These are dollars I don’t want to take big risks with. And they are invested with a much longer time horizon.

My approach – and I’m not saying this is right or wrong – is to be tactically diversified. I want broad exposure but focused in the areas likely to outperform over the next few years.

What will the world look like 20 years from now? I have no idea.

But 2 years from now? That’s a little easier to predict.

I only hold ETFs – exchange traded funds. These are the modern-day equivalent of mutual funds. They hold a basket of stocks in a given sector, index or region.

My goal is to avoid single-stock risk and stay focused on leading themes.

For the last few years, that has been AInce.

The artificial intelligence ETF, ticker AIQ, has nearly doubled over the last 2 years.

Would you have done even better putting it all in Nvidia? Sure. But you also could have suffered unrecoverable losses. Again, no single-stock risk.

But looking at things today, at the tail end of 2025, are AI stocks likely to keep going higher?

It’s hard to say. Valuations have reached extremely elevated levels. Some are calling it a bubble.

In my opinion, the AI trade is a bit long in the tooth. Buying here feels like the equivalent of showing up to a baseball game in the 8th inning.

Instead, I am focusing on what I believe will be the big winners in 2026 and 2027 – energy, metals and physical assets.

I could go on for hours about the flaws of government physical policy, but the short and sweet of it is this – Uncle Sam will never stop spending.

The government will never live within its means, the debt will continue to spiral out of control, and the money printer will keep being used to fill the gap between what comes in and what goes out.

That gap is widening. And we have some of the best economic conditions in decades.

When things turn south? They’ll print trillions more.

Inflation is going to get worse. It is an unavoidable reality. And I expect this to be a tailwind for asset prices for many years to come.

Housing will become less affordable, not more. Gold and silver will double again. And by 2030, expect your power bill to be twice what it is today.

And since Washington has no intentions of steering their bloated ship toward anything resembling responsible stewardship, we must take action to protect our wealth.

My allocation, which I noted earlier, is as follows:

  • 40% Equities
  • 25% Energy
  • 25% Metals
  • 10% Real Assets & Infrastructure

At first glance, this might look overly conservative. But as you will see, the bulk of the dollars into energy are going to energy stocks. The same is true of the metals and infrastructure allocations.

So, in reality, the percentage going to equities is much higher. The 40% only refers to index fund investments.

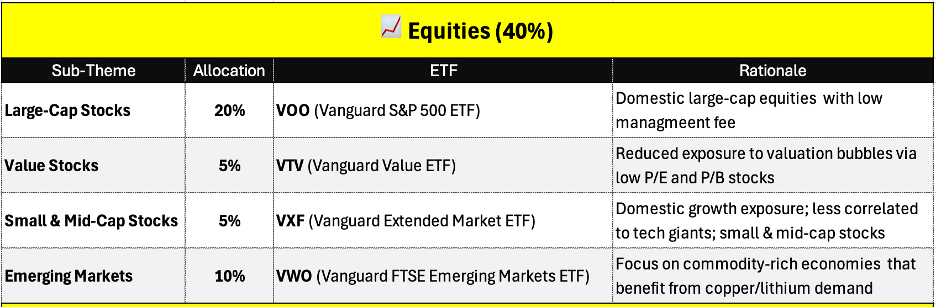
That equities bucket looks like this:

I used Vanguard ETFs which are not only liquid but offer the lowest management fees in the industry.

I have also tilted the funds away from mega-cap AI stocks by putting half to value stocks, small and mid-caps, and emerging markets.

40% of the S&P 500 is dominated by just 10 companies. Nvidia alone is nearly 8%. That stock is up 12-fold. I do not want a bunch of money in an index that can be tanked by a single company.

My rationale for each ETF is detailed above.

Next is energy…

I am putting 25% toward energy stocks – split between renewables like solar and nuclear and traditional oil and gas.

This, to me, is one of the biggest investment opportunities of my lifetime. Data centers are creating huge demands for energy. Municipalities located near them are seeing energy prices surge.

There is a nationwide race to generate enough juice to power these AI data machines.

Another 25% is being allocated to metals which is further split between precious metals that I expect to rise as the dollar weakens and industrial metals used in infrastructure projects.

This email is getting long, so I will let my rational notes above do the talking here.

And finally, a 10% weight to real assets and infrastructure. This is achieved with three ETFs that are pretty self-explanatory.

This is my plan. Will it outperform the market? I hope so. It definitely feels safer than betting it all on a continuation of the AI bubble.

But there are no guarantees.

This portfolio meets my objectives. It aligns with my macroeconomic views. And it will let me sleep soundly at night.

Do with this what you will.

Best wishes for your trading,

Weekly Update: Nuclear Is Out. Solar Is In.

Good evening, and welcome to this week’s edition of Stealth Trades!

After a record rally off the April lows, the AI trade is getting a bit long in the tooth.

The big leaders of 2025 are showing weakness and beginning to roll over. Nvidia – the undisputed king of the AI revolution – fell as much as 14% this week. And 14% of 5 trillion dollars is no small thing.

Palantir, which I discussed in depth in a YouTube video this week, fell after reporting better-than-expected earnings and sales and raising forward guidance. 

Generally speaking, this is not a good sign. When stocks drop following positive news, it is often a sign they have become overpriced. Investors are unimpressed with anything but massive beats.

Essentially, Wall Street has priced in perfection, and anything else is being viewed as a disappointment.

The market indexes, thanks to the enormous valuations of the tech giants, are disproportionately weighted to a small number of mega-cap stocks. Nvidia, for example, represents nearly 14% of the entire Nasdaq.

So, as Nvidia goes, so goes the market. And given the interconnectedness of the big AI players, weakness in one tends to rub off on the others, creating a domino effect that brings markets down.

Is this the end of the bull market? 

It’s possible. But I doubt it. To me it feels more like a near-term pullback. And after the run we have seen in the last two quarters, the market needs it.

It is not healthy to go straight up forever. That is what leads to nasty crashes like what happened in 2000 when the dot-com bubble burst.

Plus, if the market were cashing, everything would be going down. And at least so far, that is not the case.

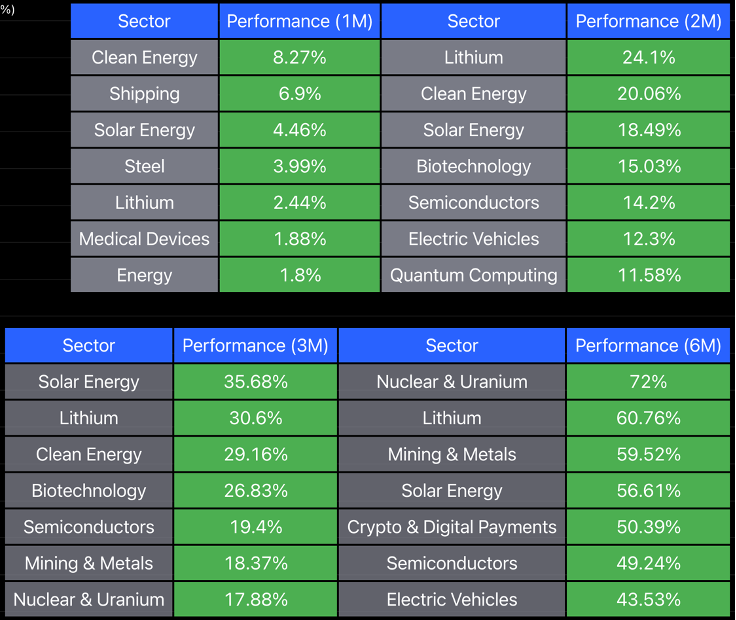
I have discussed the strength we are seeing in the solar area for the last month or two. A quick look at the industry strength tables shows that it has spread to the whole clean energy sector.

The macro argument is a simple one – we have an energy crisis. There is not enough juice to power our daily lives. And artificial intelligence with its massive power-hungry data centers is accelerating the issue.

This is why nuclear stocks performed so well in 2025. But those stocks, like the big AI darlings, are seeing their stock prices come back down to earth. 

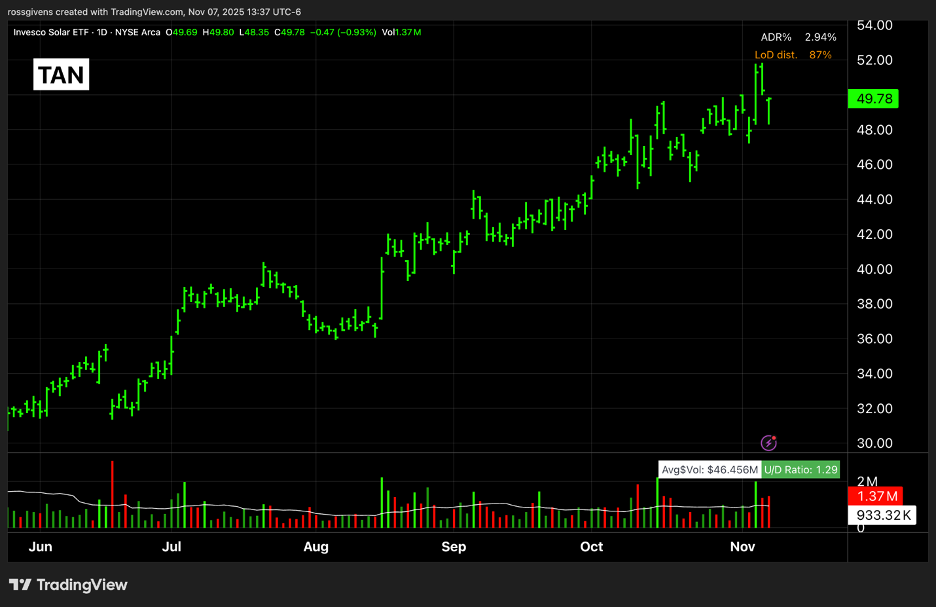
Solar stocks, on the other hand – represented by the Invesco Solar ETF – are steadily marching higher.

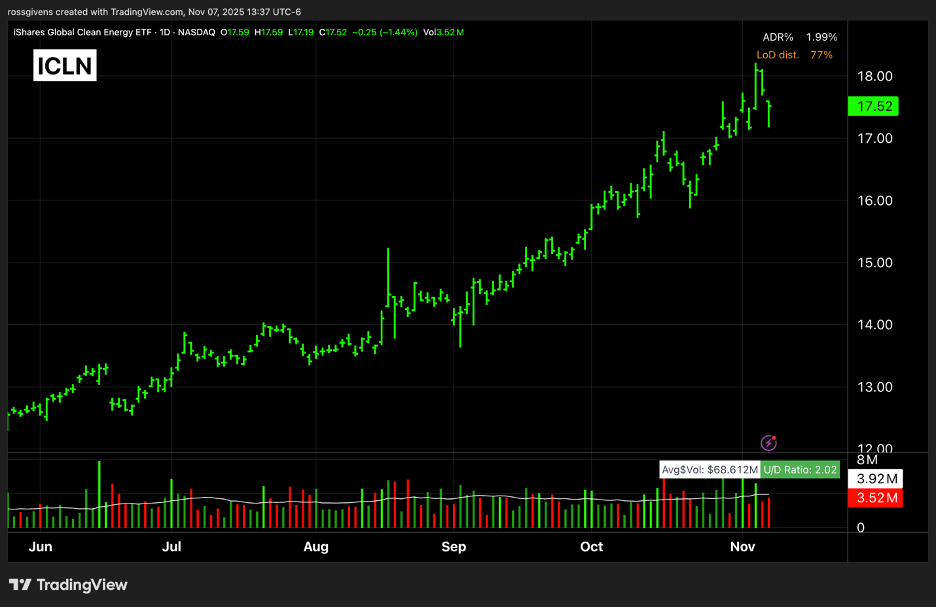
The iShares Global Clean Energy ETF (ICLN) represents the whole sector – solar, wind, renewable utilities.  It is also trending nicely.

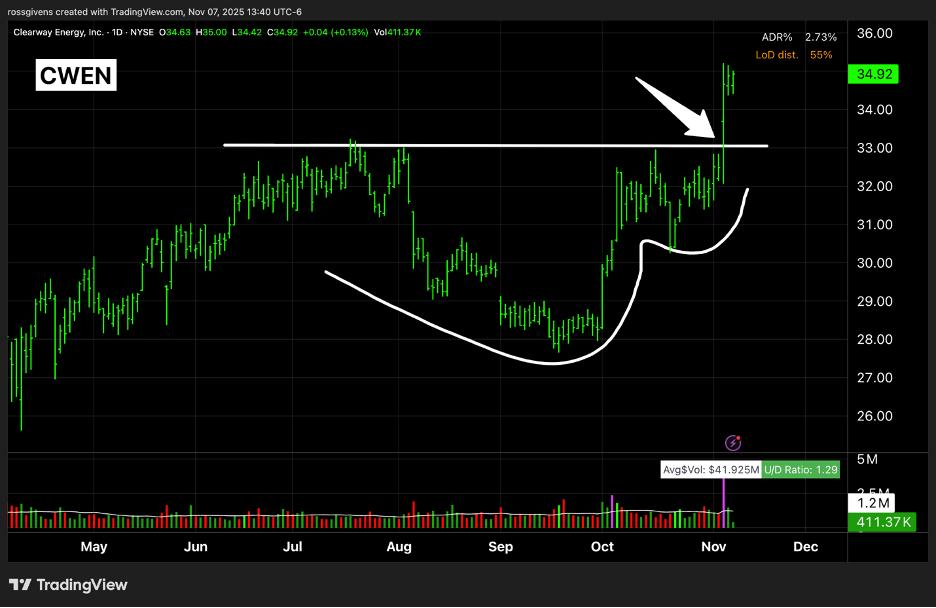
Those looking for individual stocks in this sector might want to keep an eye on stocks like Clearway Energy (CWEN).

It broke out from a textbook cup and handle pattern this week on big volume. And despite weakness in the general market indexes, CWEN has held strong near $35 and looks like it wants to go higher.

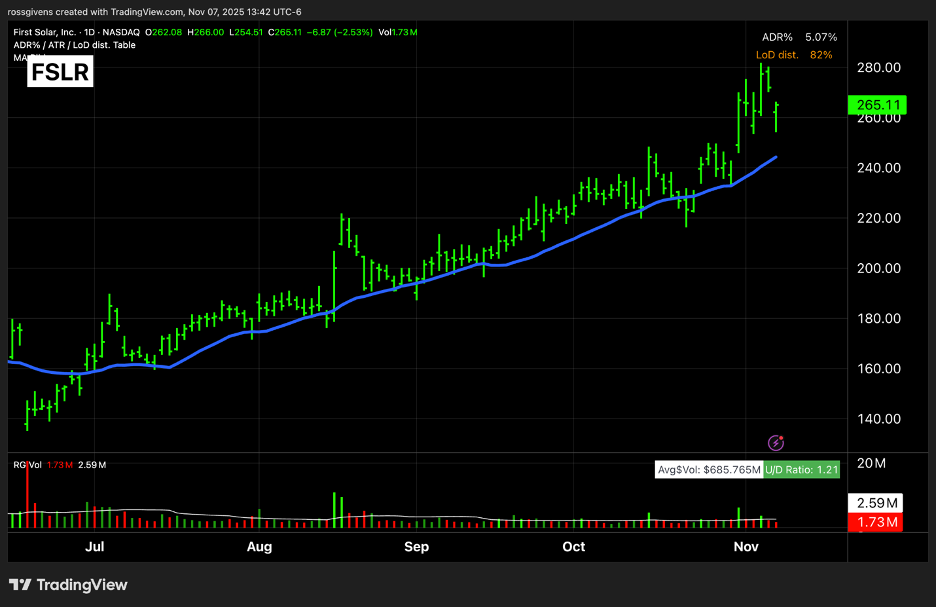
First Solar (FSLR) is another stock showing tremendous strength.

It has been riding its 20-day moving average like a jockey at Steeplechase.

The stock hit $317 back in 2008, so it might be time to finally make a new one.

Overall market conditions remain weaker than what we have seen over the last two quarters. I have reduced my equity exposure, especially in the highflyers like nuclear, quantum and AI. 

Ideally, we will see an 8-12% pullback in the indexes to knock the froth off and force the cowboys to de-leverage, then set up for another run higher.

I will keep an eye on where the money is flowing. But as of today, Wall Street is betting on higher prices in clean energy.

Best wishes for your trading,

Weekly Update: Trade the Pattern Within the Pattern

Good evening, and welcome to this week’s edition of Stealth Trades!

Good evening, and welcome to this week’s edition of Traders War Room!

Ever heard of fractals?

They are defined as “infinitely complex geometric patterns that are typically self-similar.” In other words, these are patterns that look similar at different scales.

And they can be hugely beneficial for traders. 

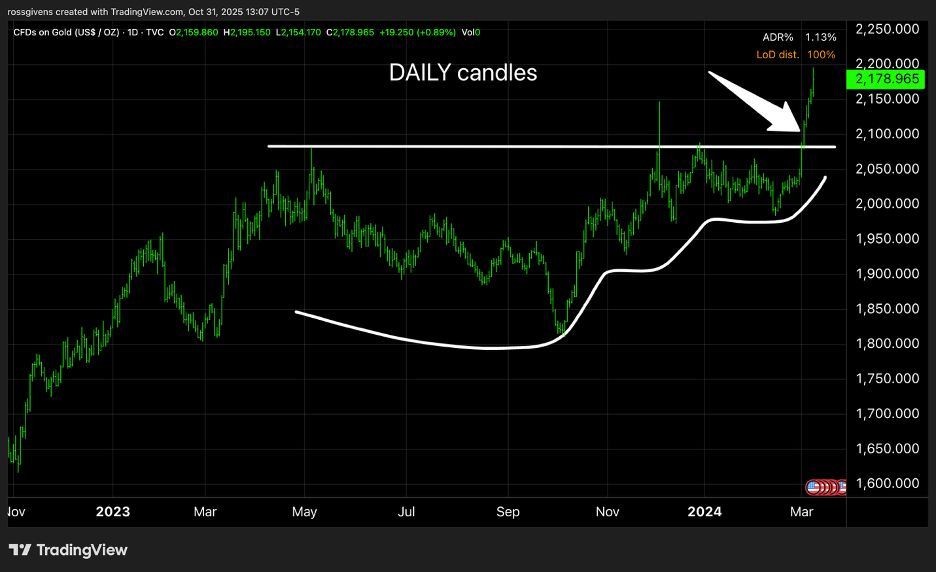
18 months ago, I wrote about the breakout I saw coming in gold. And the reason I was so bullish was this concept of fractals.

The breakout pattern I look for appeared on the daily chart… the weekly chart… and even the monthly chart.

Same pattern. Same ticker. But vastly different time frames. Take a look…

This alignment of multiple time frames in nearly identical patterns foreshadowed what has been the biggest gold rally in over a decade.

13-year base patterns forming on a monthly chart are rare. But we can do the same thing with weekly, daily, hourly and even 5-minute charts.

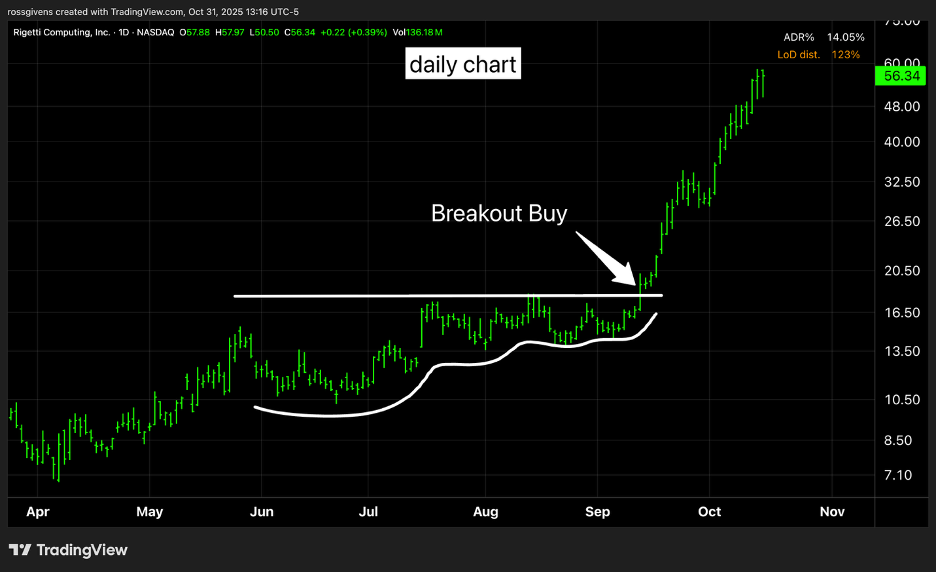
Take a look at Rigetti Computing (RGTI) – one of the big movers in the quantum computing space. Below is a daily chart highlighting the breakout that took place last month.

It delivered a 226% peak gain in just over a month.

But it was a volatile stock. Placing a stop loss at the swing low from the week before would have meant risking 20% on the trade.

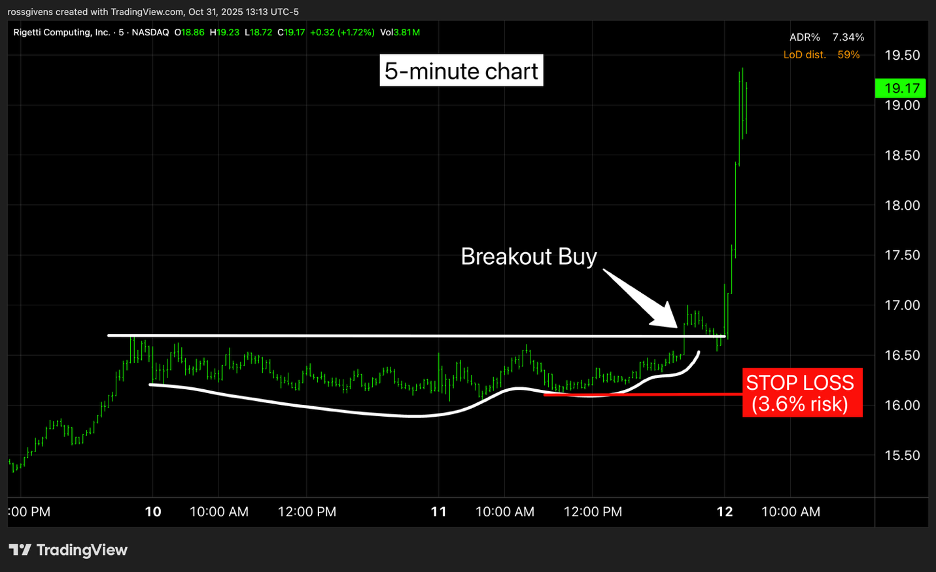
However, if we zoom into a 5-minute chart of RGTI at that time, look at what we see…

This is a fractal – a similar pattern but on a much shorter time frame.

And with this setup, you could have taken minimal risk of less than 4% on your entry. Maybe it works, maybe it doesn’t.

But so what…

It’s a 3.6% risk. You can take several stabs at it and still not get yourself in trouble. I sometimes refer to this as “day trading my entry.”

A day trader I am not. But I do love high-momentum stocks. And for a lot of them, 20-25% swings are normal.

I won’t risk 25%. But I’ll risk 4% all day long.

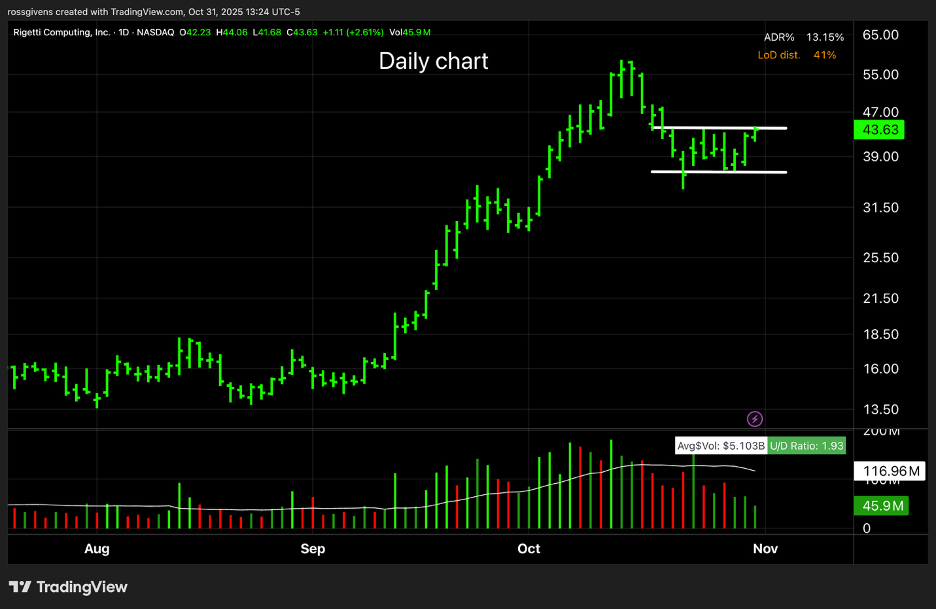
Now, let’s look at Rigetti today. Below is a current daily chart. What do you see?

Volume ramped up in that huge September rally. The stock then pulled back and is now consolidating in that $35-$45 range. It is also doing so on decreasing volume – a sign that the selling may be coming to an end.

Buying a breakout above that upper white line and placing a stop loss at the lower one is still a 17% risk.

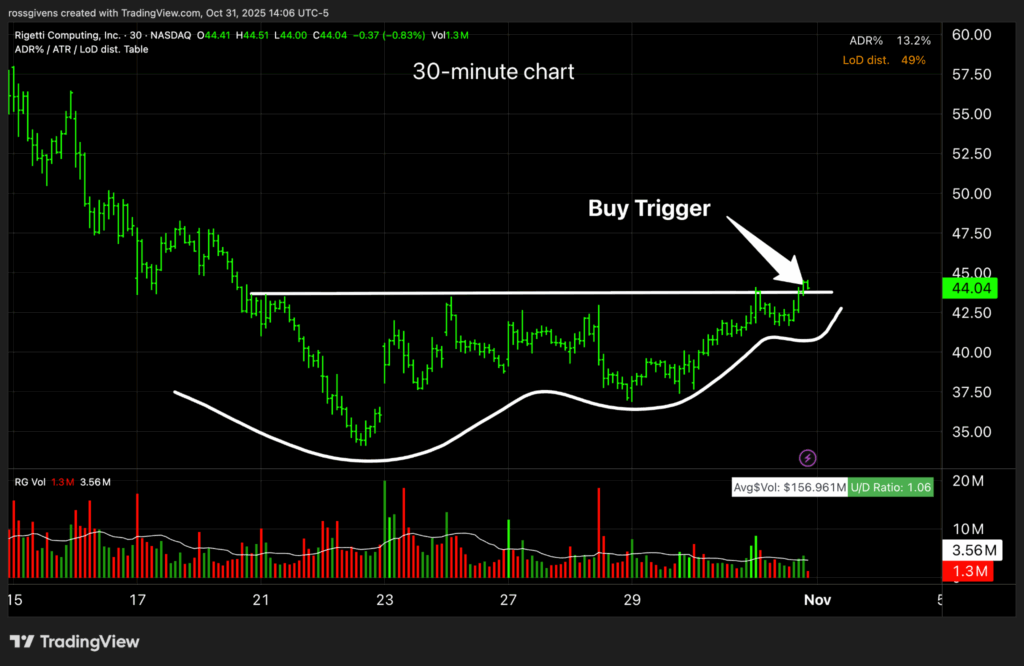
So, let’s zoom in closer on a 30-minute chart…

Do you see the pattern?

Remember, we want to see that same shallowing consolidation after a stock pulls back. The same supply and demand principles apply. The stock needs to absorb the supply (get all the sellers out of the way) before it can push higher.

Is this a picture perfect pattern? No. But it’s not bad.

And on a leading stock, in a leading group, in a record-setting bull market… you don’t need perfect.

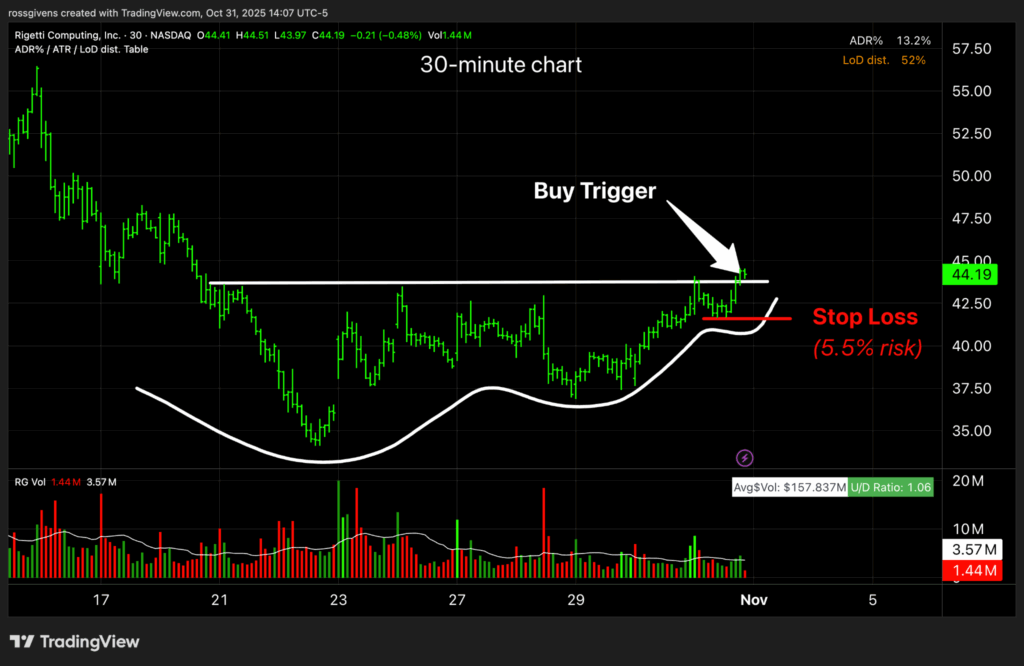
Plus, the risk is minimal…

With a stop loss just beneath the swing low here, we are only risking 5.5% on the entry.

This is a stock that just tripled in a month. I can easily justify a five and a half percent risk.

You may be comfortable with bigger stop losses and more risk. I’m a chicken. I like to keep it tight.

I’d rather take a few small losses trying to get into a leading stock than put all of my risk on a single entry.

That’s all for this week. As you read this, I am Trick or Treating with a 6-year-old Bowser (Mario Bros character) and a 3-year-old monkey. Bedtime should be interesting. Pray for me.

Best wishes for your trading,

Weekly Update: Ignore the Bears and Stay LONG

Good evening, and welcome to this week’s edition of Stealth Trades!

Last Friday, the market tanked after Trump announced 100% tariffs on China. Three days later, we were right back up.

I have been seeing a lot of bearishness lately in the financial press calling for a top in the market.

Stocks have one bad day, and everyone says the rally is over. Gold drops 2% and people think it’s time to sell.

This market rally has been one of the strongest moves ever. The Nasdaq is up 45% in six months. That just doesn’t happen.

So, I get it. I understand the fear that things have gone too far too fast.

But one of the oddities of the stock market is that when prices appear too high, they tend to go much higher. And when things seem cheap, they usually get even cheaper.

By most traditional metrics, stocks are overvalued. But that doesn’t mean we are at the highs.

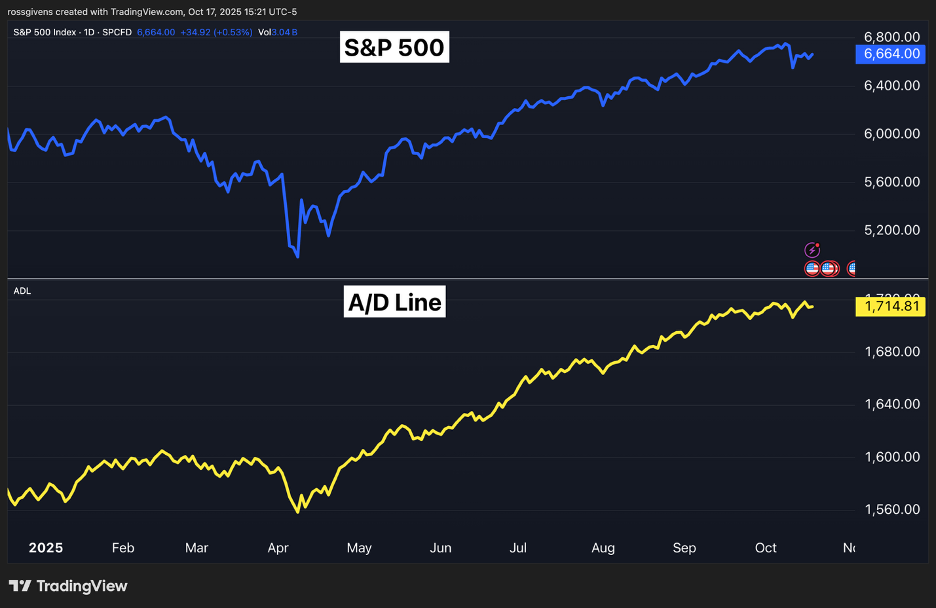
I track a handful of breadth metrics to track the strength of the market beneath the service. And, as long as things appear healthy, odds say we go higher.

The advance/decline line, which keeps a running tally of how many stocks went up or down each day, is holding near its highs.

If the indexes were being propped up by a small group of mega cap stocks, we would see weakness in the A/D line like we did at the end of 2021. But we are not.

The net new highs and lows indicator is also printing bullish.

We experienced a day with 65 net new lows last Friday but have quickly returned to new highs.

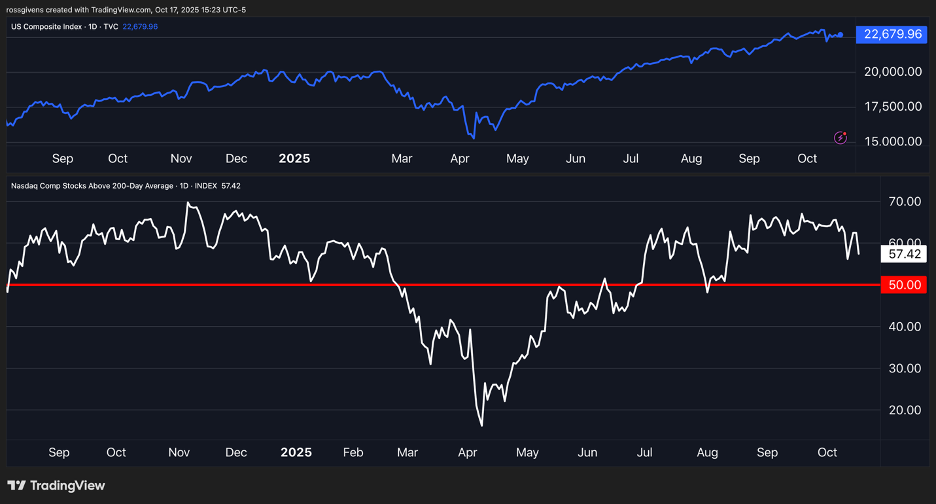
The percentage of Nasdaq stocks above their 50-day moving averages currently sits at 57.4%.

We have held in the 50-70% range for most of this rally, and I won’t worry unless we fall below 50%.

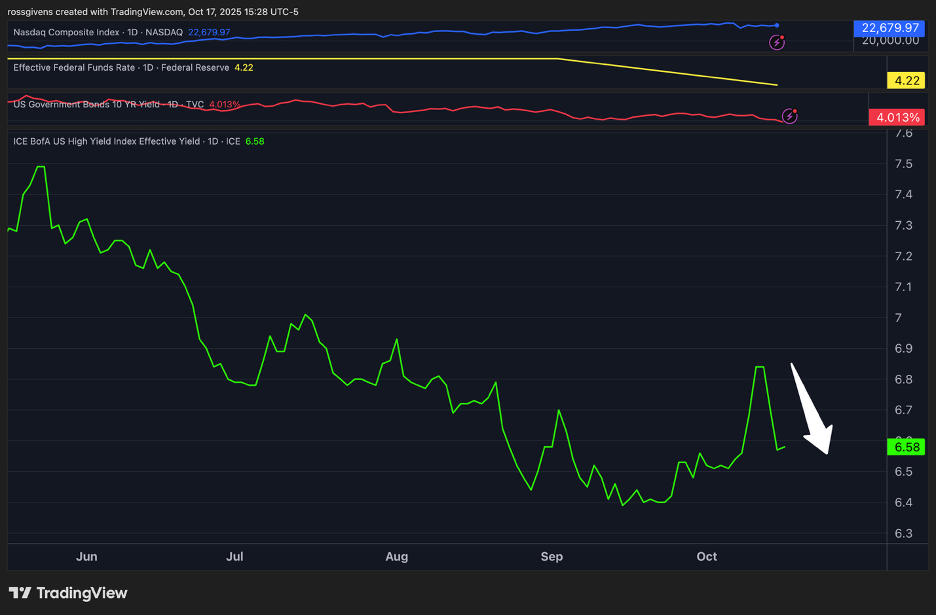
The high yield index is falling as well.

When economic conditions sour, banks tend to hike interest rates to their riskier borrowers. All things being equal, I like to see this rate steadily trending lower like it has been the last six months.

It kicked higher on Trump’s announcement last week but has now come back down to 6.58%.

There are no guarantees. Anything can happen. But right now, nothing says the bull market is over. It could take a break. We might see a shallow pullback or consolidation. But make no mistake… the bull market is still in full effect.

Best wishes for your trading,
Weekly Update: Weekly Update: Palladium – the “Sleeper” Metal

Good evening, and welcome to this week’s edition of Stealth Trades!

Gold is soaring. So is silver. Both just made new all-time highs.

But if history is any indication, palladium prices are setting up to do even better in the coming months.

Palladium often flies under the radar as a precious metal investment, but it is far rarer than gold or silver. Annual global production hovers at just 6-7 million ounces, compared to 120 million for gold and 800 for silver.

Adding to this shortage is the fact that most palladium production takes place in areas with geopolitical tensions. 80% of global supply comes from Russia and South Africa.

The largest producer is Norilsk Nickel – a state-owned Russian mining operation. The company has already slashed Russian exports by 30% thanks to Western sanctions following the post-2022 Ukraine invasion.

South African mines are facing labor unrest, power outages, and declining ore grades, further constraining and creating international bottlenecks.

The World Platinum Investment Council forecasts a palladium deficit of 500,000 ounces in 2025. Non-Russian supply growth is tepid, and I don’t see Putin going out of his way to ship more supply to the United States any time soon.

New projects in Canada and Australia might add 35,000 ounces by 2032, but that’s a drop in the bucket against rising needs. This structural tightness—exacerbated by concentrated production by US adversaries—creates a supply constraint that will lead to soaring prices.

Because demand for palladium is not going to decline. If anything, it is likely to increase.

Palladium has unparalleled utility across key industries – especially those driving the transition to cleaner technologies. Thanks to its efficiency under high temperatures, it is the key component in catalytic converters which reduce harmful exhaust emissions like carbon dioxide.

Palladium’s corrosion resistance and catalytic properties make it ideal for electronics, where it’s used for plating printed circuit boards, semiconductors, and connectors.

In dentistry, it forms durable alloys for crowns and bridges. Jewelers favor it as a hypoallergenic, platinum-like alternative for high-end white gold settings.

Palladium is now being used in emerging applications like fuel cells and hydrogen purification since palladium membranes can selectively filter hydrogen for fuel production.

Hydrogen powered technologies alone are projected to require 20% more palladium by 2030.

But for price projections, I prefer to let the charts do the talking. And, as you’re about to see, the picture it paints is one of higher prices.

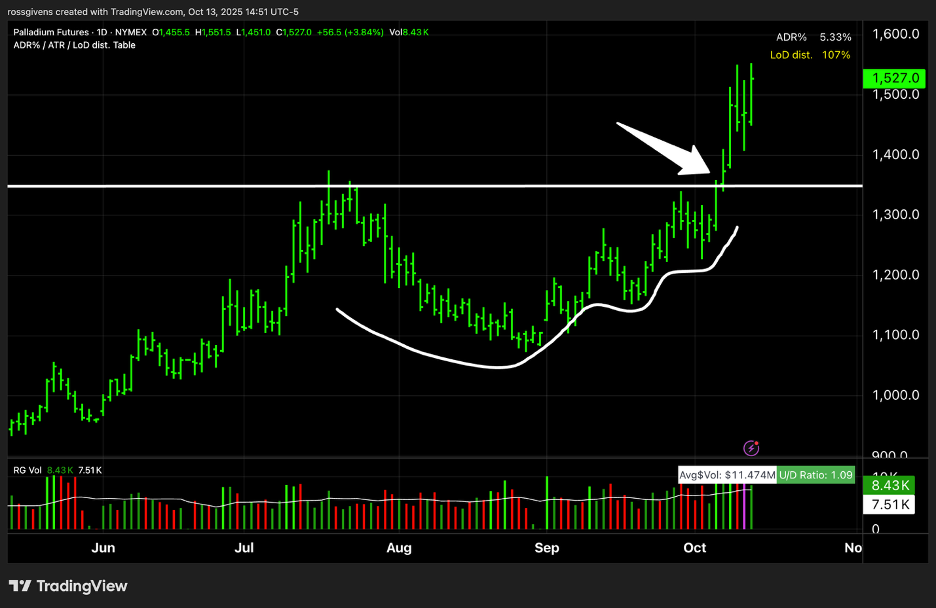
Below is a daily chart of palladium futures:

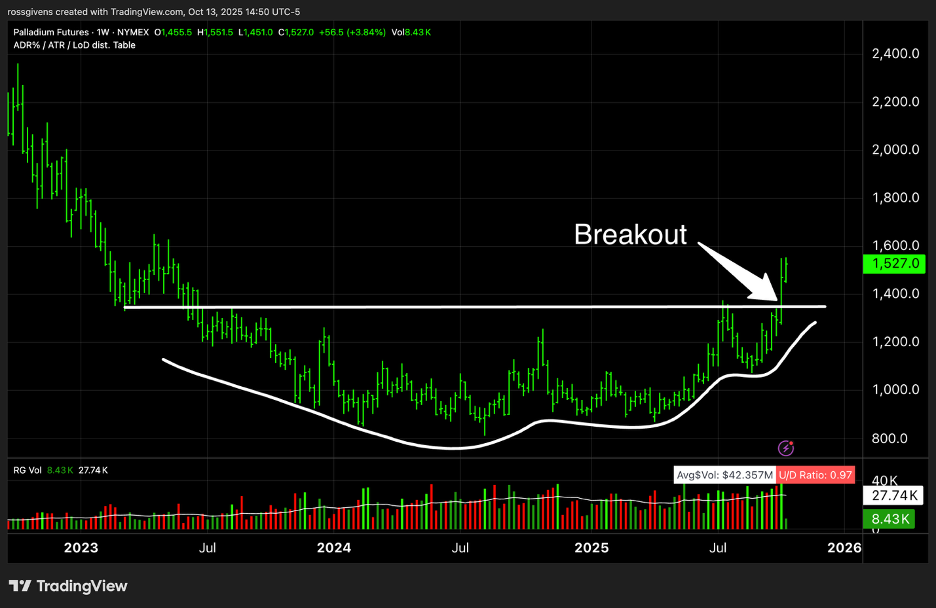
After surging by 40% in June and July, the metal consolidated in a shallowing pattern before breaking through the $1,350 level last week.

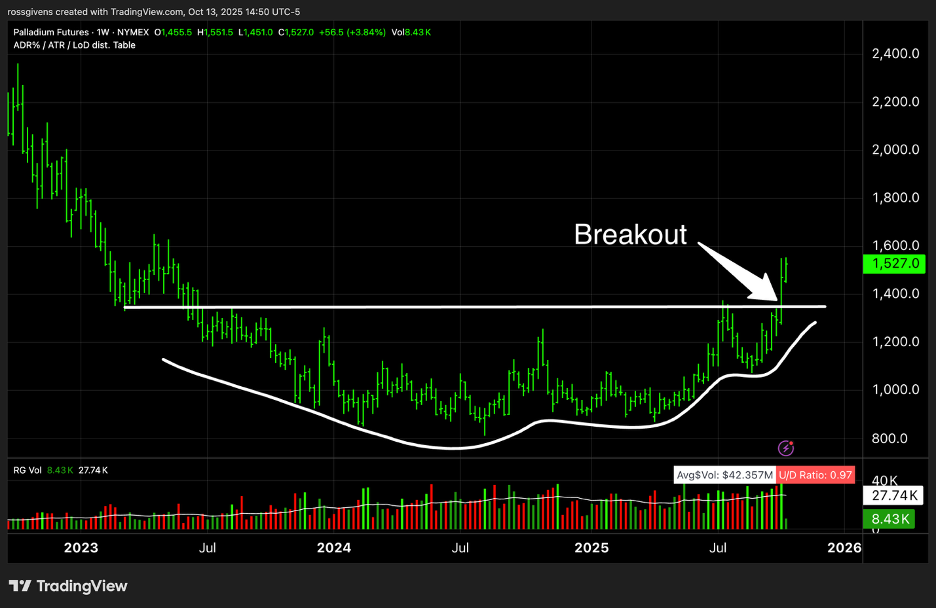
But stepping back, we can see an even larger pattern…

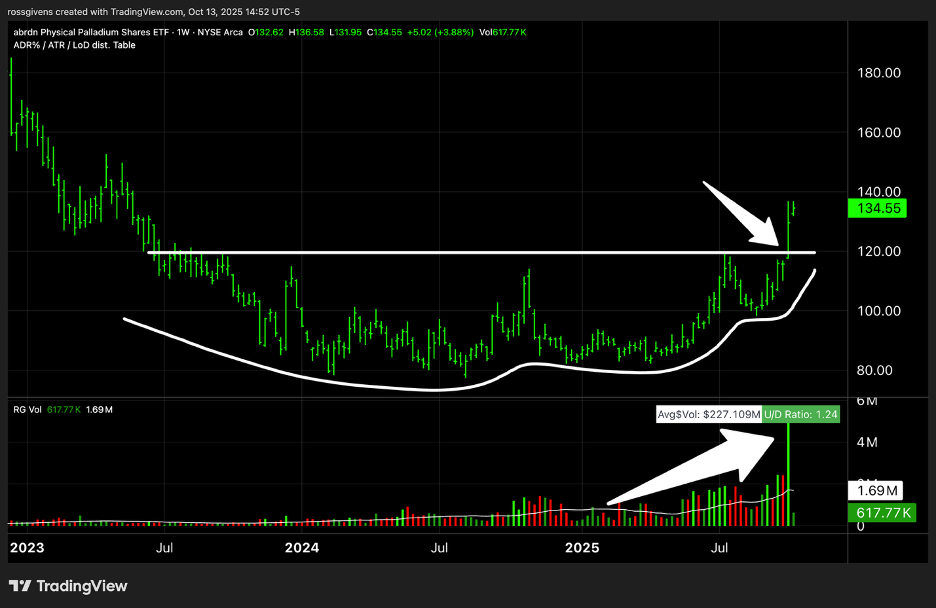
In the weekly chart above, we see a textbook “rounded bottom” pattern that is 2.5 years in the making.

Palladium is a tricky metal to buy since production is so limited. Coins often sell for 15-20% above spot prices whereas gold and silver are typically much lower.

Futures trade in line with spot prices, but it is a big contract. Representing 100 ounces of palladium, one PA futures contract controls $150k of the metal.

Luckily, there is also an ETF. PALL is the ticker symbol for the abrdn Physical Palladium Shares ETF. And if there was any doubt that investors are piling into this sleeper metal, take a look at the chart of PALL below.

Weekly trading volume has tripled in just the last few months.

Gold and silver have made great runs, but each is getting a bit extended. I hold both and believe they will be higher in the future.

But palladium is in the early stages of a fresh breakout. And investors looking for metals exposure may consider adding palladium to their portfolio in one form or another.

Best wishes for your trading,

Weekly Update: Why Every Portfolio Needs Gold

Good evening, and welcome to this week’s edition of Stealth Trades!
Gold has been a currency metal for over 5,000 years. It is the go-to safe haven investment.

But the real appeal of gold is the protection it provides against inflation. And in the next 10 years, we are going to see inflation ramp way, way up.

The culprit behind the coming rise in prices is the same one who always causes inflation. In fact, it is the only entity that is even capable of causing inflation.

I’m talking, of course, about the US Treasury.

Inflation is caused by one thing and one thing only: increasing the money supply. When more dollars chase the same number of goods and services, prices rise. This is basic economics. Yet the Federal Reserve acts shocked every time it happens.

You see, the federal government is incapable of living within its means. Despite taking 30% of our income, it has spent more money than it has taken in in each of the last twenty years. This figure – the difference between what they spend and what they take in – is known as the deficit. And it currently sits at nearly $2 trillion.

When someone doesn’t have enough money to pay their bills, they have two options: don’t pay or borrow money to pay.

America is no different. And every year she chooses the latter, adding trillions more to a national debt that will never be paid off.

That debt takes the form of treasury bonds. When a bank or individual buys those bonds, the government is borrowing money they will one day have to pay back. When the Federal Reserve buys the bonds, they simply print money electronically to purchase them and deposit those funds into government accounts.

This is what increases the money supply. And this alone is the source of our inflation.

But we have now reached what I believe is the point of no return…

Interest payments are now the government’s second largest expenditure. The figure below was through June. And it will exceed one trillion dollars in 2025.

We now spend more money on interest than we do on national defense. And this is entirely unsustainable.

Unfortunately, our legislators do not care. Even the ones who claim to continue passing spending bills that exceed tax receipts by trillions of dollars.

By 2035, interest payments will exhaust 100% of income tax revenue. So that 22% or 32% or 37% of your income you pay in taxes? They will need ALL of it just to service the debt on money they have already spent. And, unlike a mortgage or car loan, none of those payments go toward the principal.

World governments are taking notice. So are central banks. Even individual investors like me see the writing on the wall. The US is broke. And the situation is rapidly getting out of control.

Sovereign investments from countries like China are not going to US bonds anymore. Instead, they are choosing gold. And I believe you should do the same.

Gold is the only real money there is. It has been a currency metal since before Jesus walked the Earth.

The fiat paper money printed by Uncle Sam is dwindling in value.  The US dollar lost a whopping 10% of its value in the first 6 months of 2025 alone. And as the debt continues to rise, it is only going to get worse.

As the deficit rises, the government has to borrow more and more money. At the same time, demand for treasuries is dwindling. This leaves only one solution… printing the money it needs to fill the gaps.

And, once again, we are right back where we started with soaring inflation and rising prices.

The only other option would be to default. But I can’t see Washington ever doing that. It would completely collapse the financial system. Retirement funds and bank reserves holding government bonds would drop to zero overnight. The US dollar would lose its reserve currency status. And foreign nations would economically penalize America any way they could.

Make no mistake, America will try to print this problem away. Because they won’t quit spending.

Even Elon Musk and his DOGE team, which supposedly had the full support of the White House, failed to push any meaningful savings through. In fact, the government voted to raise the debt ceiling by $4 trillion as soon as he left DC.

I don’t say all of this to scare you. By now you should know that I am not a doom and gloom profit. In fact, quite the opposite. I remain bullish on the stock market and American business in general.

But I have run the numbers eighteen different ways and see no other possible outcome. And the only way to protect yourself from the effects of inflation is by owning gold and other physical assets. That means precious metals like gold and silver, residential and commercial real estate, farmland and the like.

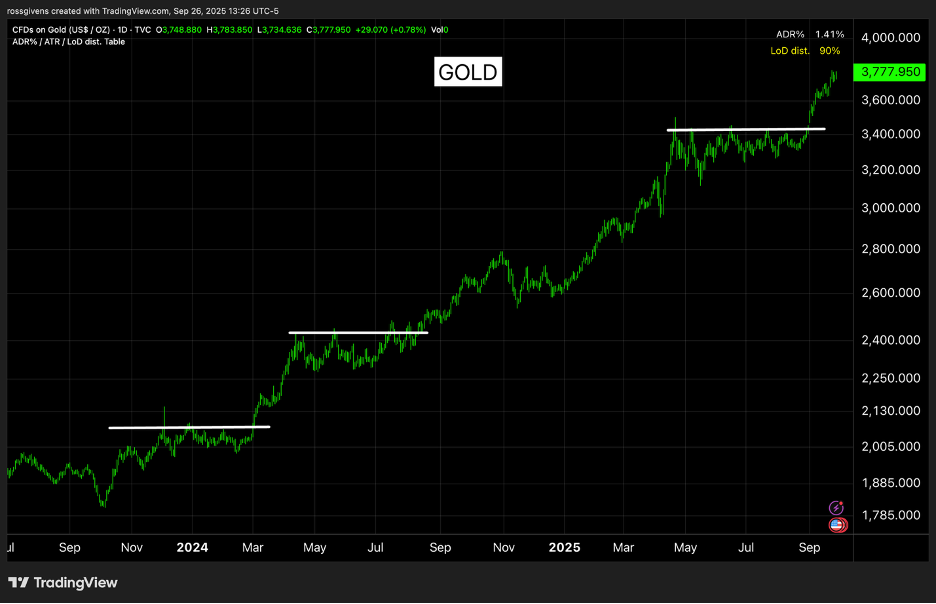
Gold is in the middle of a powerful super cycle. After breaking out of a 14-year base, it has surged from $2,000 in 2024 to $3,700 today.

In all likelihood, this is just the beginning. I expect to see gold at $8,000-$12,000 an ounce by the end of 2027.

Silver is also making a historic move higher.

There are a number of ways to gain exposure. You can buy physical gold and silver from online brokers like Apmex (I just placed an order this morning.) There are also exchange traded funds like GLD (gold) and SLV (silver) as well as mining stock ETFs like GDX (gold miners) or SIL (silver miners). I won both in my retirement account.

Either way, I believe every portfolio needs some exposure in the precious metals space.

Best wishes for your trading,