Weekly Update: Why I’m Bullish in 4 Charts
Good evening, and welcome to this week’s edition of Stealth Trades!
For two weeks I have been saying the low is in; that the bear market is over, and this is the time to buy.
Today I’m going to lay out my case with 4 charts.
These show conditions we typically see at the start of bull markets. And all of them are appearing right now.
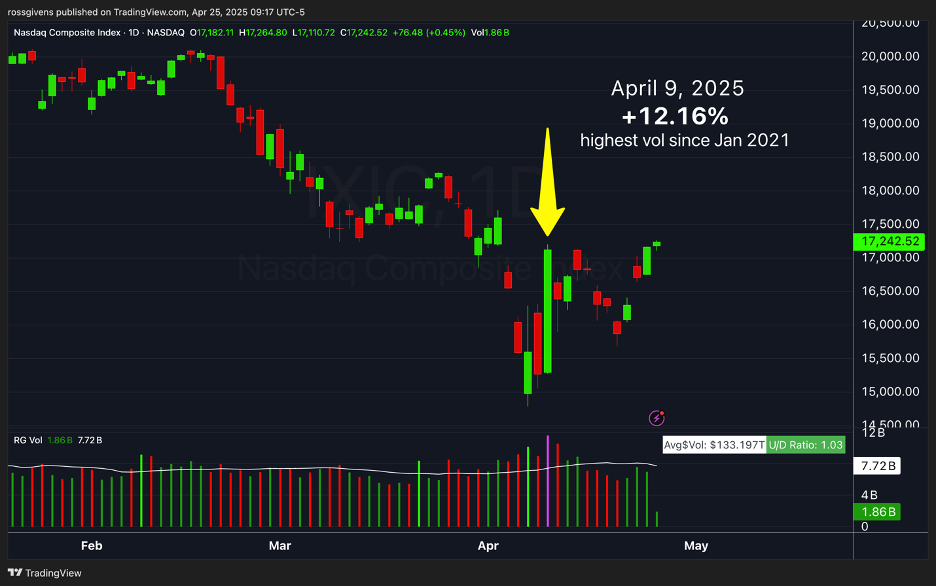
First, at the bottom of a bear market, this is generally a big up day on heavy volume with a close near the high of the day. It is a signal that institutions are piling back in heavily.
On April 9th, we got that signal…
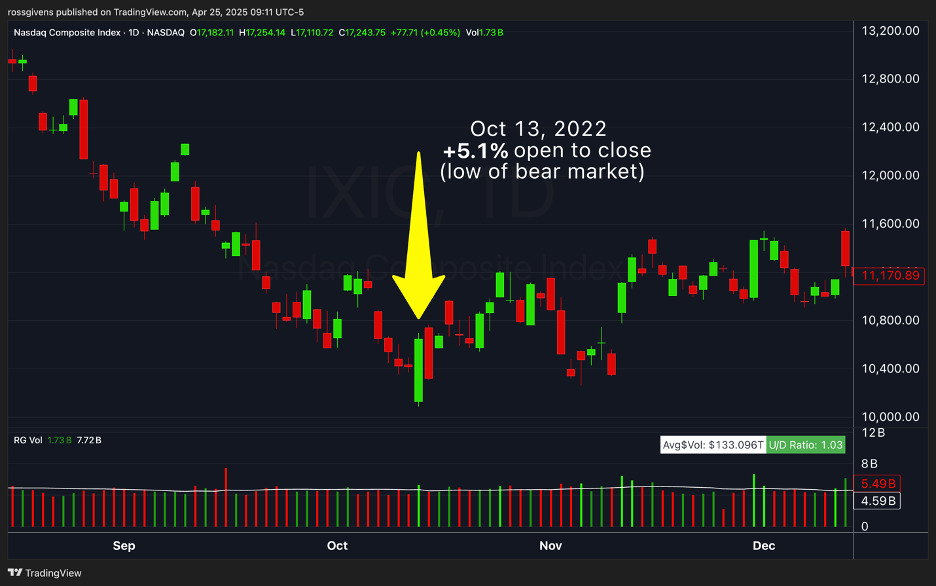
We saw similar price action at the low of the 2022 bear market, the 2020 post-COVID bear market, and the one in late 2018 (see below).


Second is the put/call ratio. The P/C ratio is a contraindicator.
You see, the average investor is not very good. They buy the top, and they sell the low. Their emotions make them sell at the worst possible time.
The put call ratio is a measure of this emotional buying and selling. When the reading gets above 1.0, it means speculators are betting big on stocks going down, and that is typically the best time to buy.
In the chart below, you will see the S&P 500 index on top of the Put/Call Ratio on bottom. Notice how spikes above 1.0 came within days of market lows.

The April 7 reading of 1.18 is playing out just as expected.
Another thing we need to keep our eyes on is the Net New Highs/Lows indicator. This measures how many stocks on the exchange made a new 52-week high that day versus the number that made a new low.
In a healthy market, this number is positive – reflective of broad participation in the market. When it is red (especially very red), there is heavy selling.
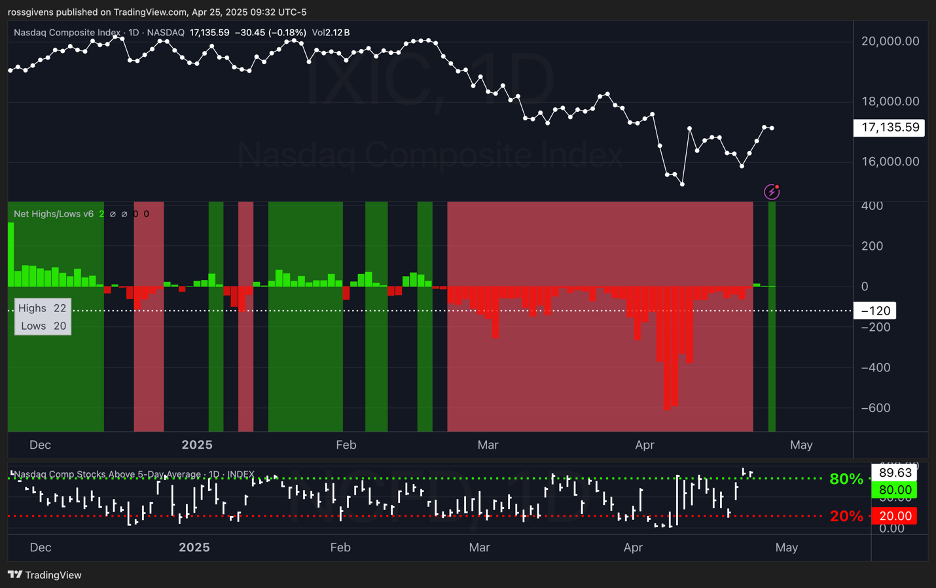
Today, for the first time since February, we are again painting green. This means there have been 3 days in a row of net new highs.
This last chart comes from a talented trader named Matt Caruso.
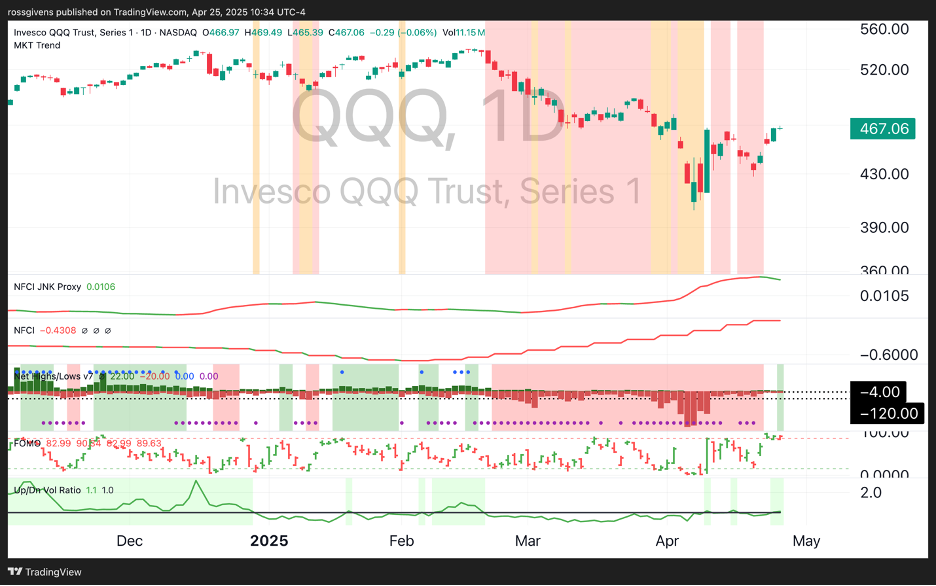
On top is a market trend model looking at a number of breadth indicators that has finally turned bullish.
Beneath that, an inverse JNK moving average which serves as a faster-moving NFCI proxy shows loosening credit conditions and improved liquidity over the last several days.
The bottom of the chart shows the Up/Down Volume Ratio which is finally getting back above 1.0.
There are no guarantees in the stock market. And President Trump is a bit of a wild card. But these bullish metrics have been found at the start of every market recovery in the last decade.
Which leads me to the conclusion that it is time to buy.
Best wishes for your trading,