Weekly Update: Market Setting Up for A Breakout Higher
Good evening, and welcome to this week’s edition of Stealth Trades!
Take a look at the stock chart below.

This pattern is my bread and butter. It is my go-to setup when looking for explosive gains in a short time.
And right now, the entire stock market is setting up in this pattern.
This shallowing pattern, drawn in white on the chart of PRIM stock above, identifies precise breakout levels where supply and demand dynamics work to our advantage.
As you know, stocks don’t go straight up. Even in strong stocks, there are periods of rapid acceleration followed by shallow pullbacks and consolidation.
This is normal. In fact, this is necessary.
Stocks that are allowed to run too far too fast are more susceptible to a crash.
Instead, you want to see this “basing” action periodically as shares advance. Why? To get the selling out of the way.
Investors have different time horizons and different objectives. One investor may be happy to sell when his position rises 10% in value. Another may be targeting 50%. The dreamer may be eying a 500% move. The point is, they will all sell if the price gets high enough.
Primoris – the stock I showed earlier – was up 124% over the prior 10 months. Everyone who bought shares in the last year had a big open profit. That means there are a lot of jittery owners who would likely sell if the stock reverses course in order to lock in some of their gains.
You want to get those people out of the way. The last thing we want to see is a big wave of selling to drive the price lower. This selling is SUPPLY. These are the shares held by weak-handed investors who will quickly cash out if and when the tide turns.
The pattern I drew on white is the process of shaking out those investors.
Here is a more detailed look:
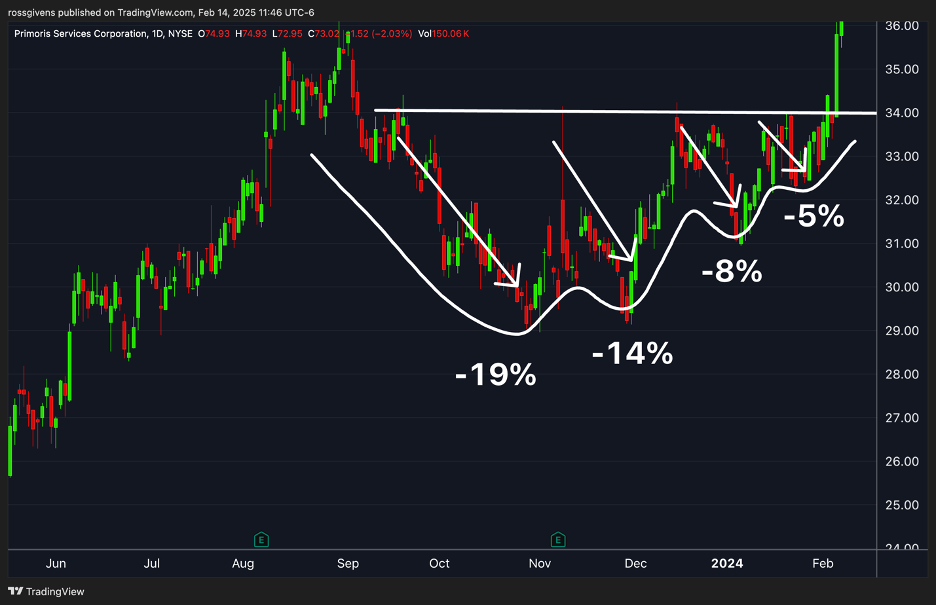
Four waves of selling that became shallower each time.
What you are seeing is this shakeout process where investors are taking profits, having their stop losses hit, and slowly running out of patience.
Over the same time, longer-term institutional investors are buying up those shares and building up their positions.
The stock is being consolidated from weak hands to strong. The “supply” is diminishing until, eventually, everyone who wants to sell has.
At this point, there are no more shares being offered in the $32-$34 range. And once that stock exceeds $34 (the resistance level over the last few months) we know we have moved through this supply zone and buyers must now pay up to acquire additional shares.
The stock is now free to move higher, and it can do so without additional demand.
You will see this pattern repeat again and again in high momentum stocks. There are typically 3-5 clean buying opportunities during a Stage 2 move.
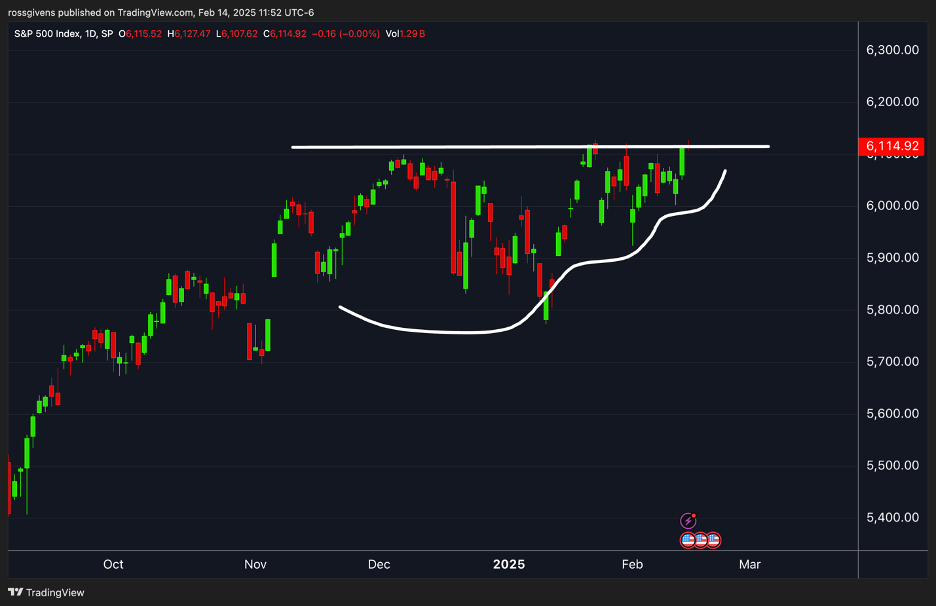
But right now, the indexes are setting up in this same pattern.
Here is the S&P 500…
The Nasdaq looks about the same…
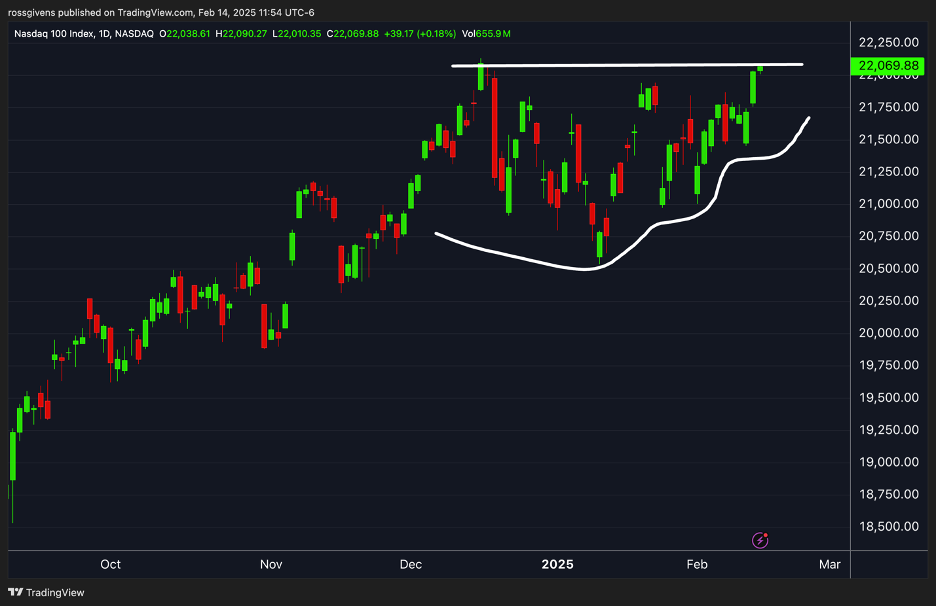
And while nothing is guaranteed, this is extremely bullish to me.
One stock I am keeping an eye on is Natera (NTRA) – a medical technology company that specializes in non-invasive prenatal genetic testing.
Look at the setup on the daily chart below…
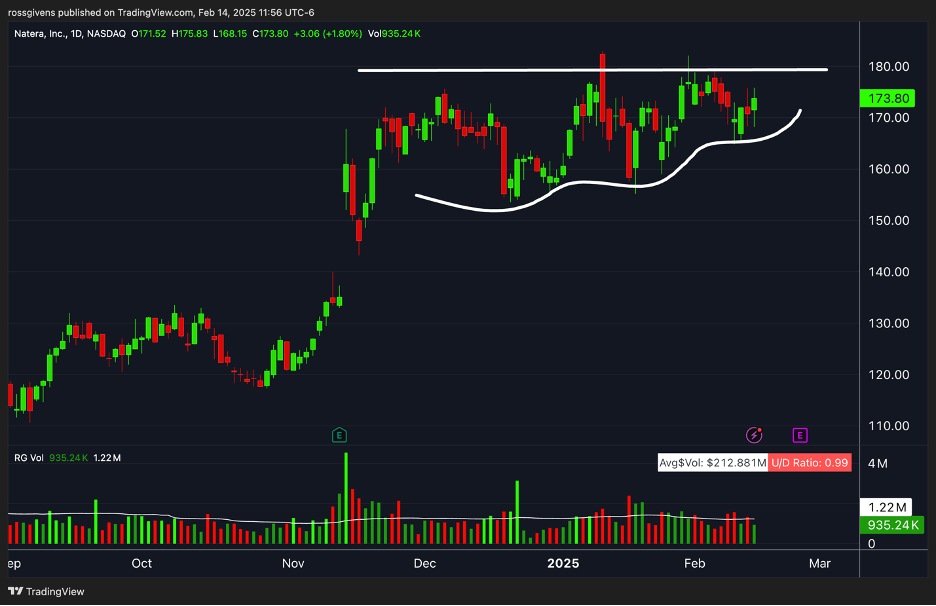
A move above $180 could trigger the next leg higher.
I will consider buying this stock if it can get above $180. Thanks to how tight the consolidation has become, I don’t need to risk a lot of money on it either.
My stop loss would be at $164.50 for a risk of just 8% on the trade.
Best wishes for your trading,