Weekly Update: Don’t Attempt to Catch This Falling Knife

.jpg "Weekly Update: Don’t Attempt to Catch This Falling Knife")
The selling continues…
Last week, I shared why I was bearish on the market and expected stocks to continue lower.
Unsurprisingly, that is exactly what happened.
The Nasdaq and S&P 500 each fell roughly 6%. And BTC dropped another 22% this week!
If you’re new to trading and haven’t experienced one yet, this is what happens in a bear market. It can get ugly in a hurry.
That’s why I’ve been pounding the table since last year telling folks not to get aggressive and remain mostly in cash.
I held a webinar on Tuesday where I talked about a few under-the-surface breadth indicators I am watching to signal when the market has bottomed.
Here is a quick update on the technical picture…
Digging In
The Nasdaq is currently giving oversold readings, which under normal circumstances can lead to a short-term bounce.
But in severe bear markets like this one, stocks will often remain oversold for longer than usual.

Less than 15% of stocks are above their 200-day moving average, and even the strongest groups like chemicals, shipping and energy have broken down and sold off.
The only surprising thing to me is the put/call ratio. Markets tend to bottom at the point of maximum pain.
When the last bull finally capitulates and sells… When the diamond-handed, “hold on for dear life” boys finally throw in the towel… And the financial news is screaming recession, that is usually the bottom.
Traditionally, we see the put/call ratio spike to 1.40 or higher as investors pile into call options to protect what they have left or bet on lower prices.
But this week, it pulled back below 1.00. That’s a signal that investors may not yet have hit their “cry uncle” point.
We also saw another 90% down-volume day on Thursday, making this the seventh one since April.

To put that in perspective, there were only six during the 2020 pandemic selloff.
No Crystal Ball
I don’t pretend to know how low the market will go or where the bottom will be.
In fact, you should be skeptical of anyone who claims they do.
All we can do is listen to the market and trade with the prevailing trend.
One day that trend will be up. But right now, it is unquestionably down.
And for those of you tempted to buy here because stocks look “cheap,” remember that they can always get cheaper.
Selloffs and meltdowns don’t happen from the top. They come at the end of a steady decline.
Want proof? Here’s a comparison of the S&P 500 in 2008 versus today…

I’m not saying this is what will happen… But you can see how the decline accelerated into the later stages of the 2008 bear market.
Okay… If I haven’t bored you yet, here is my Watchlist for this week. It shouldn’t be surprising that they are all short trades…
The Boeing Company (Short Idea)
The Boeing Company (BA) has been trending lower since last March – 10 months before the bear market even started.
Here’s how the chart is setting up…
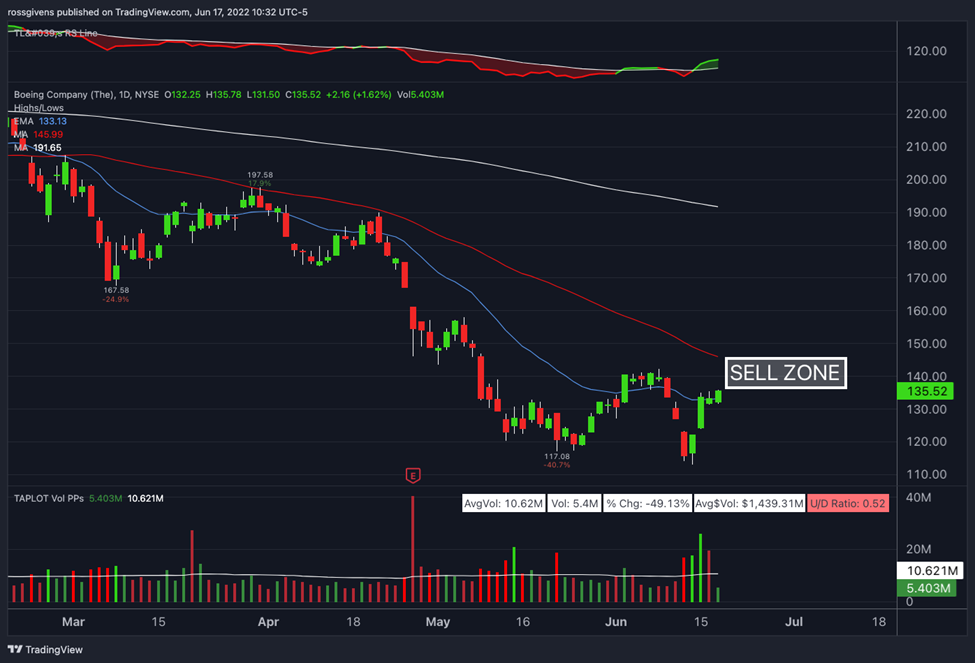
And here’s how the stock is setting up with my Stealth System…
- Surge score: 24/100
- % Above 52-wk low: 18%
- Sales growth: -8%
- Return on Equity: N/A
- Triple momentum: yes (short)
Sales are declining, and the company is losing money hand-over-fist. Institutions have also been exiting the stock for the last four quarters.
If you’ve attended the last few live Monday sessions, you know I prefer to short weak stocks when they bounce up into resistance – preferably a downtrend line or major moving average.
BA is roughly 7% below its 50-day moving average, which will likely serve as resistance for the stock.
Traders may consider selling BA short in the $135-$145 range using a 10% stop for protection.
By the way, do be sure to check in to the live session on Monday right here…
We’re going to have plenty to talk about next week!
JD.com, Inc. (Short Idea)
JD.com, Inc. (JD) is a Chinese retailer offering a wide variety of products via their website and mobile app.
Basically, it is China’s version of Amazon… only not nearly as good.
Here’s how the chart is setting up…

And here’s how the stock is setting up with my Stealth System…
- Surge score: 70/100
- % Above 52-wk low: 58%
- Sales growth: +22%
- Return on Equity: 9%
- Triple momentum: no
I’ll admit to being a bit biased on this one because I strongly dislike Chinese stocks.
I have seen too many rug-pulls, ghost companies and too much outright fraud from Chinese companies to have any real faith in their stocks that trade on our exchanges…
Not to mention the government’s history of nationalizing private industries and just generally hating US investors.
That being said, the stock is a textbook short setup…
After a severe decline, JD bounced into its 200-day moving average, which will likely act as resistance.
Consider selling JD short here with a buy stop near $69.
ZIM Integrated Shipping Services Ltd. (Short Idea)
ZIM Integrated Shipping Services Ltd. (ZIM) is a stronger stock than I typically look to short, but I believe this is the beginning of the end for ZIM.
Here’s how the chart is setting up…

And here’s how the stock is setting up with my Stealth System…
- Surge score: 93/100
- % Above 52-wk low: 106%
- Sales growth: +113%
- Return on Equity: 191%
- Triple momentum: no
The stock has been a market leader in 2022 as marine shipping companies have been able to charge insane rates due to slowdowns in the supply chain.
Earnings surged roughly 10-fold after the pandemic, and the stock has done the same.
But President Biden basically declared war on ZIM and the other handful of companies that control the bulk of cargo shipments from overseas thanks to what the White House believes is “price gouging.”
After an 803% move higher in 2021 and early 2022, ZIM has finally started rolling over.
Shares have seen heavy selling volume over the last few weeks, and the stock is now resting on its 200-day moving average for the first time ever.
If ZIM breaks below $47, I would consider selling it short with a buy stop at $52.
Our Latest Project
My colleague and expert oil trader Anthony Speciale is preparing to unveil his latest project…
He’s been able to make over $100,000 in trading profits for six straight years in a row without using any indicators.
That’s why we highly recommend you click right here to register your email address for the groundbreaking reveal of Project 6×6…
It’s going live on June 21 at 1 p.m. EST. You don’t want to miss this!
Live Coaching Session
Monday, at 3:00 p.m. EDT, we’ll be hosting our regular weekly coaching session for Stealth Trades.
We’ll send you a login reminder that morning, just so you don’t forget.
We’ll cover all of our new stocks on the Watchlist as well as the rest of the stocks inside Stealth Trades.
You need to attend this session to get the most from your subscription!
In the meantime, you can watch the replay of our latest Stealth Trades session right here.
Best wishes for your trading,

Ross Givens
Editor, Stealth Trades
P.S. Don’t miss the groundbreaking reveal of Project 6×6… Click right here to register your email address and stay in the know.


