Weekly Update: The Next Leaders Emerge from the Market Rubble


In our live Alpha Stocks session this past Monday, I pointed out that stocks were severely oversold and I was looking for a short-term bounce. 

Stocks rose as expected during the following week, but as I write this on Friday morning, the rally seems fairly unimpressive.

The S&P 500 is up roughly 4% from last week’s close, but we have not seen aggressive buying volume.

A picture containing chart

Description automatically generated
Daily Chart of S&P 500 Index with Volume Indicators – Source: TradingView

We managed to avoid any new 90% down volume days, but we did not see a 90% up volume day either…

That’s a sign I am waiting for to signal that buyers might be returning.

The number of stocks making new lows continues to outpace the ones making new highs as well.

Graphical user interface, chart

Description automatically generated
Daily Chart of Nasdaq Composite with Market Breadth Indicator – Source: TradingView

While it was good to see the ratio shrinking last week, a healthy market will have stocks breaking out to new highs and fewer names undercutting prior lows.

Unfortunately for the bulls, it has been over two weeks since we have seen a day with net new highs.

Showing Promise

That being said, a few groups of stocks are starting to show promise. 

It is vitally important to watch which stocks are making highs when the market is making lows. 

This is usually the next group of market leaders that can advance several hundred percent once the next bull market begins.

Chemical, shipping and energy stocks were the clear leaders in 2022. But their reign quickly came to an end.

Over the last two weeks, the Energy Select Sector SPDR Fund (XLE) is down 23%. 

Shipping stocks like ZIM Integrated Shipping Services Ltd. (ZIM), Star Bulk Carriers Corp. (SBLK), Genco Shipping & Trading Limited (GNK) and Grindrod Shipping Holdings Ltd. (GRIN) have fallen 25%-30% each. 

And Dow Inc. (DOW) has wiped out all of its 2022 gains in just three weeks.

So… who are the new leaders?

Bullish Biotechs

So far, the new leaders all seem to be biotechnology companies. The SPDR S&P Biotech ETF (XBI) rose over 12% last week. 

And stocks like Meridian Bioscience, Inc. (VIVO), Chinook Therapeutics, Inc. (KDNY), Immunocore Holdings plc (IMCR), Allogene Therapeutics, Inc. (ALLO) and Vertex Pharmaceuticals Incorporated (VRTX) are all showing a lot of strength on increasing volume.

Graphical user interface, chart

Description automatically generated
Meridian Bioscience, Inc. (VIVO) with Volume Indicator – Source: TradingView

The increase in volume is a crucial distinction that is often overlooked by amateur traders. 

We want to see heavy buying from large institutions as they are building up positions. And volume is the secret footprint that reveals this activity.

I am also seeing strength in several solar energy stocks. Daqo New Energy Corp. (DQ), Enphase Energy, Inc. (ENPH), SolarEdge Technologies, Inc. (SEDG), JinkoSolar Holding Co., Ltd. (JKS) and a few others are beginning to set up as potential buys.  

The general market, however, is still in no-man’s land. It has not yet shown enough strength to start heavily buying. 

The indexes are also too far extended to safely enter a good short position.

Therefore, risk-averse traders might consider sitting out for the week until the market shows where it wants to go.

The Nasdaq index, represented below by the Invesco QQQ Trust (QQQ), is beginning to tighten up and coil before making its next move.

A screenshot of a video game

Description automatically generated
Daily Chart of Invesco QQQ Trust (QQQ) – Source: TradingView

Which direction the market moves next remains to be seen, but I have enough confidence in this week’s Watchlist ideas to bring them to you today.

You’ll find two new long ideas and one new short idea added to the Watchlist below…

Chinook Therapeutics, Inc. (Long Idea)

Chinook Therapeutics, Inc. (KDNY) is a biotech stock coming out of a two-year base pattern.

Here’s how the chart is setting up…

TradingView Chart
Weekly Chart of Chinook Therapeutics, Inc. (KDNY) – Source: TradingView

And here’s how the stock is setting up with my Stealth System…

  • Surge score: 97/100
  • % Above 52-wk low: 79%
  • Sales growth: +671%
  • Return on Equity: N/A
  • Triple momentum: yes 

The company has three drugs in its development pipeline, one of which is in Stage 3 clinical trials. 

Good news from that trial could deliver a big surge in the share price.

KDNY has seen several weeks of big volume on its move to the highs. Consider buying the breakout with an 8% stop.

Immunocore Holdings plc (Long Idea)

Immunocore Holdings plc (IMCR) is another biotechnology stock showing a lot of strength.

Here’s how the chart is setting up…

TradingView Chart
Daily Chart of Immunocore Holdings plc (IMCR) – Source: TradingView

And here’s how the stock is setting up with my Stealth System…

  • Surge score: 96/100
  • % Above 52-wk low: 102%
  • Sales growth: +159%
  • Return on Equity: N/A
  • Triple momentum: yes

IMCR just completed a beautiful base pattern with volatility compressing as pullbacks shallowed from left to right – exactly the kind of price action we like to see.

Consider buying this stock here around the $37 mark with an 8% stop loss.

ZIM Integrated Shipping Services Ltd. (Short Idea)

I added ZIM Integrated Shipping Services Ltd. (ZIM) to the Watchlist as a short last week, and it is finally hitting the entry trigger.

Here’s how the chart is setting up…

TradingView Chart
Daily Chart of ZIM Integrated Shipping Services Ltd. (ZIM) – Source: TradingView

And here’s how the stock is setting up with my Stealth System…

  • Surge score: 90/100
  • % Above 52-wk low: 96%
  • Sales growth: +113%
  • Return on Equity: 191%
  • Triple momentum: no

The stock was a market leader in 2022 as marine shipping companies have been able to charge insane rates due to slowdowns in the supply chain. 

Earnings surged roughly 10-fold after the pandemic and the stock has done the same.

But President Biden basically declared war on ZIM and the other handful of companies that control the bulk of cargo shipments from overseas thanks to what the White House believes is “price gouging.”

After an 803% move higher in 2021 and early 2022, ZIM has finally started rolling over. 

Shares have seen heavy selling volume over the last few weeks, and the stock is now resting on its 200-day moving average for the first time ever.

I would consider selling ZIM short with a buy stop at $52 for protection. 

Did You Miss the Big Reveal?

Were you able to join my colleague and expert trader Anthony Speciale for the unveiling of Project 6×6 and his brand-new trading service, Part Time Profits?

If not, you need to check the encore presentation right here!

Anthony revealed the exact “1% trading blueprint” he used to go from working day and night as an auto mechanic…

To banking $100,000+ in real trading profits six straight years in a row.

All by only logging on to his computer from the comfort of his home for 1-2 hours every week…

Click here to watch the full replay now!

Live Coaching Session

Monday, at 3:00 p.m. EDT, we’ll be hosting our regular weekly coaching session for Stealth Trades. 

We’ll send you a login reminder that morning, just so you don’t forget.

We’ll cover all of our new stocks on the Watchlist as well as the rest of the stocks inside Stealth Trades.

You need to attend this session to get the most from your subscription!

In the meantime, you can watch the replay of our latest Stealth Trades session right here.

Best wishes for your trading,

Ross Givens

Editor, Stealth Trades

P.S. Were you able to join my colleague and expert trader Anthony Speciale for the unveiling of Project 6×6 and his brand-new trading service, Part Time Profits?

If not, you need to check the encore presentation right here!

Weekly Update: Don’t Attempt to Catch This Falling Knife

The selling continues…

Last week, I shared why I was bearish on the market and expected stocks to continue lower. 

Unsurprisingly, that is exactly what happened.

The Nasdaq and S&P 500 each fell roughly 6%. And BTC dropped another 22% this week!

If you’re new to trading and haven’t experienced one yet, this is what happens in a bear market. It can get ugly in a hurry.

That’s why I’ve been pounding the table since last year telling folks not to get aggressive and remain mostly in cash.

I held a webinar on Tuesday where I talked about a few under-the-surface breadth indicators I am watching to signal when the market has bottomed.

Here is a quick update on the technical picture…

Digging In

The Nasdaq is currently giving oversold readings, which under normal circumstances can lead to a short-term bounce.

But in severe bear markets like this one, stocks will often remain oversold for longer than usual.

Daily Chart of Nasdaq Composite with Breadth Indicators – Source: TradingView

Less than 15% of stocks are above their 200-day moving average, and even the strongest groups like chemicals, shipping and energy have broken down and sold off.

The only surprising thing to me is the put/call ratio. Markets tend to bottom at the point of maximum pain.

When the last bull finally capitulates and sells… When the diamond-handed, “hold on for dear life” boys finally throw in the towel… And the financial news is screaming recession, that is usually the bottom.

Traditionally, we see the put/call ratio spike to 1.40 or higher as investors pile into call options to protect what they have left or bet on lower prices.

But this week, it pulled back below 1.00. That’s a signal that investors may not yet have hit their “cry uncle” point.

We also saw another 90% down-volume day on Thursday, making this the seventh one since April.

Daily Chart of S&P 500 with Volume Indicators – Source: TradingView

To put that in perspective, there were only six during the 2020 pandemic selloff.

No Crystal Ball

I don’t pretend to know how low the market will go or where the bottom will be.

In fact, you should be skeptical of anyone who claims they do.

All we can do is listen to the market and trade with the prevailing trend.

One day that trend will be up. But right now, it is unquestionably down.

And for those of you tempted to buy here because stocks look “cheap,” remember that they can always get cheaper.

Selloffs and meltdowns don’t happen from the top. They come at the end of a steady decline.

Want proof? Here’s a comparison of the S&P 500 in 2008 versus today…

Daily S&P 500 Comparison Chart 2008 vs. 2022 – Source: TradingView

I’m not saying this is what will happen… But you can see how the decline accelerated into the later stages of the 2008 bear market.

Okay… If I haven’t bored you yet, here is my Watchlist for this week. It shouldn’t be surprising that they are all short trades…

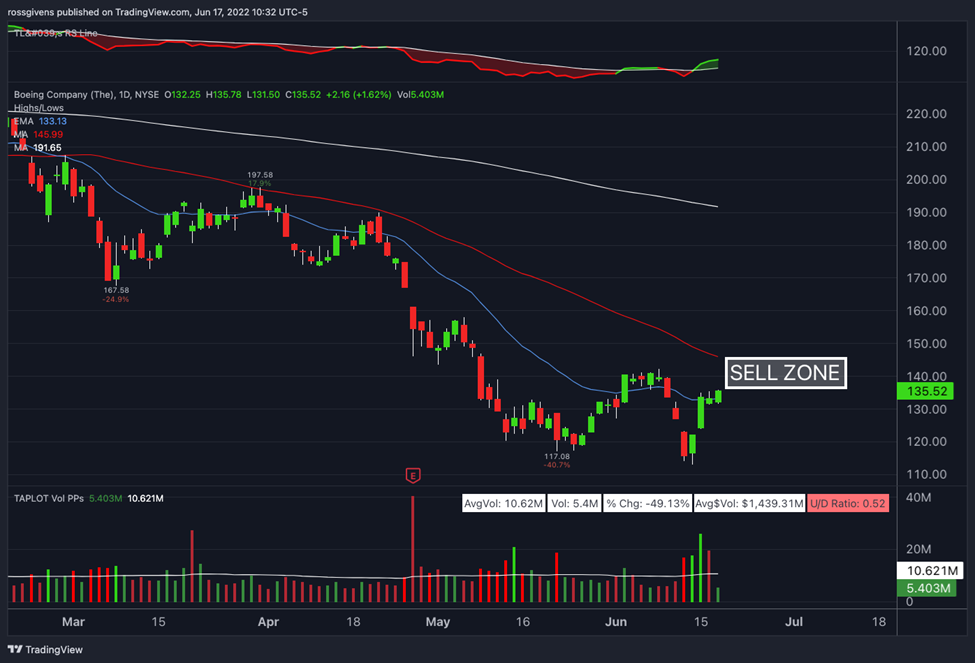
The Boeing Company (Short Idea)

The Boeing Company (BA) has been trending lower since last March – 10 months before the bear market even started.

Here’s how the chart is setting up…

Daily Chart of The Boeing Company (BA) – Source: TradingView

And here’s how the stock is setting up with my Stealth System…

  • Surge score: 24/100
  • % Above 52-wk low: 18%
  • Sales growth: -8%
  • Return on Equity: N/A
  • Triple momentum: yes (short)

Sales are declining, and the company is losing money hand-over-fist. Institutions have also been exiting the stock for the last four quarters.

If you’ve attended the last few live Monday sessions, you know I prefer to short weak stocks when they bounce up into resistance – preferably a downtrend line or major moving average.

BA is roughly 7% below its 50-day moving average, which will likely serve as resistance for the stock.

Traders may consider selling BA short in the $135-$145 range using a 10% stop for protection.

By the way, do be sure to check in to the live session on Monday right here…

We’re going to have plenty to talk about next week!

JD.com, Inc. (Short Idea)

JD.com, Inc. (JD) is a Chinese retailer offering a wide variety of products via their website and mobile app.

Basically, it is China’s version of Amazon… only not nearly as good.

Here’s how the chart is setting up…

Daily Chart of JD.com, Inc. (JD) – Source: TradingView

And here’s how the stock is setting up with my Stealth System… 

  • Surge score: 70/100
  • % Above 52-wk low: 58%
  • Sales growth: +22%
  • Return on Equity: 9%
  • Triple momentum: no

I’ll admit to being a bit biased on this one because I strongly dislike Chinese stocks.

I have seen too many rug-pulls, ghost companies and too much outright fraud from Chinese companies to have any real faith in their stocks that trade on our exchanges…

Not to mention the government’s history of nationalizing private industries and just generally hating US investors.

That being said, the stock is a textbook short setup…

After a severe decline, JD bounced into its 200-day moving average, which will likely act as resistance.

Consider selling JD short here with a buy stop near $69.

ZIM Integrated Shipping Services Ltd. (Short Idea)

ZIM Integrated Shipping Services Ltd. (ZIM) is a stronger stock than I typically look to short, but I believe this is the beginning of the end for ZIM.

Here’s how the chart is setting up…

Daily Chart of ZIM Integrated Shipping Services Ltd. (ZIM) – Source: TradingView

And here’s how the stock is setting up with my Stealth System…

  • Surge score: 93/100
  • % Above 52-wk low: 106%
  • Sales growth: +113%
  • Return on Equity: 191%
  • Triple momentum: no

The stock has been a market leader in 2022 as marine shipping companies have been able to charge insane rates due to slowdowns in the supply chain.

Earnings surged roughly 10-fold after the pandemic, and the stock has done the same.

But President Biden basically declared war on ZIM and the other handful of companies that control the bulk of cargo shipments from overseas thanks to what the White House believes is “price gouging.”

After an 803% move higher in 2021 and early 2022, ZIM has finally started rolling over.

Shares have seen heavy selling volume over the last few weeks, and the stock is now resting on its 200-day moving average for the first time ever.

If ZIM breaks below $47, I would consider selling it short with a buy stop at $52. 

Our Latest Project

My colleague and expert oil trader Anthony Speciale is preparing to unveil his latest project…

He’s been able to make over $100,000 in trading profits for six straight years in a row without using any indicators.

That’s why we highly recommend you click right here to register your email address for the groundbreaking reveal of Project 6×6…

It’s going live on June 21 at 1 p.m. EST. You don’t want to miss this!

Live Coaching Session

Monday, at 3:00 p.m. EDT, we’ll be hosting our regular weekly coaching session for Stealth Trades. 

We’ll send you a login reminder that morning, just so you don’t forget.

We’ll cover all of our new stocks on the Watchlist as well as the rest of the stocks inside Stealth Trades.

You need to attend this session to get the most from your subscription!

In the meantime, you can watch the replay of our latest Stealth Trades session right here.

Best wishes for your trading,

Ross Givens

Editor, Stealth Trades
P.S. Don’t miss the groundbreaking reveal of Project 6×6… Click right here to register your email address and stay in the know.

Weekly Update: Hot CPI Reading Sends Stocks South

The market fell apart this week, with the Nasdaq 100 and S&P 500 each tumbling roughly 5%. 

This was the worst week for stocks since January.

The catalyst? Inflation.

Consumer Price Index (CPI) numbers showed another record level for inflation on Friday.

The hope was that inflation had peaked and the May numbers would show signs of improvement. But the opposite happened…

The CPI rose 8.6% in May, which was a new 40-year high. Stocks responded in kind by selling off hard.

Engineering a Recession

Investors know the Fed has no choice but to aggressively raise rates and engineer a recession in order to fight this trend.

That could mean rate hikes of as much as 0.75% or 1% at the next meeting.

For me, that means it is highly likely the market will undercut the May 20 low and send the bear market on another leg down.

As we’ve discussed, the primary areas of strength in the market over the last six months have been energy, chemical and shipping stocks.

These sectors have made up the majority of our trade ideas and the biggest winners in my Alpha Stocks service.

But even these pockets of strength fell apart last week…

Eagle Bulk Shipping Inc. (EGLE) fell 15.7% on the week, while ZIM Integrated Shipping Services Ltd. (ZIM), another leader throughout the year, dropped 22.3%.

CF Industries Holdings, Inc. (CF), Genco Shipping & Trading Limited (GNK), Dow Inc. (DOW) and dozens of other top-performers all broke down below their pivot levels and undercut their 50-day moving averages.

For the time being, there seems to be nowhere to hide in this bloodbath.

Join Me on Monday

Bonds are down. Stocks are down. Digital currencies are down. Even gold, which typically rises during times of crisis, cannot seem to mount a rally.

I have been trading for over 15 years, and this is probably the most difficult environment I have ever seen.

Many traders I talk to are choosing to go to cash and sit out until things calm down.

But I am expecting lower prices and more downside in the markets. 

With that in mind, I hope you’ll join me on Monday afternoon for our live Stealth Trades session at 3:00 p.m. ET…

I’m going to be outlining our plan for dealing with a market environment like this.

We’ll talk about inflation and how it is impacting the markets we track, and we’ll take a look at our Watchlist stocks and other potential ideas in more detail.

So again, please join me right here Monday at 3:00 p.m. ET!

Now, here are the three new short ideas I’m watching this week…

Grayscale Bitcoin Trust (Short Idea)

The Grayscale Bitcoin Trust (GBTC) is an exchange-traded fund that gives investors access to Bitcoin in the form of a security.

It trades like a stock and can be bought in any traditional brokerage account, so you don’t have to go through a digital currency exchange to trade it.

Here’s how the chart is setting up…

Daily Chart of Grayscale Bitcoin Trust (GBTC) – Source: TradingView 

And here’s how the stock is setting up with my Stealth System…

  • Surge score: 16/100
  • % Above 52-wk low: 9%
  • Sales growth: N/A
  • Return on Equity: N/A
  • Triple momentum: yes (short)

There was long-term support near the $24 area, which broke in early May.

Since breaching this level, GBTC cannot seem to rally and has formed a shelf over the last several weeks.

Traders may consider selling short here or once GBTC breaks below the $18.80 level. I would place a buy stop at $21.00 for protection.

Green Brick Partners, Inc. (Short Idea)

Green Brick Partners, Inc. (GRBK) is a residential homebuilder, and the stock looks ripe for another move lower.

Homebuilders saw huge profits in 2020 and 2021 thanks to a construction boom and rapidly rising home prices. But the party is coming to an end.

Interest rates have more than doubled over the last six months, and the country is on the verge of recession.

With rates expected to rise even further, it is hard to imagine this not ending in collapsing home prices and a serious slowdown in construction.

Here’s how the chart is setting up…

Daily Chart of Green Brick Partners, Inc. (GRBK) – Source: TradingView

And here’s how the stock is setting up with my Stealth System…

  • Surge score: 75/100
  • % Above 52-wk low: 22%
  • Sales growth: +68%
  • Return on Equity: 25%
  • Triple momentum: no 

GRBK has traded below its 200-day moving average (white line) since January. 

Shares rallied back in the second quarter but are now failing and rolling over. 

Traders could take a short position in the stock here with a buy stop above the swing high at $25.05 to risk 9% on the trade. 

Skechers U.S.A., Inc. (Short Idea)

Since going public in 1999, Skechers U.S.A., Inc. (SKX) stock has regularly seen huge swings in both directions.

It mounts powerful rallies and suffers crippling falls. But if you can catch it at a turning point, the profits can be large.

Here’s how the chart is setting up…

Daily Chart of Skechers U.S.A., Inc. (SKX) – Source: TradingView

And here’s how the stock is setting up with my Stealth System…

  • Surge score: 71/100
  • % Above 52-wk low: 17%
  • Sales growth: +27%
  • Return on Equity: 14%
  • Triple momentum: yes (short)

SKX has been trending lower for almost a year with a series of lower lows and lower highs.

The stock rallied 25% off the May lows right into the dotted downtrend line and its 200-day moving average.

This is a low-risk area to try a short trade. Traders can place a buy stop on the other side of the 200-day line at $43.00 for protection. The risk is just under 7%.

Finding Real Alpha

With the major indexes down double-digits and many of last year’s leading stocks down over 50%, consider checking out my Alpha Stocks trading service.

We just scored a serious gain in Permian Basin Royalty Trust (PBT) in a little over two weeks.

We also recently recorded a huge winning trade on the downside in only eight days as Pegasystems Inc. (PEGA) stock plunged last month…

Alpha Stocks also provides option alternatives if that’s more of your style.

And we get together every Monday for an hour-long live session so that subscribers can ask questions and get guidance about our trades.

If you’re ready to see what you could be missing out on, click here to learn more about Alpha Stocks now!

Live Coaching Session

Monday, at 3:00 p.m. EDT, we’ll be hosting our regular weekly coaching session for Stealth Trades. 

We’ll send you a login reminder that morning, just so you don’t forget.

We’ll cover all of our new stocks on the Watchlist as well as the rest of the stocks inside Stealth Trades.

You need to attend this session to get the most from your subscription!

In the meantime, you can watch the replay of our latest Stealth Trades session right here.

Best wishes for your trading,

Ross Givens

Editor, Stealth Trades
P.S. If you’re ready to see what you could be missing out on, click here to learn more about Alpha Stocks now!

Weekly Update: Back to Bullish This Week

The lows that the S&P 500, Nasdaq 100 and Dow Jones all made on May 20 continue to hold.

Since then, we’ve seen a valid follow-through day on May 26 and strong action that week.

Daily Chart of S&P 500 Index – Source: TradingView

This week, the indexes were largely unchanged. As I’m writing this on Friday morning, the S&P and Nasdaq are flat to slightly lower for the week.

I’m happy to see recent gains are holding.

But for the coming week, I would like to see additional accumulation. In other words, I want to see stocks move up on increased volume.

Breakouts as a whole have been performing much better over the last couple of weeks.

We purchased Permian Basin Royalty Trust (PBT) in my Alpha Stocks research service on May 17, and shares soared 33% in just two weeks following a clear breakout.

Other names have also shown good progress.

So, unless the May 20 low is breached and the market begins another leg lower, I am now bullish on the market and looking for long trades.

Here are the three ideas I’m watching this week, all of which are setting up with clear horizontal breakout boundaries…

Howmet Aerospace Inc.

Howmet Aerospace Inc. (HWM) is a $15 billion specialty industrial company that engineers metal products for the aerospace and transportation industries across the globe.

The company is a major supplier for Boeing (BA).

Here’s how the chart is setting up…

Daily Chart of Howmet Aerospace Inc. (HWM) – Source: TradingView

And here’s how the stock is setting up with my Stealth System…

  • Surge score: 91/100
  • % Above 52-wk low: 36%
  • Sales growth: +10%
  • Return on Equity: 9%
  • Triple momentum: yes

As you can see in the chart above, HWM is completing a large “cup with handle” pattern.

This is a 13-month base, so it could lead to a sustained move higher if shares can break out on good volume.

Relative strength (RS) has been climbing all year, and the RS line has made nine new highs since May.

I’m looking for a strong move through $37.50 to signal a buy. Consider working a stop beneath the 21-day moving average at $34.70.

Enact Holdings, Inc.

Enact Holdings, Inc. (ACT) is a $4 billion private mortgage insurance company and a recent initial public offering (IPO) that is consolidating nicely at its highs.

I like trading newer issues since the first breakout can lead to a strong move to the upside.

Here’s how the chart is setting up…

Daily Chart of Enact Holdings, Inc. (ACT) – Source: TradingView

And here’s how the stock is setting up with my Stealth System…

  • Surge score: 94/100
  • % Above 52-wk low: 36%
  • Sales growth: -&%
  • Return on Equity: 14%
  • Triple momentum: yes

ACT is unique compared to most new issues in that it never undercut its initial price.

Most IPOs trade lower, sometimes significantly lower, after going public.

But ACT’s ability to hold up after its debut, especially in these market conditions, is a good sign of strength.

Consider buying ACT if it makes a new high. My buy trigger would be $24.90 with a stop at $22.85.

FLEX LNG Ltd.

FLEX LNG Ltd. (FLNG), with a market cap of $1.6 billion, builds and operates carrier vessels to transport liquefied natural gas.

The oil and gas sector continues to lead the market, so it is not surprising that FLNG keeps coming up on my strength scans.

Here’s how the chart is setting up…

Daily Chart of Enact Holdings, Inc. (ACT) – Source: TradingView

And here’s how the stock is setting up with my Stealth System…

  • Surge score: 98/100
  • % Above 52-wk low: 163%
  • Sales growth: -8%
  • Return on Equity: 19%
  • Triple momentum: yes

After a big run higher in March, shares have consolidated over the last eight weeks.

Thursday saw a big up day on three times average daily volume as FLNG broke through resistance.

Consider buying at current levels, and use a 10% stop loss.

Finding Real Alpha

With the major indexes down double-digits and many of last year’s leading stocks down over 50%, consider checking out my Alpha Stocks trading service.

As I mentioned above, we just scored a serious gain in Permian Basin Royalty Trust (PBT) in a little over two weeks.

We have plenty of long ideas for the right stocks, but we’re also not afraid to go short. 

We also recently recorded a huge winning trade on the downside in only eight days as Pegasystems Inc. (PEGA) stock plunged last month…

We short stocks, but we also provide option alternatives if that’s more of your style.

And we get together every Monday for an hour-long live session so that subscribers can ask questions and get guidance about our trades.

If you’re ready to see what you could be missing out on, click here to learn more about Alpha Stocks now!

Live Coaching Session

Monday, at 3:00 p.m. EDT, we’ll be hosting our regular weekly coaching session for Stealth Trades. 

We’ll send you a login reminder that morning, just so you don’t forget.

We’ll cover all of our new stocks on the Watchlist as well as the rest of the stocks inside Stealth Trades.

You need to attend this session to get the most from your subscription!

In the meantime, you can watch the replay of our latest Stealth Trades session right here.

Best wishes for your trading,

Ross Givens

Editor, Stealth Trades
P.S. If you’re ready to see what you could be missing out on, click here to learn more about Alpha Stocks now!

Weekly Update: Ready to Sell the Snap-Back Rally

Surprise, surprise… Another down week for stocks.

As I pointed out last week, the trend is unquestionably bearish. 

The markets continue to see sellers in control with high volume on the downside.

As I write this update, the S&P 500 is trading within 2% of its 52-week low… 

Not a good sign for bulls.

Retail Gets Rocked

Retail was hit hardest this week, which was certainly a contributing factor to the overall selloff.

Disappointing numbers from Walmart (WMT) and Target (TGT) triggered a selloff in consumer staple stocks, which is typically a sector that investors look to for safety.

In just three days, Target stock fell 30%, and Walmart was down almost 20%. Even Procter & Gamble (PG) was down double digits. 

Higher prices at the grocery store are translating to lower sales and profits.

And what’s happening is that Wall Street is learning that the retail consumer, the biggest overall contributor to gross domestic product (GDP), is not as healthy as we thought. 

Sell the Snap-Back

I remain bearish on the overall market and will again focus on short trades next week. 

But it is important to remember that we could see a “snap-back rally” at any time. 

If that happens, I will use it as a chance to sell the bounce and get short the worst-performing stocks as they approach their 50-day moving averages. 

Historically, some of the biggest rallies occur during bear markets. 

Daily Chart of Nasdaq 100 Index — Source: TradingView

Back in March, for example, the Nasdaq 100 jumped 17% in just two weeks. 

But the selling soon resumed. 

So, be cautious and don’t get sucked into buying until we have real confirmation that the bear has been killed. 

I’ll let you know when the time comes. For now, here’s our latest list of short candidates…

SPX Corporation (Short Idea)

SPX Corporation (SPXC) is a $2.2 billion infrastructure equipment company for the heating and air industry.

Here’s how the chart is setting up…

TradingView Chart
Daily Chart of SPX Corporation (SPXC) — Source: TradingView

And here’s how the stock is setting up with my Stealth System…

  • Surge score: 38/100
  • % Above 52-wk low: 13%
  • Sales growth: +7%
  • Return on Equity: 12%
  • Triple momentum: yes (short)

SPXC has been falling all year. The stock has stair-stepped its way down in a series of lower lows and lower highs.

Resistance can be found at the red 50-day moving average where I have highlighted sell zones on the chart above. 

Consider shorting SPXC here with a stop above the $50 level.

Alarm.com Holdings, Inc. (Short Idea)

Alarm.com Holdings, Inc. (ALRM) is a $3.1 billion technology company that makes smart devices and systems for residential and commercial properties.

Here’s how the chart is setting up…

TradingView Chart
Daily Chart of Alarm.com Holdings, Inc. (ALRM) — Source: TradingView

And here’s how the stock is setting up with my Stealth System…

  • Surge score: 38/100
  • % Above 52-wk low: 12%
  • Sales growth: +19%
  • Return on Equity: 19%
  • Triple momentum: yes (short)

You’ll notice the chart for ALRM looks almost identical to SPXC…

Both are following the same pattern of lower lows and lower highs and finding resistance at the 50-day.

I suggest using last week’s rally as an opportunity to sell ALRM short with a buy stop around the $65 mark. 

If the trade works properly, the stock should make new lows in a week or two, which is where I would begin taking profits.

Advanced Micro Devices, Inc. (Short Idea)

Advanced Micro Devices, Inc. (AMD) is the $153 billion semiconductor company best known for its computing and graphics processors.

Here’s how the chart is setting up…

TradingView Chart
Daily Chart of Advanced Micro Devices, Inc. (AMD) — Source: TradingView

And here’s how the stock is setting up with my Stealth System…

  • Surge score: 59/100
  • % Above 52-wk low: 16%
  • Sales growth: +71%
  • Return on Equity: 52%
  • Triple momentum: yes (short)

The fundamentals for AMD actually look good. But as always, the market knows best…

And the market has been selling AMD en masse for the last six months.

This week, the stock tested its 50-day moving average (red line) without success. 

The stock appears to be rolling over, giving investors a low-risk opportunity to play the short side.

Consider selling AMD short here with a stop above this week’s high at $104.25. 

Where’s the Alpha?

With the major indexes down double-digits and many of last year’s leading stocks down over 50%, consider checking out my Alpha Stocks trading service.

We have plenty of long ideas for the right stocks, but we’re also not afraid to go short. We short stocks and we also provide option alternatives if that’s more of your style.

And we get together every Monday for an hour-long live session so that subscribers can ask questions and get guidance about our trades.

If you’re ready to see what you could be missing out on, click here to learn more about Alpha Stocks now!

Live Coaching Session

Monday, at 3:00 p.m. EDT, we’ll be hosting our regular weekly coaching session for Stealth Trades. 

We’ll send you a login reminder that morning, just so you don’t forget.

We’ll cover all of our new stocks on the Watchlist as well as the rest of the stocks inside Stealth Trades.

You need to attend this session to get the most from your subscription!

In the meantime, you can watch the replay of our latest Stealth Trades session right here.

Best wishes for your trading,

Ross Givens

Editor, Stealth Trades
P.S. If you’re ready to see what you could be missing out on, click here to learn more about Alpha Stocks now!

Weekly Update: Preparing to Short the Oversold Bounce

Stocks saw more selling this week with each of the major indexes making new 52-week lows.

As I pointed out in last week’s update, this was largely expected.

Institutions were clearly reducing exposure, as evidenced by the increase in volume on the acceleration down.

Nasdaq Composite Index — Source: MarketSmith, Inc.

Given the violence of the recent selloff, I believe we are due for an oversold bounce.

In other words, stocks could make a short-term rally before continuing the move lower.

Just as stocks do not go straight up, they do not go straight down either.

They tend to stair-step their way lower with short, weak rallies in between periods of heavy selling.

I remain bearish on the market until we see meaningful signs of recovery.

At a minimum, this would mean waiting for a follow-through day and preferably several days of meaningful buying and new stocks setting up in breakout formations.

Finding good targets to sell short can be difficult when they are falling rapidly.

If you are a regular attendee of my weekly Stealth Trades or Alpha Stocks live weekly sessions, you know I prefer to sell short off a bounce and against some level of resistance.

We did so in Alpha Stocks two weeks ago and made over 600% buying put options on Pegasystems Inc. (PEGA) before the stock fell more than 40%.

My trade ideas this week will again focus on short opportunities.

Each of these names are in clear downtrends, and I will be pointing out low-risk areas where I would be interested in selling them short.

Evercore Inc. (Short Idea)

Evercore Inc. (EVR) was a market leader following the pandemic selloff of 2020. Shares climbed over 400% before peaking in October. 

Since then, EVR has reversed course.

Here’s how the chart is setting up…

Daily Chart of Evercore Inc. (EVR) — Source: TradingView

And here’s how the stock is setting up with my Stealth System…

  • Surge score: 37/100
  • % Above 52-wk low: 5%
  • Sales growth: +9%
  • Return on Equity: 66%
  • Triple momentum: yes (short)

EVR now trades below its 200-day moving average, trending lower and cannot rally above the 50-day moving average (red line).

It is now trading against its downtrend line and just below the 50-day.

I like this as a short trade with a buy stop at $117 for protection.

Central Garden & Pet Company (Short Idea)

Central Garden & Pet Company (CENTA) is a mid-cap consumer goods company selling pet food and garden supplies direct to consumer.

In the age of Amazon, this is a questionable business model at best. And based on the technicals, this stock could be on the verge of a major decline.

Here’s how the chart is setting up…

Daily Chart of Central Garden & Pet Company (CENTA) — Source: TradingView

And here’s how the stock is setting up with my Stealth System…

  • Surge score: 67/100
  • % Above 52-wk low: 7%
  • Sales growth: +2%
  • Return on Equity: 14%
  • Triple momentum: yes (short)

Shares are forming a bearish “wedge” pattern with long-term support near the $40 mark.

But we don’t need to wait for it to break down before shorting the stock.

CENTA is trading right up against its downtrend line and just a dollar below the 200-day moving average. That’s a lot of resistance to push through.

I would consider selling this short in the $42-$43 range with a buy stop at $45.

This comes out to a risk of roughly 5% on a trade that could deliver a big win on the downside.

Adobe Inc. (Short Idea)

Adobe Inc. (ADBE) is one in a long list of past winners that has given back all of its post-pandemic gains.

The stock is down 43% since November and could fall further.

Here’s how the chart is setting up…

Daily Chart of Adobe Inc. (ADBE) — Source: TradingView

And here’s how the stock is setting up with my Stealth System…

  • Surge score: 29/100
  • % Above 52-wk low: 9%
  • Sales growth: +9%
  • Return on Equity: 43%
  • Triple momentum: yes (short)

The trend is unquestionably bearish for ADBE stock, and shares have been unable to trade above their 50-day moving average for almost six months.

I would consider selling ADBE short in the $410-$425 area for a continuation move lower.

Work a stop at $442 for protection.

Where’s the Alpha?

With the major indexes down double-digits and many of last year’s leading stocks down over 50%, consider checking out my Alpha Stocks trading service.

We have plenty of long ideas for the right stocks, but we’re also not afraid to go short. We short stocks and we also provide option alternatives if that’s more of your style.

And we get together every Monday for an hour-long live session so that subscribers can ask questions and get guidance about our trades.

If you’re ready to see what you could be missing out on, click here to learn more about Alpha Stocks now!

Live Coaching Session

Monday, at 3:00 p.m. EDT, we’ll be hosting our regular weekly coaching session for Stealth Trades. 

We’ll send you a login reminder that morning, just so you don’t forget.

We’ll cover all of our new stocks on the Watchlist as well as the rest of the stocks inside Stealth Trades.

You need to attend this session to get the most from your subscription!

In the meantime, you can watch the replay of our latest Stealth Trades session right here.

Best wishes for your trading,

Ross Givens

Editor, Stealth Trades

P.S. If you’re ready to see what you could be missing out on, click here to learn more about Alpha Stocks now!

Weekly Update: Shorting the Worst Market We’ve Seen In a Long Time

The S&P 500, Nasdaq and Russell 2000 indexes all made new lows this week.

And Friday was the 22nd consecutive day with more new lows made on the Nasdaq Composite than new highs.

Daily Chart of Nasdaq Composite Index with Net New Highs & Lows — Source: TradingView

It is clear that sellers remain in control, and we may very well see stocks continue to sell off.

Many of the growth stocks that fueled the bull market over the last two years have given up all of their post-COVID gains.

PayPal (PYPL), Netflix (NFLX), Shopify (SHOP) and dozens of other household names are down more than 70% from last year’s highs.

This week, the Federal Reserve raised interest rates by 0.50%, which was the largest hike in 22 years.

The Fed is expected to continue raising rates throughout the year to fight inflation…

Yes, the same inflation it caused by printing trillions of dollars over the past few years.

Guilty Until Proven Innocent

To say that market conditions are poor is a gross understatement.

Billionaire trading legend Paul Tudor Jones told CNBC recently, “You can’t think of a worse macro environment than where we are right now for financial assets…”

He continued, saying, “If there was a strategy that I would want to employ right now, if someone put a gun to my head, I’d say simple trend-following strategies.”

And folks… The trend is unquestionably pointing down.

Therefore, I am only interested in short trades at this time.

I will need to see this market rally, put in a follow-through day, and then hold without further distribution before I start buying stocks again.

With all that said, here are the setups I am watching this week…

J.B. Hunt Transport Services, Inc. (Short Idea)

J.B. Hunt Transport Services, Inc. (JBHT) is a $18 billion logistics services company focused on trucks and transporting stuff via those trucks.

Here’s how the chart is setting up…

Daily Chart of J.B. Hunt Transport Services, Inc. (JBHT) — Source: TradingView

And here’s how the stock is setting up with my Stealth System…

  • Surge score: 64/100
  • % Above 52-wk low: 11%
  • Sales growth: +33%
  • Return on Equity: 27%
  • Triple momentum: no

JBHT is a stock we played on the upside last summer.

But price broke down in a big way last month, falling from $220 to $170 on accelerating volume.

Shares have now put in a shelf around the $165 mark where buyers appear to be supporting the stock.

If it breaks that low, consider selling short with a stop at $179.

Norwegian Cruise Line Holdings Ltd. (Short Idea)

Norwegian Cruise Line Holdings Ltd. (NCLH) is an $8 billion cruise line company operating under several different brand names with approximately 28 ships.

Here’s how the chart is setting up…

Daily Chart of Norwegian Cruise Line Holdings Ltd. (NCLH) — Source: TradingView

And here’s how the stock is setting up with my Stealth System…

  • Surge score: 31/100
  • % Above 52-wk low: 23%
  • Sales growth: +1,000%
  • Return on Equity: N/A
  • Triple momentum: yes

Norwegian Cruise Line has been trending lower since mid-2021.

After breaking below its 200-day moving average, the stock has been unable to rally above it.

When selling short, I prefer to do so against a resistance level like a major moving average when possible.

For NCLH, I am looking for a pop higher that we can sell into just beneath the 200-day (white line on the chart above).

The company is scheduled to report earnings on Tuesday. If the numbers are good, it might propel NCLH near the $21 level, which is where I would like to sell.

The buy stop would be on the other side of the 200-day moving average.

Summit Materials, Inc. (Short Idea)

Summit Materials, Inc. (SUM) is a $3 billion provider of construction and building materials for both residential and non-residential customers.

Here’s how the chart is setting up…

Daily Chart of Summit Materials, Inc. (SUM) — Source: TradingView

And here’s how the stock is setting up with my Stealth System…

  • Surge score: 40/100
  • % Above 52-wk low: 1%
  • Sales growth: -2%
  • Return on Equity: 8%
  • Triple momentum: yes (short)

Summit is a classic “broken leader” that could easily get cut in half over the next few months.

The stock advanced more than five-fold from the 2020 lows to late 2021 but has now turned south.

The 200-day line has been broken, and last month’s rally attempt failed and has now returned the stock to its lows.

The company announced larger losses than expected in its quarterly earnings report this week, which is only adding fuel to the bearish fire.

Consider selling SUM short on a move below $26.40.

Join the Insiders

Now, if you’ve ever wondered how I developed a proven track record of trading along the insiders like corporate CEOs, CFOs, executives and board members…

Do yourself a favor and check out my latest Insider Effect presentation!

Corporate insiders are always buying or selling shares in the companies they operate. These folks have a footing of knowledge that Main Street investors simply do not.

I talked more about this in my latest presentation, which you can watch at your convenience right here.

I covered my strategy for trading alongside corporate insiders and generating potentially massive gains as a result.

Just click here to learn more about my Insider Effect strategy and see what you could be missing out on.

Live Coaching Session

Monday, at 3:00 p.m. EDT, we’ll be hosting our regular weekly coaching session for Stealth Trades. 

We’ll send you a login reminder that morning, just so you don’t forget.

We’ll cover all of our new stocks on the Watchlist as well as the rest of the stocks inside Stealth Trades.

You need to attend this session to get the most from your subscription!

In the meantime, you can watch the replay of our latest Stealth Trades session right here.

Best wishes for your trading,

Ross Givens

Editor, Stealth Trades
P.S. Click here to learn more about my Insider Effect strategy and see what you could be missing out on.

Weekly Update: Revising the Meaning of “Don’t Fight the Fed”

Many of you have likely heard the old Wall Street adage, “Don’t fight the Fed.”

Usually, this phrase is uttered by bullish investors warning their bearish counterparts not to short a rising market being fueled by easy monetary policy.

But at this point, with the Federal Reserve seemingly set to defeat rising inflation by any means necessary, it’s taking on a different meaning.

New Meaning

For me, fighting the Fed right now would mean trying to buy stocks in the face of tightening monetary policy.

Instead of taking on that risk, I am starting to look for more ways to go with the market flow.

After all, the Nasdaq made a new year-to-date low this week, indicating that this bear market is not over yet.

Therefore, on today’s Watchlist, I’m including just one bullish idea and two bearish ideas.

Both technically and from a fundamental perspective, I think we’ll have more success trading with the Fed rather than against it.

With that in mind, let’s get right to our newest ideas…

Jackson Financial Inc.

Jackson Financial Inc. (JXN) is a $3.7 billion financial planning firm showing huge growth in both sales and earnings.

Here’s how the chart is setting up…

Daily Chart of Jackson Financial Inc. (JXN) — Source: TradingView

Here’s how the stock is setting up with my Stealth System…

  • Surge score: 97/100
  • % Above 52-wk low: 98%
  • Sales growth: +170%
  • Return on Equity: 32%
  • Triple momentum: yes

Growth stocks have been hammered over the last six months, but JXN has held up better than most.

It is also a recent initial public offering (IPO), so this would be the first base breakout for the stock.

The stock has compressed nicely with pullbacks shallowing from 25% to just 8%.

I am looking to buy the stock on a break above $44.10 with a stop beneath the swing low at $42.05.

MaxLinear, Inc. (Short Idea)

MaxLinear, Inc. (MXL) is a $3.9 billion semiconductor company focused on communications chips.

Here’s how the chart is setting up…

Daily Chart of MaxLinear, Inc. (MXL) — Source: TradingView

Here’s how the stock is setting up with my Stealth System…

  • Surge score: 77/100
  • % Above 52-wk low: 59%
  • Sales growth: +26%
  • Return on Equity: 49%
  • Triple momentum: yes (short)

This stock was a big winner in 2020 and 2021, climbing over 800% in less than two years.

But the bullish run appears to be over.

Shares have rolled over hard, making a decisive break of the 200-day moving average and plummeting to new lows.

The stock popped up on earnings last week, but I would use this as an opportunity to sell the stock short.

Try to sell near the $50 level and use the 200-day moving average as your stop loss.

RH (Short Idea)

RH (RH), also known as Restoration Hardware, is an $8.5 billion luxury home furnishings retailer.

Here’s how the chart is setting up…

Daily Chart of RH (RH) — Source: TradingView

Here’s how the stock is setting up with my Stealth System…

  • Surge score: 18/100
  • % Above 52-wk low: 8%
  • Sales growth: +11%
  • Return on Equity: 95%
  • Triple momentum: yes (short)

Restoration Hardware is getting destroyed.

It’s down more than 50% over the last six months, with no sign of coming back to life.

So far, RH has found support at the $320 level.

But it has been tested four times so far, and I don’t expect it to survive a fifth test.

If the stock makes new lows, this would be a good short opportunity.

I would use the 50-day moving average as my initial stop and then bring it down as the trade moves lower.

Join the Insiders

Now, if you’ve ever wondered how I developed a proven track record of trading along the insiders like corporate CEOs, CFOs, executives and board members…

Do yourself a favor and check out my latest Insider Effect presentation!

Corporate insiders are always buying or selling shares in the companies they operate. These folks have a footing of knowledge that Main Street investors simply do not.

I talked more about this in my latest presentation, which you can watch at your convenience right here.

I covered my strategy for trading alongside corporate insiders and generating potentially massive gains as a result.

Just click here to learn more about my Insider Effect strategy and see what you could be missing out on.

Live Coaching Session

Monday, at 3:00 p.m. EDT, we’ll be hosting our regular weekly coaching session for Stealth Trades. 

We’ll send you a login reminder that morning, just so you don’t forget.

We’ll cover all of our new stocks on the Watchlist as well as the rest of the stocks inside Stealth Trades.

You need to attend this session to get the most from your subscription!

In the meantime, you can watch the replay of our latest Stealth Trades session right here.

Best wishes for your trading,

Ross Givens

Editor, Stealth Trades
P.S. Click here to learn more about my Insider Effect strategy and see what you could be missing out on.

Weekly Update: Take the Gain in Alpha Metallurgical Resources & Next Week’s Watchlist

The major indexes came under further pressure this week.

While Tuesday brought a nice rally for stocks, Thursday and Friday’s sessions were downright ugly.

The S&P 500 fell 1.5% and 1.7% those days, while the Nasdaq 100 dropped 2% and 1.5%, respectively.

The Russell 2000 was hit even worse, with declines of 2.3% and 1.8%.

All three indexes are below their major moving averages, which is not a good sign.

Furthermore, the S&P 500 Volatility Index (VIX), commonly known as the market’s “fear gauge,” has jumped sharply to the 25 level.

That’s the highest level since mid-March, which shows that traders are becoming more fearful of tighter monetary policy and higher interest rates.

However, there are still stocks out there that are bucking the bearish trend.

And there are other segments of the market, such as real estate investment trusts (REITs), that could thrive in a higher interest rate environment.

These are the types of stocks I’m bringing you in this week’s Watchlist.

The Latest Stealth Winner

Before we get to this week’s Watchlist stocks, I want to call out a recent winning trade in Alpha Metallurgical Resources (AMR).

I first told you about this idea on April 1, and we entered the position at $140 on April 12 per the Trade Tracker.

After a nice, quick move to the upside, we sold half at $163.50 for a 16.80% gain in just a few days.

We then raised the stop to breakeven on the rest, which got hit yesterday for no loss on the second half.

The average exit was $151.75, which equates to a solid gain of 8.39% on the full trade. 

Congratulations on a great win!

Now, on to our newest Watchlist ideas…

ePlus inc.

ePlus inc. (PLUS) is a $1.6 billion information technology (IT) company focused on optimizing IT and supply chain processes for a variety of industries.

Here’s how the chart is setting up…

Daily Chart of ePlus inc. (PLUS) — Source: TradingView

And here’s how the stock is setting up with my Stealth System…

  • Surge score: 92/100
  • % Above 52-wk low: 38%
  • Sales growth: +16%
  • Return on Equity: 16%
  • Triple momentum: yes

PLUS is a growth stock. As such, it made a good-sized correction at the beginning of this year.

But it is now coming out of a “cup with handle” pattern on good volume.

Moreover, the stock not only held up during the Thursday selloff but actually advanced.

Any stock that can break out and hold under that much selling pressure could see a substantial move higher under better conditions.

I like PLUS near the $58 pivot level with a sell stop at $53.65.

Xenon Pharmaceuticals Inc.

Xenon Pharmaceuticals Inc. (XENE) is a $1.7 billion biotechnology company focused on treating neurological disorders.

Here’s how the chart is setting up…

Daily Chart of Xenon Pharmaceuticals Inc. (XENE) — Source: TradingView

And here’s how the stock is setting up with my Stealth System…

  • Surge score: 96/100
  • % Above 52-wk low: 129%
  • Sales growth: -27%
  • Return on Equity: N/A
  • Triple momentum: yes

XENE has been on the Watchlist for two weeks now but has yet to break out.

I’m staying patient with this one since larger base patterns like this often lead to the largest breakout moves.

This is a clinical-stage biotech stock, so fundamentals like sales and earnings aren’t much help in evaluating the trade.

But the technicals still look great.

After a big jump in October on positive Phase 2 trial results for its epilepsy drug, shares have consolidated in a tightening pattern from left to right.

Consider buying if the stock breaks above $35.70 on good volume.

AvalonBay Communities, Inc.

AvalonBay Communities, Inc. (AVB) is a $35.4 billion real estate investment trust (REIT) operating 278 apartment communities consisting of 81,803 total units.

Here’s how the chart is setting up…

Daily Chart of AvalonBay Communities, Inc. (AVB) — Source: TradingView

And here’s how the stock is setting up with my Stealth System…

  • Surge score: 88/100
  • % Above 52-wk low: 35%
  • Sales growth: +8%
  • Return on Equity: 9%
  • Triple momentum: yes

REITs like AvalonBay are attractive investments here since interest rates and inflation are on the rise.

Landlords across the country are raising rents due to rising prices.

With loans already in place at lower fixed interest rates, expenses should remain the same while revenues increase.

This will also create an additional barrier to entry since new landlords would have to finance their purchases at much higher rates.

Consider buying AVB on a move to new highs with a stop at $242.00 for a 6% risk on the trade.

Join the Insiders

Now, if you’ve ever wondered how I developed a proven track record of trading along the insiders like corporate CEOs, CFOs, executives and board members…

Do yourself a favor and check out my latest Insider Effect presentation!

Corporate insiders are always buying or selling shares in the companies they operate. These folks have a footing of knowledge that Main Street investors simply do not.

I talked more about this in my latest presentation, which you can watch at your convenience right here.

I covered my strategy for trading alongside corporate insiders and generating potentially massive gains as a result.

Just click here to learn more about my Insider Effect strategy and see what you could be missing out on.

Live Coaching Session

Monday, at 3:00 p.m. EDT, we’ll be hosting our regular weekly coaching session for Stealth Trades. 

We’ll send you a login reminder that morning, just so you don’t forget.

We’ll cover all of our new stocks on the Watchlist as well as the rest of the stocks inside Stealth Trades.

You need to attend this session to get the most from your subscription!

In the meantime, you can watch the replay of our latest Stealth Trades session right here.

Best wishes for your trading,

Ross Givens

Editor, Stealth Trades

P.S. On Tuesday, April 26 at 1 P.M. ET, we’re unveiling a new futures trading system…

Click here, to sign up for the upcoming event: Futures Trading Summit.

Weekly Update: Where the Rubber Meets the Road

The major indexes remain under pressure.

While last week I told you that there was some improvement in the technical picture, with the S&P 500 above its 50- and 200-day moving averages, it is now back below them again.

The Nasdaq 100 and Russell 2000 are below their respective moving averages as well.

We are now at the point where the rubber meets the road.

Either the heavy buying we saw off of the recent lows will return, confirming stocks are back in a bull market…

Or this was simply a prolonged bear market bounce and the markets revisit those lows, which is very possible.

What’s Working

Several of our Stealth Trades positions are working well.

This includes the most recent official alert for Alpha Metallurgical Resources, Inc. (AMR) that went up 7% the first day and is now higher by nearly 12% since the breakout.

Five of our six open Alpha Stocks trades are also showing profits.

Still, inflation continues to reveal itself as worse than expected, which is worrisome since it increases the likelihood that the Federal Reserve will raise rates more aggressively.

As regular readers know, higher interest rates are bad for stocks and vice versa.

The second half of April will tell us if the market has already priced in the inflation and rate-hike issue or if things are going to get worse for stocks before they get better.

In the meantime, we’re sticking with our usual strategy of finding fundamentally strong stocks pushing up against clearly defined pivot levels…

First Majestic Silver Corp.

First Majestic Silver Corp. (AG) is a $3.7 billion Canadian mining company primarily focused on silver and gold production.

Here’s how the chart is setting up…

Daily Chart of First Majestic Silver Corp. (AG) — Source: TradingView

And here’s how the stock is setting up with my Stealth System…

  • Surge score: 88/100
  • % Above 52-wk low: 52%
  • Sales growth: -27%
  • Return on Equity: N/A
  • Triple momentum: yes

From a fundamental perspective, analysts are forecasting record earnings for First Majestic in 2022 and another 97% increase in 2023.

Technically speaking, AG stock has basically gone nowhere for the last two years.

However, it is now setting up in a classic “cup with handle” pattern.

Price action has tightened nicely and formed a pivot area at $14.50.

Consider buying if that price is hit and use $13.40 as a stop.

Xenon Pharmaceuticals Inc.

Xenon Pharmaceuticals Inc. (XENE) is a $1.8 billion biotechnology company focused on treating neurological disorders.

I added this stock to the Watchlist last week. It has not yet triggered, but the setup still looks good.

Here’s how the chart is setting up…

Daily Chart of Xenon Pharmaceuticals Inc. (XENE) — Source: TradingView

And here’s how the stock is setting up with my Stealth System…

  • Surge score: 96/100
  • % Above 52-wk low: 129%
  • Sales growth: -27%
  • Return on Equity: N/A
  • Triple momentum: yes

Xenon is a clinical-stage biotech stock, so fundamentals like sales and earnings aren’t much help in evaluating the trade.

However, the technical picture still looks great.

After a big jump in October on positive Phase 2 trial results for its epilepsy drug, shares have consolidated in a tightening pattern from left to right.

Consider buying if the stock can make new highs on good volume.

Fluor Corporation

Fluor Corporation (FLR) is a $4.2 billion construction and maintenance services company focused on the oil and gas, chemical and mining industries.

And all of these industries are booming right now.

Here’s how the chart is setting up…

Daily Chart of Fluor Corporation (FLR) — Source: TradingView

And here’s how the stock is setting up with my Stealth System…

  • Surge score: 97/100
  • % Above 52-wk low: 109%
  • Sales growth: -3%
  • Return on Equity: 12%
  • Triple momentum: yes

High oil prices generally lead to increased drilling, and Flour stands to benefit from that.

Analysts appear to agree with consensus estimates calling for 35% earnings growth in each of the next two years.

From a technical perspective, the volume footprint shows signs of institutional accumulation.

Heavy buying for a week straight in early March propelled the stock higher, and it has now consolidated with minimal pullbacks.

I think you can buy FLR here at $30.00 and work a stop at $28.00 for protection.

Join the Insiders

Now, if you’ve ever wondered how I developed a proven track record of trading along the insiders like corporate CEOs, CFOs, executives and board members…

Do yourself a favor and check out my latest Insider Effect presentation!

Corporate insiders are always buying or selling shares in the companies they operate. These folks have a footing of knowledge that Main Street investors simply do not.

I talked more about this in my latest presentation, which you can watch at your convenience right here.

I covered my strategy for trading alongside corporate insiders and generating potentially massive gains as a result.

Just click here to learn more about my Insider Effect strategy and see what you could be missing out on.

Live Coaching Session

Monday, at 3:00 p.m. EDT, we’ll be hosting our regular weekly coaching session for Stealth Trades. 

We’ll send you a login reminder that morning, just so you don’t forget.

We’ll cover all of our new stocks on the Watchlist as well as the rest of the stocks inside Stealth Trades.

You need to attend this session to get the most from your subscription!

In the meantime, you can watch the replay of our latest Stealth Trades session right here.

Best wishes for your trading,

Ross Givens
Editor, Stealth Trades