Editor’s Note: All major U.S. stock markets are closed Monday, Sept. 5, in observance of Labor Day, so we will NOT be hosting a live coaching session that day. I look forward to seeing you again next Monday, Sept. 12!
As expected, last Friday’s heavy selling carried into this week.
As of Friday morning, the S&P 500 is down just over 2% for the week.
But I did see signs of recovery on Thursday…
After starting the day lower, stocks were able to recover their losses and end the day in positive territory.
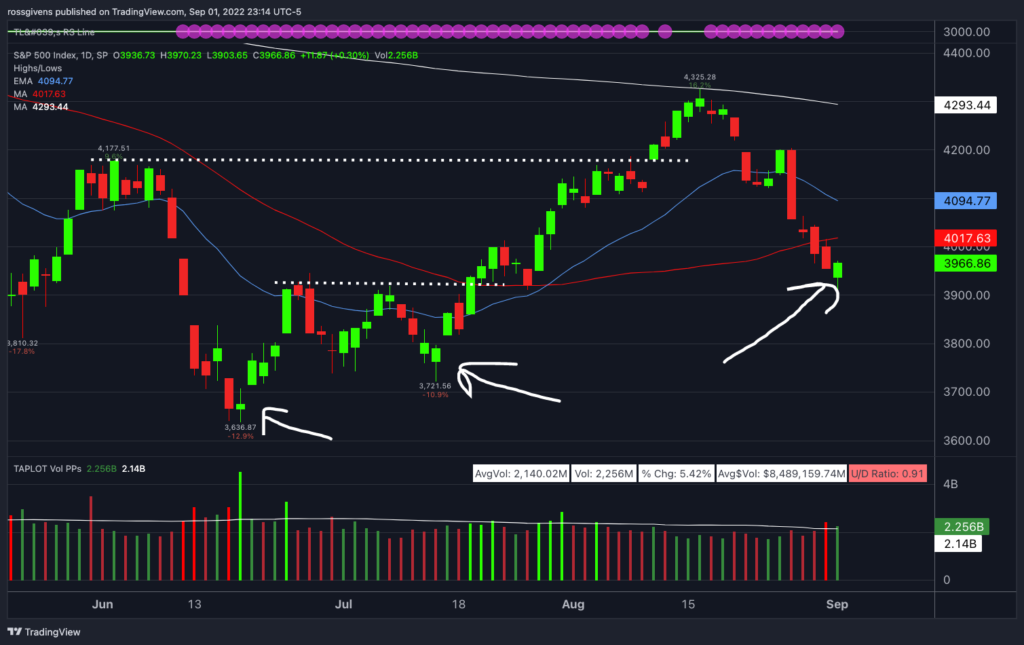
This is known as an “upside reversal day,” and it is one of my favorite tricks for buying on pullbacks.
End the Downtrend?
An upside reversal day is when a stock or index makes a new low but manages to recover and finish the session up on the day.
I have pointed out the upside reversal day on Thursday as well as two previous examples in the chart below…
Daily Chart of S&P 500 Index with Upside Reversal Days – Source: TradingView
We often see this kind of action when a downtrend is coming to an end.
(Side note: Watch for these in individual stocks as well, as it often signals the end of a downturn.)
And for the indexes, this level would also make sense as the low.
The Nasdaq, represented by the Invesco QQQ Trust (QQQ) below, had a hard time breaking through this area back in July when the market was bottoming.
As regular readers know, past resistance areas often become new support areas, and it seems to be holding so far.
Daily Chart of Invesco QQQ Trust (QQQ) with Resistance & Support – Source: TradingView
As we know, anything can happen in the market…
Federal Reserve Chairman Jerome Powell could open his big mouth again and tank the market without warning.
Or stocks could surge on any sign of hope.
Stealth Trades Watchlist
Going forward, your Weekly Updates will look a lot more like this one…
They’ll include more information on our current stock recommendations and put less of a focus on our weekly Watchlist.
Now, if you’ve ever wondered how I developed a proven track record of trading along the insiders like corporate CEOs, CFOs, executives and board members…
Do yourself a favor and check out my latest Insider Effect presentation!
Corporate insiders are always buying or selling shares in the companies they operate. These folks have a footing of knowledge that Main Street investors simply do not.
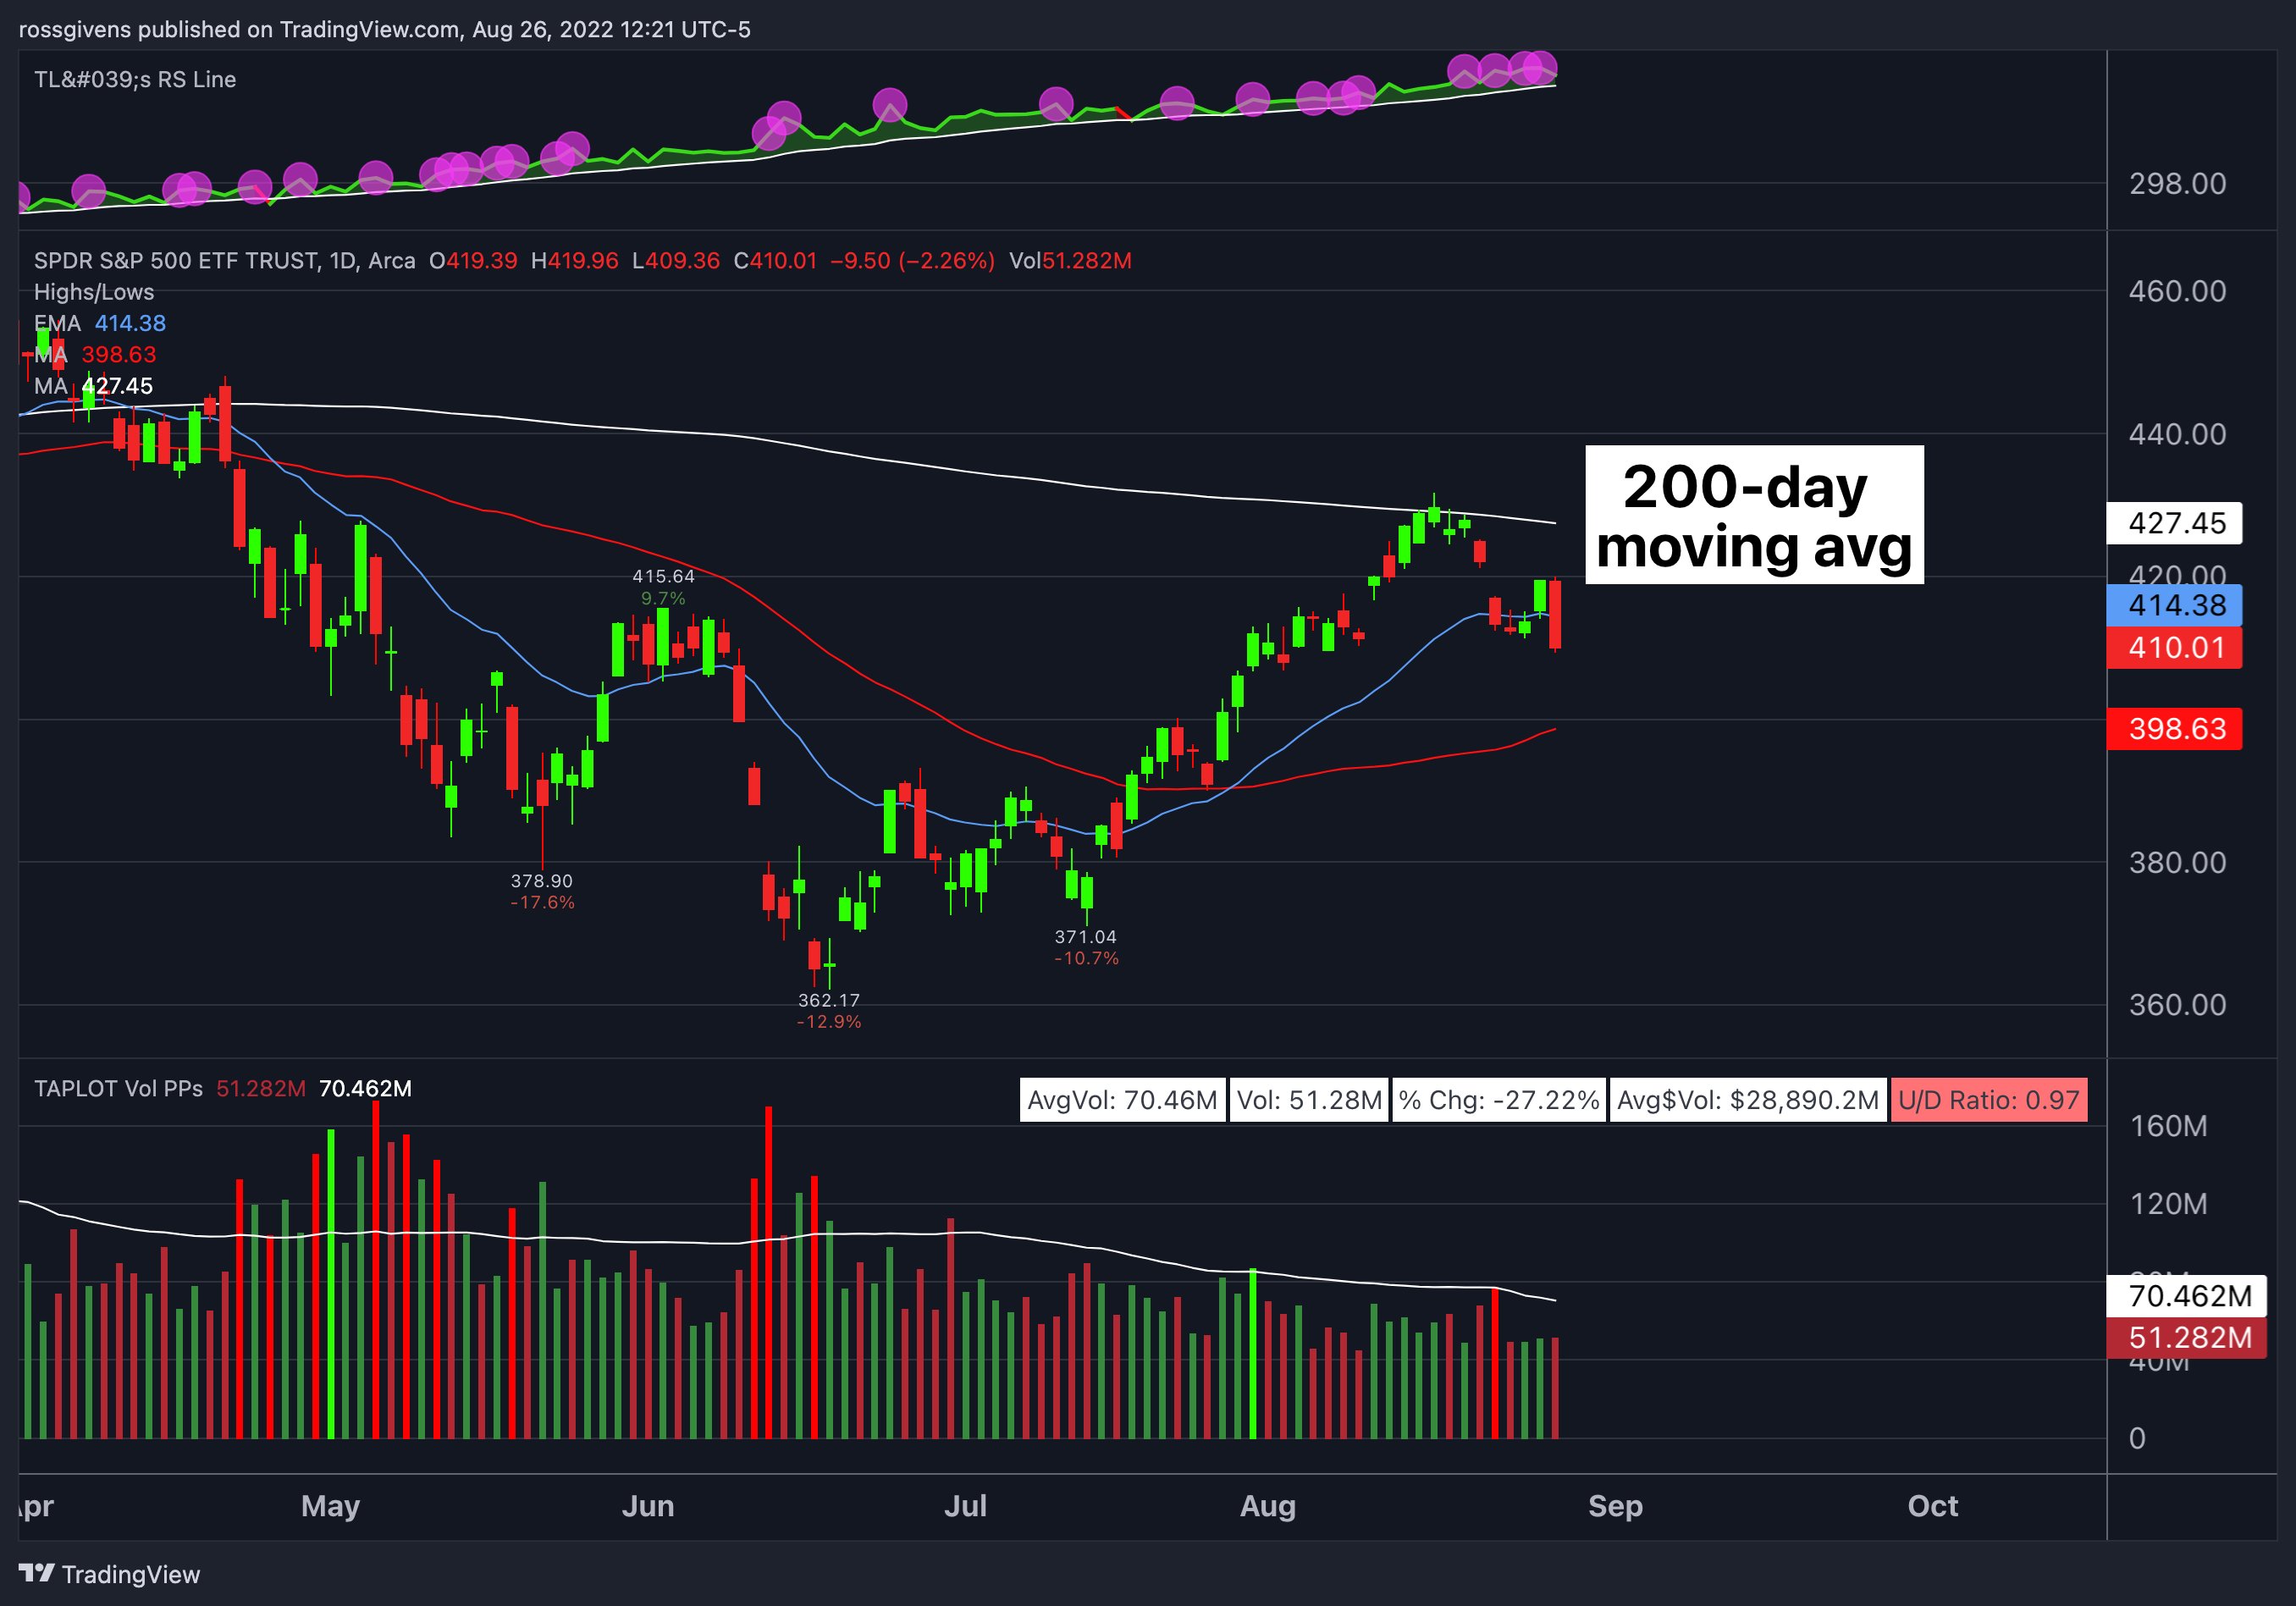
The S&P 500, represented by the SPDR S&P 500 ETF Trust (SPY) above, has now pulled back 5% from its August high and could fall a few percentage points more.
Portfolio Review
This does not change my stance on the market…
I believe the low is in and that we are in the early stages of a new bull market.
Now, if you’ve ever wondered how I developed a proven track record of trading along the insiders like corporate CEOs, CFOs, executives and board members…
Do yourself a favor and check out my latest Insider Effect presentation!
Corporate insiders are always buying or selling shares in the companies they operate. These folks have a footing of knowledge that Main Street investors simply do not.
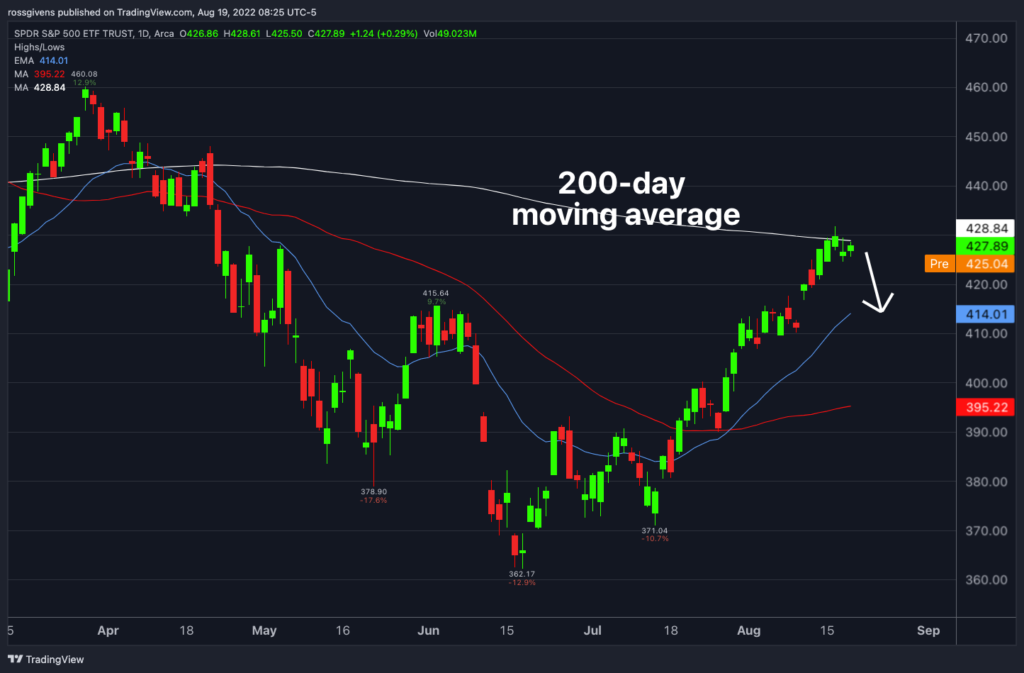
The 200-day moving average is a big level for both short- and long-term traders.
It is the most respected moving average, and you will often see it serve as support or resistance for both individual stocks and the major indexes.
The market has rallied hard since late July, so it is only natural to expect some profit-taking and for stocks to take a breather.
We have not seen this yet, but don’t be surprised if we get a negative week or two from here.
Too Far Too Fast?
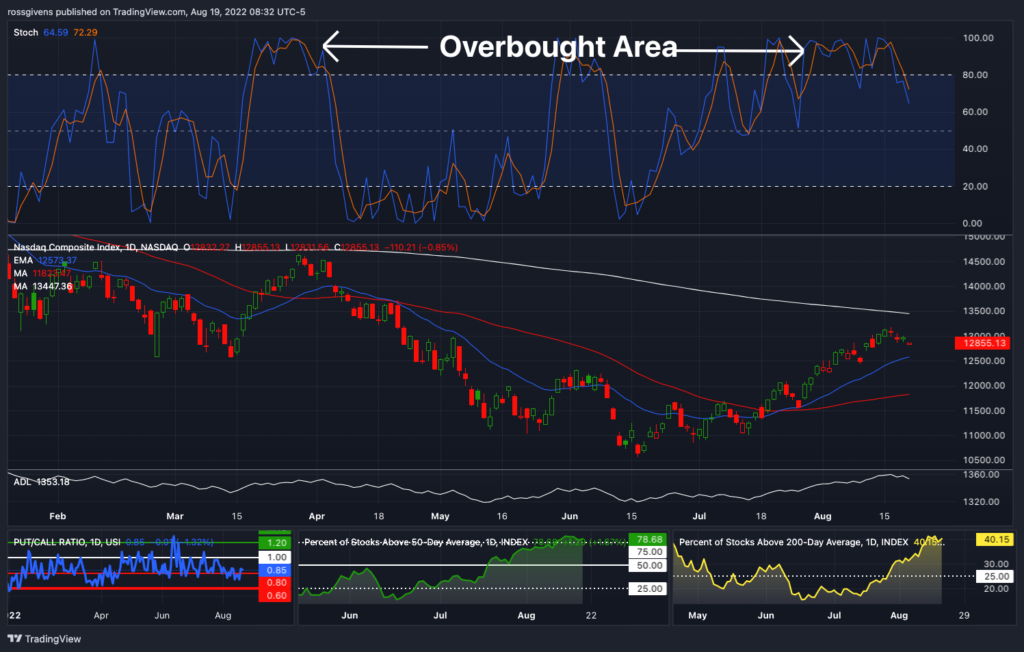
The stochastic indicator helps to identify when the market is “overbought” or “oversold.”
A reading below 20 signals that stocks may be oversold in the short term and likely to bounce higher, while readings above 80 indicate overbought conditions.
Daily Chart of Nasdaq Composite Index with Stochastic Indicator – Source: TradingView
While stocks can remain oversold in a bear market and overbought in a strong bull market, we still want to remain aware of where we are trading.
Several weeks of overbought levels are another indication that we could see a short-term decline sooner rather than later.
To be honest, I would welcome a small pullback…
This will give traders a chance to get into some of the stronger areas like solar and medical stocks that have surged past their optimal buy points in recent weeks.
And unless we see signs of heavy institutional selling, I will continue to focus on stocks to buy.
Portfolio Review
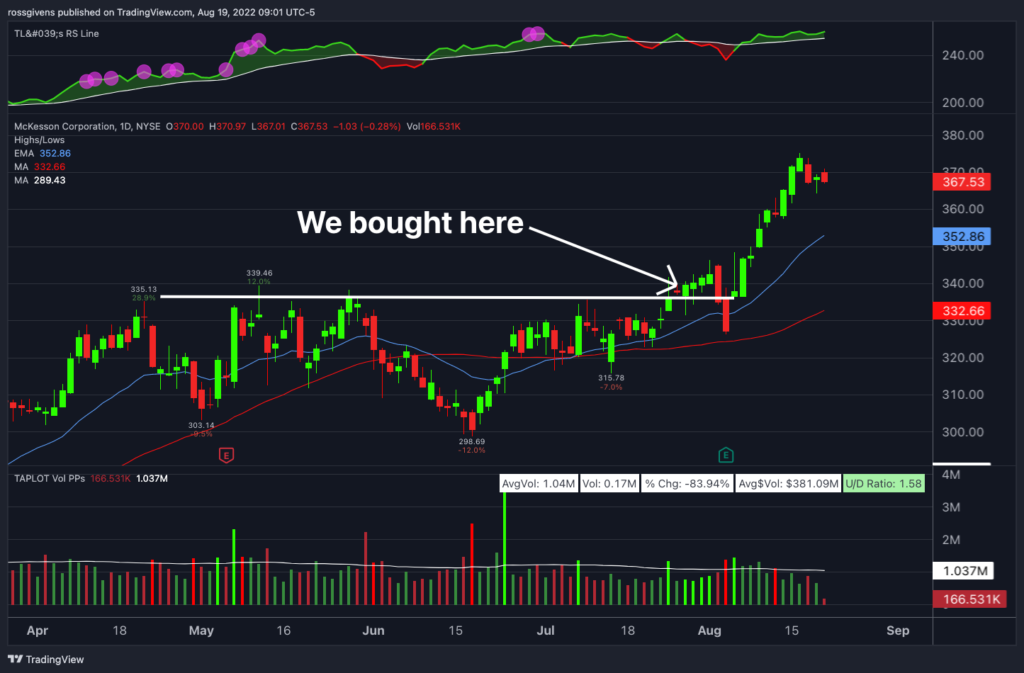
Our open position in McKesson Corporation (MCK) still looks very strong.
Daily Chart of McKesson Corporation (MCK) – Source: TradingView
Per Monday’s text alert, I recommended taking partial profits and raising the stop to breakeven.
We now have a risk-free trade with a guaranteed profitable outcome.
I am watching several other stocks and plan on getting another official Stealth Trades alert out next week…
Stay tuned to your inbox for that!
Stealth Trades Watchlist
Going forward, your Weekly Updates will look a lot more like this one…
They’ll include more information on our current stock recommendations and put less of a focus on our weekly Watchlist.
Now, if you’ve ever wondered how I developed a proven track record of trading along the insiders like corporate CEOs, CFOs, executives and board members…
Do yourself a favor and check out my latest Insider Effect presentation!
Corporate insiders are always buying or selling shares in the companies they operate. These folks have a footing of knowledge that Main Street investors simply do not.
The major indexes tacked on gains this week, as the most recent consumer price index (CPI) numbers showed that inflation is slowing.
I pointed out a few weeks ago how commodity prices and other input prices were falling, which would lead to slowing inflation as they worked their way through the supply chain.
I also showed you the internal market metrics that led me to believe stocks have bottomed and we are at the start of a new bull market.
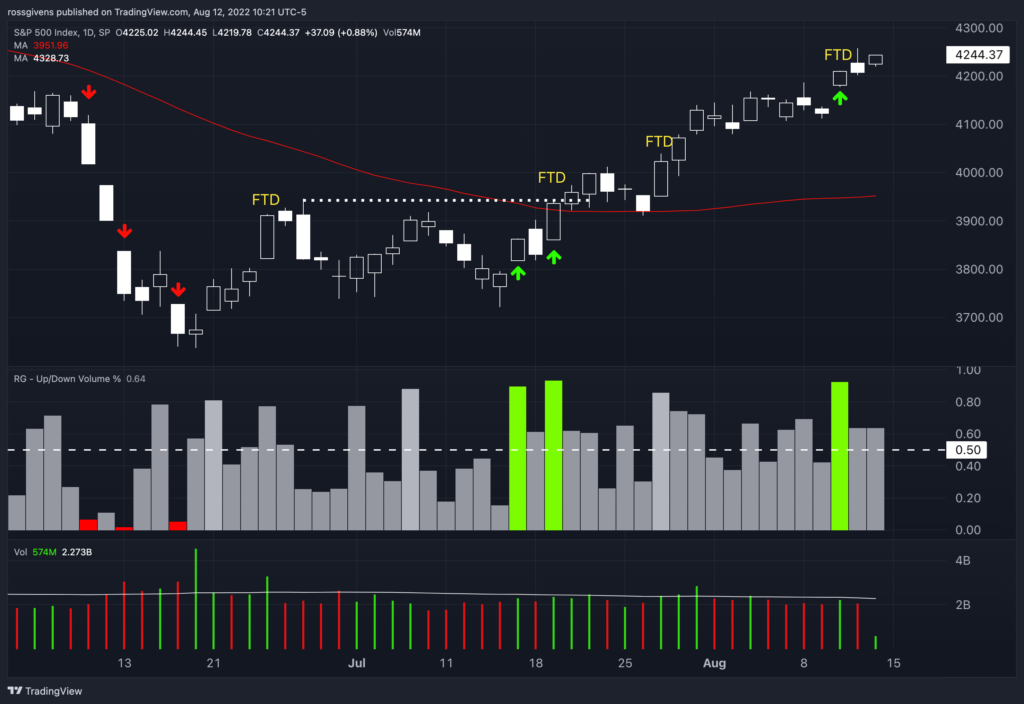
One of those bullish indicators is the 90% up-day.
I like to look for days in which more than 90% of trading volume was advancing.
Historically, these days signal a reversal in the market as large institutional investors pile into stocks. We saw two of them in late July, represented by the green arrows on chart below.
Daily Chart of S&P 500 Index – Source: TradingView
And we saw another one on Wednesday after the CPI report was released.
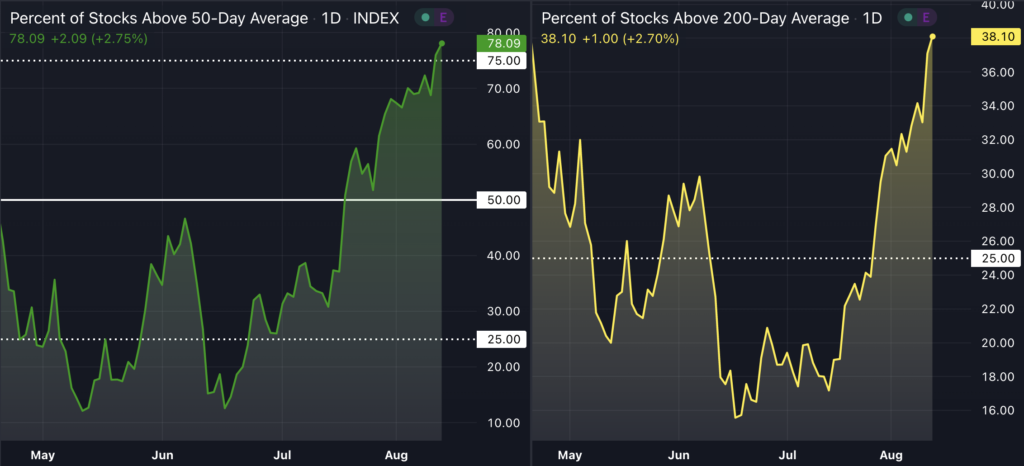
The number of stocks above their 50- and 200-day moving averages continues to increase as well.
Percentage of Stocks above 50-day (left) and 200-day (right) Moving Average – Source: TradingView
From a technical perspective, the S&P 500 and Nasdaq are both approaching their 200-day moving averages.
This is a key level for any stock or index that often serves as support when trading above it and resistance when trading below it.
We have not seen a significant pullback in over a month, so don’t be surprised if we get one there.
Portfolio Review
Our official Stealth trade in McKesson Corporation (MCK) continues to play out nicely.
Daily Chart of McKesson Corporation (MCK) – Source: TradingView
The stock is now up roughly $25 per share, or 7.5%, from where we recommended buying last month.
Our latest trade in Intra-Cellular Therapies, Inc. (ITCI), on the other hand, was stopped out earlier today at the $54 stop level.
This trade made an initial move above $60 per share last Friday but was unable to hold above that level.
Today, it broke through its 50-day moving average and eventually triggered our stop for a loss of 9.9%.
Stealth Trades Watchlist
Going forward, your Weekly Updates will look a lot more like this one…
They’ll include more information on our current stock recommendations and put less of a focus on our weekly Watchlist.
Now, if you’ve ever wondered how I developed a proven track record of trading along the insiders like corporate CEOs, CFOs, executives and board members…
Do yourself a favor and check out my latest Insider Effect presentation!
Corporate insiders are always buying or selling shares in the companies they operate. These folks have a footing of knowledge that Main Street investors simply do not.
The major indexes held their ground this week. As of Friday morning, the S&P and Nasdaq were both trading near the same level they closed the week before.
Markets avoided any major selling days, and volume is picking up slightly as we approach the end of summer, which has historically seen lighter action.
Stocks posted net new highs each day, and the percentage of names above their 50- and 200-day moving averages continues to rise.
Percentage of Stocks above 50-day (left) and 200-day (right) Moving Average – Source: TradingView
The solar energy and biotech sectors are currently leading as the top performers.
Solar, in particular, made a big move over the last few weeks…
Enphase Energy, Inc. (ENPH) is now up 37% from the $220 pivot point I identified on July 22.
Daily Chart of Enphase Energy, Inc. (ENPH) – Source: TradingView
Two other Watchlist stocks from last week, Ionis Pharmaceuticals, Inc. (IONS) and Otter Tail Corporation (OTTR), also made nice moves from their breakout points…
Daily Charts of Ionis Pharmaceuticals, Inc. (IONS) and Otter Tail Corporation (OTTR) – Source: TradingView
But with solar getting a bit extended, I will be focusing on the biotech sector this week.
Portfolio Review
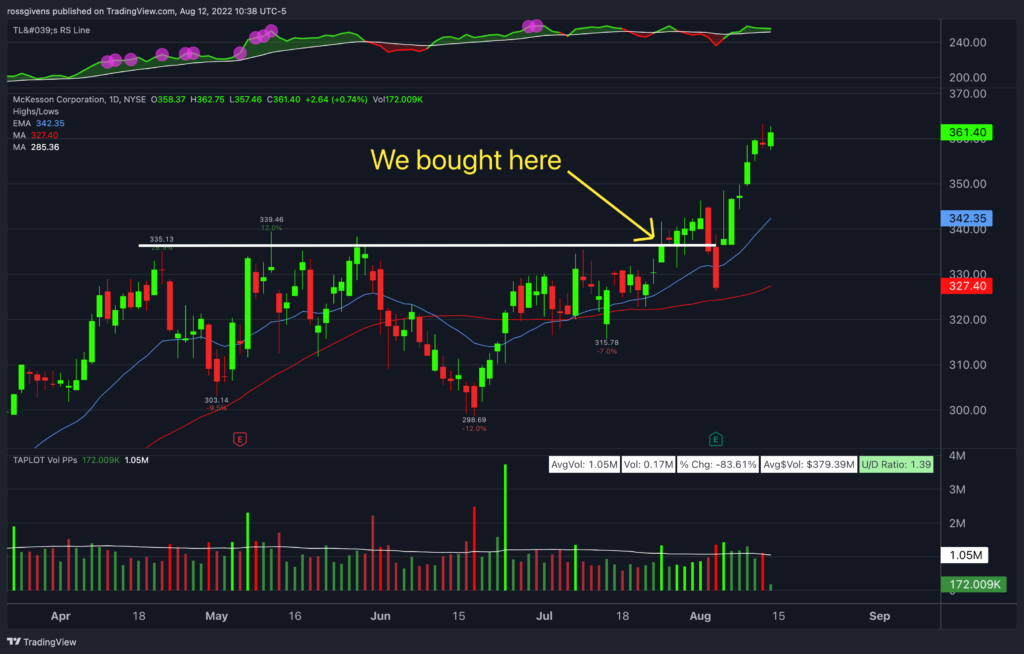
I also want to review our open trade in McKesson Corporation (MCK).
I issued a buy recommendation for MCKon July 27, and we recorded an official entry price of $336.73 in our portfolio.
After initially moving higher, shares pulled back a bit after earnings.
Daily Chart of McKesson Corporation (MCK) – Source: TradingView
What’s important, however, is how a stock responds to bad news…
In this case, shares quickly recovered and made new highs the following day.
This is a good sign of strength.
Our stop remains at $315.70. If you are risk-averse and want to tighten that up, you could move your stop loss up to $326.10 – just beneath the low of the earnings dip.
This would cut your risk from 6% down to 3% on the trade.
Still, I am going to leave our official stop in place at $315.70 in order to give the trade room to breathe.
Stealth Trades Watchlist
Going forward, your Weekly Updates will look a lot more like this one…
They’ll include more information on our current stock recommendations and put less of a focus on our weekly Watchlist.
Now, if you’ve ever wondered how I developed a proven track record of trading along the insiders like corporate CEOs, CFOs, executives and board members…
Do yourself a favor and check out my latest Insider Effect presentation!
Corporate insiders are always buying or selling shares in the companies they operate. These folks have a footing of knowledge that Main Street investors simply do not.
Now, if you’ve ever wondered how I developed a proven track record of trading along the insiders like corporate CEOs, CFOs, executives and board members…
Do yourself a favor and check out my latest Insider Effect presentation!
Corporate insiders are always buying or selling shares in the companies they operate. These folks have a footing of knowledge that Main Street investors simply do not.
I’m elated to announce that my wife gave birth to our daughter this past Sunday.
So far, she seems to be the good luck charm this market desperately needed.
This week, the S&P 500 saw two 90% up volume days, a valid follow-through day and a bullish break of the recent swing high.
It also reclaimed its 50-day moving average.
Daily Chart of S&P 500 Index – Source: TradingView
There were also more stocks making new highs than new lows every day last week.
This was the first time we have seen that since the rally in late March.
Daily Chart of Nasdaq Composite Index – Source: TradingView
None of these factors equate to a guarantee that stocks will go up from here…
But when all of my internal indicators fire to the long side in the same week, I start buying.
So, I have increased exposure in my personal accounts.
Based on how those trades work out, I will either bump my size up again if the trades make money on the whole or go back down to quarter size if they don’t.
Join Me on Monday
Before we get to this week’s Watchlist, I want to remind you to join me on Monday afternoon for our Stealth Trades Live Class at 3:00 p.m. ET…
I’m going to outline our plans for trading during this rally, and we’ll take a look at our Watchlist stocks and other potential ideas in more detail.
In the meantime, here are the three top trades I’m watching this week…
Enphase Energy, Inc. (Long Idea)
I have been talking about the strength in solar stocks for several weeks now, and Enphase Energy, Inc. (ENPH) is one of my favorites.
Daily Chart of Enphase Energy, Inc. (ENPH) – Source: TradingView
Surge score: 98/100
% Above 52-wk low: 93%
Sales growth: +46%
Return on Equity: 74%
Triple momentum: yes
The stock is completing a textbook breakout pattern, with volatility compressing as pullbacks have shallowed from left to right.
The pivot area is around $220.
A move above that level has a high probability of leading to a strong move to the upside.
McKesson Corporation (Long Idea)
Despite a hideous bear market in the first half of 2022, McKesson Corporation (MCK) stock has been surging.
Daily Chart of McKesson Corporation (MCK) – Source: TradingView
Surge score: 97/100
% Above 52-wk low: 79%
Sales growth: +12%
Return on Equity: N/A
Triple momentum: yes
Shares are up 34% year-to-date, and most of that move occurred in just the first quarter.
After making new all-time highs, the medical supply company began consolidating in April and now looks ready to break out for another leg higher.
There are definite signs of accumulation in the base, and volume is drying up as price is tightening at the end… Exactly what we want to see.
Consider buying on a move above $336 with a sell stop at $315. This equates to a 6% risk on the trade.
Consolidated Water Co. Ltd. (Long Idea)
Consolidated Water Co. Ltd. (CWCO) is a small-cap company focused on treating and supplying water products to customers in the Cayman Islands, Bahamas and British Virgin Islands.
Daily Chart of Consolidated Water Co. Ltd. (CWCO) – Source: TradingView
Surge score: 97/100
% Above 52-wk low: 61%
Sales growth: +14%
Return on Equity: 2%
Triple momentum: yes
The stock made a powerful move higher in May, advancing 40% in just one month. Shares then pulled back and consolidated in the $14 area.
A look at the volume candles below the chart shows clear signs of accumulation (large buying) and very little selling.
This is a good sign that may point to institutions building large positions in the stock.
Consider buying CWCO on a move above $15.00.
This is a smaller stock with lighter trading volume, so I want to see a large volume spike on the breakout for confirmation.
Don’t Miss My Most Anticipated Event Yet – “Operation: FIRE Trader”
Before I end today’s thoughts, I wanted to tell you about my breakthrough training event I’m putting together next Tuesday.
You see, while the country may seem in shambles at the moment…
There’s still a small group of traders who have consistently used a prophetic trading sequence to help them snatch gains of 941%… 1,379%… and 49,900% in both bull AND bear markets.
And since I’ve personally leveraged this same method to grow my own nest egg…
I’m officially shedding a light on this groundbreaking tool that’s infamously known for being “The #1 Best Performing Trading Strategy of All-Time…”
In fact, based on a 1,012 page white paper study done by expert analysts…
They found that out of 307 different occurrences this sequence occurred in the market… EVERY SINGLE TRADE rose in profit.
This is a HUGE deal…
Which is why, given the circumstances…
Having a dependable and precision accurate strategy in your arsenal is more important than ever.
I’ll be going live on Tuesday, July 26th at 1 p.m. EST to reveal all the shocking details…
Plus, I’ll even show you how you could potentially bank $137k in just five trades.
Again, this is my most anticipated event I’ve ever put on at Traders Agency…
So, you’ll definitely want to make sure you’re there to see all of the evidence I share.
My wife is 39 ½ weeks pregnant, and our little girl could come any second…
So, I’m writing this ahead of the opening bell on Friday to make sure I got this week’s Watchlist done early just in case.
Now, after a strong week to start July, stocks retraced on light volume this week.
In my opinion, the market is trying to form a bottom.
This tends to be a process with movement back and forth as large traders begin covering shorts and gradually increase their exposure on the long side.
Wednesday’s Consumer Price Index (CPI) report showed that inflation made yet another high at 9.1% for the prior 12 months.
The Nasdaq opened lower but recovered by the end of session to close down just 0.14% for the day.
Believe it or not, this is positive…
Silver Linings
The fact that the market can rally or at least hold on amid negative news is a good sign that the market could be nearing the lows.
Additionally, commodity prices continue to come down.
Commodities are the inputs of most final products, so it takes some time for those price reductions to work their way through the supply chain.
But to me, this is a sign that inflation is cooling. Just take a look at these commodity drawdowns from their 52-week highs…
Lumber -58%, Nickel -54%, Aluminum -37%, Natural Gas -31%, Steel -28%, Wheat -28%, Zinc -25%, Lead -23%, Copper -22%, Soybeans -18%, Oil -13%, Orange Juice -11%.
Daily Chart of Invesco QQQ Trust (QQQ) – Source: TradingView
Now, getting back to the Nasdaq, I’ve drawn two horizontal lines on the daily chart above…
Whichever line is hit first will likely lead the next move.
A breakout above the green line should lead to a rally higher, at least for the short term.
A breakdown below the red line, however, should mean new lows and another leg lower for the markets.
Join Me on Monday
Before we get to this week’s Watchlist, I want to remind you to join me on Monday afternoon for our Stealth Trades Live Class at 3:00 p.m. ET…
I’m going to outline our plans for dealing with whatever the market happens to throw at us next, and we’ll take a look at our Watchlist stocks and other potential ideas in more detail.
In the meantime, I have three new trades for you this week, each with classic bullish setups that should lead to higher prices…
Molson Coors Beverage Company (Long Idea)
During Thursday’s “State of the Market” webinar with my colleagues Josh Martinez, Anthony Speciale, I pointed out that the alcoholic beverage sector is coming out of a Stage 1 base and is on the verge of breaking out higher.
Daily Chart of Molson Coors Beverage Company (TAP) – Source: TradingView
Surge score: 96/100
% Above 52-wk low: 39%
Sales growth: +17%
Return on Equity: 7%
Triple momentum: yes
Molson Coors Beverage Company (TAP) is one of the strongest stocks in this sector and currently finishing a 12-month “cup with handle” pattern.
Consider buying here with a stop at $54.10.
MGP Ingredients, Inc. (Long Idea)
Another alcoholic beverage stock that looks even stronger to me is MGP Ingredients, Inc. (MGPI).
Daily Chart of MGP Ingredients, Inc. (MGPI) – Source: TradingView
Surge score: 98/100
% Above 52-wk low: 77%
Sales growth: +80%
Return on Equity: +20%
Triple momentum: yes
The distilled spirit-maker is forming a “base on base” pattern with extremely tight price action over the last two weeks.
The relative strength line is steadily climbing higher even as the broader market chops back and forth.
Consider buying MGPI on a breakout above $103.25 with a stop at $99.05 for a very low-risk trade.
Halozyme Therapeutics, Inc. (Long Idea)
Halozyme Therapeutics, Inc. (HALO) is a biotech stock that has been steadily drifting higher since February.
Daily Chart of Halozyme Therapeutics, Inc. (HALO) – Source: TradingView
Surge score: 97/100
% Above 52-wk low: 50%
Sales growth: +32%
Return on Equity: 169%
Triple momentum: yes
It broke out to new highs on heavy volume on July 7 but has since pulled back to the 21-day moving average.
Traders may consider a pullback buy here with a stop beneath the swing low at $43.40.
Join the Insiders
Now, if you’ve ever wondered how I developed a proven track record of trading along the insiders like corporate CEOs, CFOs, executives and board members…
Do yourself a favor and check out my latest Insider Effect presentation!
Corporate insiders are always buying or selling shares in the companies they operate. These folks have a footing of knowledge that Main Street investors simply do not.
As I write this on Friday morning, the Nasdaq is up roughly 2% for the week.
The S&P 500 recorded four positive days in a row to start the week, and we are beginning to see signs of institutional buying.
Thursday was an 88% up-volume day, meaning 88% of the volume was on the advance.
I’ve been waiting for a 90% up-day to signal that the low is in, and this was darn close…
Daily Chart of S&P 500 Index with Market Breadth & Volume Indicators – Source: TradingView
The same areas of the market I have been highlighting over the last few weeks continue to show strength – mainly biotechnology and solar stocks.
If you took the trade in Chinook Therapeutics, Inc. (KDNY) from last week’s Stealth Trades Watchlist, you should have seen a nice quick gain as the stock surged 13% in just four days.
Alpha Stocks members took the trade and already locked in partial profits.
Stay Cautious
Make no mistake – The market is not out of the woods yet, and this may end up being nothing more than a tradeable rally.
But I have started to increase exposure in my personal account.
If I see decent gains in these pilot positions, I will continue to buy news setups and increase my size accordingly.
Now, take a look at the daily chart of the Invesco QQQ Trust (QQQ) below, which tracks the Nasdaq index…
Daily Chart of Invesco QQQ Trust (QQQ) – Source: TradingView
This week’s positive action prevented the index from making another lower low.
Should it take out the previous week’s high, this downtrend could finally break.
Join Me on Monday
Oil, natural gas, copper and most other commodities have fallen sharply over the last few weeks.
This is potentially a good sign for stocks as it could be a signal that inflation is finally subsiding.
As an investor, it is important to separate the economy from the stock market.
Remember… The market is a discounting mechanism. All assumptions about the macroeconomic picture are largely already priced in.
The market will bottom as soon as signs point to conditions improving. But it typically takes many months or even years before a recession ends.
With that in mind, I hope you’ll join me on Monday afternoon for our Stealth Trades Live Class at 3:00 p.m. ET…
I’m going to be outlining our plan for dealing with a market environment like this, and we’ll take a look at our Watchlist stocks and other potential ideas in more detail.
For now, we are indeed in a tradeable rally, and I have three new long trades to share with you this week…
Sierra Wireless, Inc. (Long Idea)
Sierra Wireless, Inc. (SWIR) is a Canadian designer of wireless and embedded modules, gateways and routers.
Computer networking stocks are not showing strength as a group, but SWIR has a Surge Score of 99/100.
In other words, it is outperforming 99% of stocks.
Earnings and sales were both up big last quarter, and analysts are calling for further growth through 2023.
Daily Chart of Sierra Wireless, Inc. (SWIR) – Source: TradingView
Surge score: 99/100
% Above 52-wk low: 86%
Sales growth: +60%
Return on Equity: N/A
Triple momentum: yes
The chart looks great as well. The up/down volume ratio is incredibly bullish at 1.86, and institutional buyers are flocking to the stock.
SWIR has formed a pivot at the $25 level.
In a perfect world, it would trade sideways here for a few days to absorb any sellers near the highs.
That would make it an even higher conviction buy for me.
But demand for this stock is high. Consider buying on new highs with a 10% stop.
Seagen Inc. (Long Idea)
Seagen Inc. (SGEN) is a biotech that has come ripping off the lows.
Shares are up 70% in just six weeks, with almost no pullbacks along the way.
Daily Chart of Seagen Inc. (SGEN) – Source: TradingView
Surge score: 96/100
% Above 52-wk low: 71%
Sales growth: +28%
Return on Equity: N/A
Triple momentum: yes
At this point, price has been consolidating for almost two weeks near the $180 level.
There is also a fundamental catalyst in play…
Reuters reported that Merck & Co., Inc. (MRK) is in advanced talks to buy Seagen at a price above $200 per share – more than 10% above where it trades today.
Consider buying SGEN above $182 with a stop at $167.
United Therapeutics Corporation (Long Idea)
United Therapeutics Corporation (UTHR) is another biotech stock showing tremendous strength as the general market is coming off its lows.
The stock is just entering Stage 2 and currently trades just 1% off its all-time high.
Price action is tightening, pullbacks are becoming shallow and volume dried up for several days.
This is exactly what we want to see pre-breakout…
Daily Chart of United Therapeutics Corporation (UTHR) – Source: TradingView
Surge score: 97/100
% Above 52-wk low: 51%
Sales growth: +22%
Return on Equity: 20%
Triple momentum: no
The fundamentals are also strong… Unlike many biotech stocks, which have limited revenue and negative earnings, United Therapeutics is showing solid growth in both areas.
Earnings and sales grew by 44% and 22%, respectively, in the most recent quarter.
This stock is a potential market leader that could make a large advance if the market has indeed found the bottom.
Consider buying UTHR here with a stop at $220.
One Last Chance to Join Alpha Stocks
If you’ve been struggling in this wild stock market environment, with the major indexes down double-digits and many of last year’s leading stocks down over 50%…
Consider checking out my Alpha Stocks trading service, which focuses on only the very best stock trading opportunities — both on the long side as stocks rise and on the short side when markets are crashing.
Alpha Stocks recently recorded a 21.6% gain on the downside in only eight days as Pegasystems Inc. (PEGA) stock plunged…
As well as a gain of 21.3% in just 15 days in Permian Basin Royalty Trust (PBT).
Last Wednesday, we closed another winner in ProPhase Labs, Inc. (PRPH) for a two-day gain of 5.8%.
And as I alluded to above, we just closed out another two-day winner on a third of Chinook Therapeutics, Inc. (KDNY) for a gain of 8.4%.
Of course, we also hold a live members-only session every Monday so that subscribers can ask questions and get guidance about our trades.
As I write this on Friday afternoon, the Nasdaq is down 5.6% for the week.
As expected, the recent short-term bounce was a great opportunity to take a few short trades from better entry points.
And if you took the short trade idea in ZIM Integrated Shipping Services Ltd. (ZIM) last week, you are sitting on a hefty profit.
The market failed to post a follow-through day or 90% up volume day last week – key signs I’m waiting for to signal the market may have found the bottom.
We are still seeing more stocks making new lows than new highs. And breakouts to the upside are still meeting selling and mostly reversing lower.
Roundtrip Market
As a trader, this can be extremely frustrating.
For example, here’s a trade we took in my Alpha Stocks service this week…
65-Minute Chart of ProPhase Labs, Inc. (PRPH) – Source: TradingView
We bought ProPhase Labs, Inc. (PRPH) on the breakout at $11.97 per share. The next day, we were up over 17%.
As prudent traders, we took profits on part of the position at the top and raised our stop to breakeven.
That turned out to be the right move, as the stock reversed all the way back over the next two days.
We got out with a nice average gain, but unless you are using very wide stops (which I do not recommend) and taking on a lot of risk, this environment is making it very difficult to hold onto stocks for longer-term moves.
The Big Picture
So, let’s take a step back and look at the big picture…
I’ve found the easiest way to “remove the noise” is to look at a weekly chart rather than a daily or hourly chart.
Weekly Chart of Invesco QQQ Trust (QQQ) – Source: TradingView
The Nasdaq has been unable to get above its 50-day moving average for several months. Even the 200-day has rolled up and is now pointing down.
We have also seen several weeks of high-volume selling, which is a sign that institutions have been dumping stocks en masse.
Until that changes and we begin to see signs of meaningful buying, there is no reason to be aggressively buying or having much exposure.
My personal account has been primarily in cash since November.
I continue to make short-term trades and take small positions here and there, but I have not been more than 25% invested at any point this year.
This is how I have been able to keep drawdowns to a minimum.
Progressive Exposure
I don’t have a crystal ball. Like everyone else, I cannot predict bear markets.
But I do understand “progressive exposure.” It works like this…
Look at your last four to five trades. Did you make money?
If not, cut your trading size in half.
After the next five trades, look at your results. Did you make money?
If not, cut your trade size in half again. If you did, bump it up.
It’s not rocket science. But it’s a powerful technique for minimizing drawdowns and keeping your losses small.
When your trades are not working, you will be trading very small amounts of money and taking very small losses.
When trades are working, you will be trading very large size and therefore having big wins.
Join Me on Monday
If you got into trouble this year and suffered a big drawdown, don’t beat yourself up.
The best money managers in the world have lost billions this year. Tiger Global, one of the top hedge funds in the world, is down by half.
The important thing is to learn from your mistakes. Take the lesson and move on.
With that in mind, I hope you’ll join me on Monday afternoon at 3:00 p.m. ET for our live Stealth Trades session…
I’m going to be outlining our plan for dealing with a market environment like this.
We’ll talk about inflation and how it is impacting the markets we track, and we’ll take a look at our Watchlist stocks and other potential ideas in more detail.
Now, we’re focused on making money in the second half of the year, so here are three trade ideas for this week’s Watchlist to kick off the new quarter and the second half of 2022…
Chinook Therapeutics, Inc. (Long Idea)
I added Chinook Therapeutics, Inc. (KDNY) to the Watchlist last week, and it did not rise enough to hit our buy trigger.
As I mentioned in the previous update, KDNY is a biotech stock coming out of a huge two-year base pattern.
Daily Chart of Chinook Therapeutics, Inc. (KDNY) – Source: TradingView
Surge score: 97/100
% Above 52-wk low: 79%
Sales growth: +671%
Return on Equity: N/A
Triple momentum: yes
This week saw the stock pull back slightly to the 21-day moving average.
This is also a previous breakout level that could hold as support.
Traders could buy the stock here and use a 10% stop below the 50-day moving average.
The Howard Hughes Corporation (Short Idea)
The Howard Hughes Corporation (HHC) stock has been decimated over the last couple of months.
Shares of the real estate developer and manager fell from $105 to a low around $60 in just two months…
Daily Chart of The Howard Hughes Corporation (HHC) – Source: TradingView
Surge score: 26/100
% Above 52-wk low: 105%
Sales growth: +N/A
Return on Equity: N2%
Triple momentum: yes (short)
Shares are seeing a short-term bounce to the 21-day line that should continue to act as resistance.
Consider selling HHC short here near the $70 mark.
Citigroup Inc. (Short Idea)
When looking for breakout stocks to buy, I want the best of the best… Stocks with big earnings growth, big sales growth, bullish forecasts and high relative strength.
Identifying names about to break out lower means we want the opposite… Declining sales and profits, poor relative strength and a clear downtrend on the chart.
Citigroup Inc. (C)checks every box…
Daily Chart of Citigroup Inc. (C) – Source: TradingView
Surge score: 35/100
% Above 52-wk low: 2%
Sales growth: -1%
Return on Equity: 11%
Triple momentum: no
This dumpster fire of a stock has been moving lower for a year now.
It is currently forming a shelf with support at $45.
If it breaks this level and makes a new low, consider going short with a stop at $49.20.
Finding Real Alpha
With the major indexes down double-digits and many of last year’s leading stocks down over 50%, consider checking out my Alpha Stocks trading service.
We recently recorded a 21.6% gain on the downside in only eight days as Pegasystems Inc. (PEGA) stock plunged…
As well as a gain of 21.3% in just 15 days in Permian Basin Royalty Trust (PBT) as that stock broke out of its range.
And this past Wednesday, we closed another winner in ProPhase Labs, Inc. (PRPH) for a two-day gain of 5.8%.
We also get together every Monday for an hour-long live session so that subscribers can ask questions and get guidance about our trades.