Weekly Update: New Bull Market Begins to Find Its Footing

Good evening, and welcome to this week’s edition of Stealth Trades!

As we forecasted in last week’s update, stocks pushed higher this week as a new bull market begins to find its footing.

The downtrend that had become all too obvious was breached, and the index found support at the moving averages.
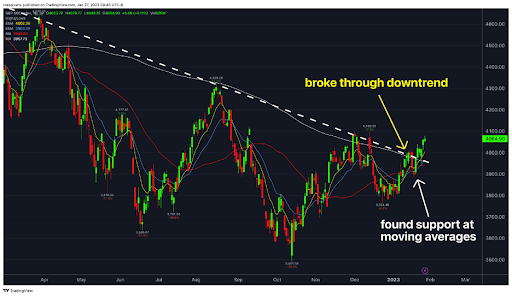
Beneath the surface, things look positive as well.

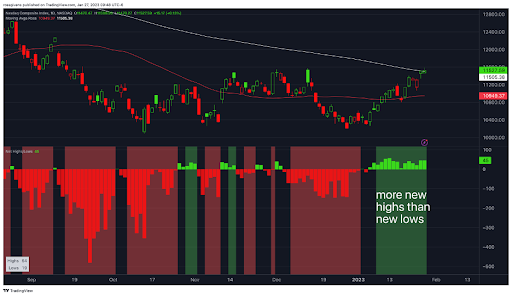
The Nasdaq index has seen more stocks making new highs than new lows for 15 straight days – the longest streak since August.
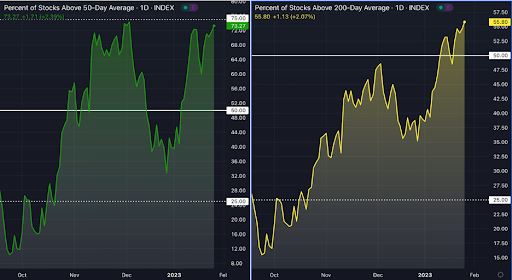
73% of stocks now trade above their 50-day moving average – a proxy I use to determine the short-term trend of stocks.

And 55% trade above their long-term 200-day moving average.
These factors, combined with the Breakaway Momentum signal we got on January 12, leads me to the conclusion that we are in fact at the beginning of a new bull market.

Anything can happen, of course, but I would be surprised if the market is not substantially higher this time next year.

Needless to say, my focus is trading the long side right now and identifying stocks showing the most strength right now.

Here are a few names I’m watching right now:

Icosavax (ICVX)
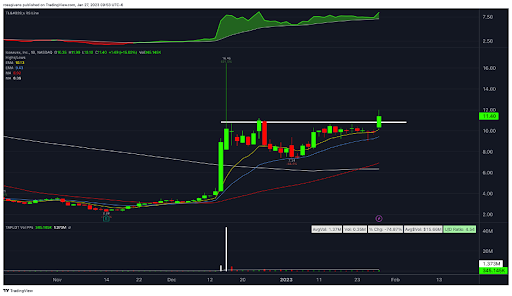
ICVX is a biotech stock showing tremendous strength.

After the company’s respiratory virus vaccine showing promising phase 1 results, shares took off like a rocket.

It then consolidated, putting in a series of shallowing pullbacks as the market digested sellers looking to take profits after the big run up.

The stock never broke below its 21-day moving average and has been holding its 10-day since the start of the year.

Shares broke out Friday morning, triggering us to send a buy recommendation on the stock.

Bilibili (BILI)
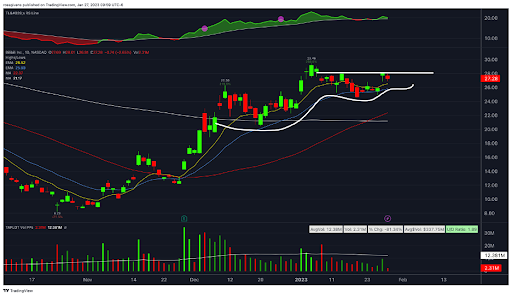
BILI is a Chinese video content company.

After a huge stage 4 decline throughout 2021 and 2022, shares seem to have finally found a bottom.

The stock has tripled off its lows since October and now forming a breakout consolidation pattern.

Notice the series of shallowing retracements over the last two months.

I will consider buying on a move above 28.20 or a pullback to the 21-day EMA near 26.00.

Cooper-Standard Holding (CPS)
The copper market is hot right now, and a lot of the copper mining names are making big moves to the upside.

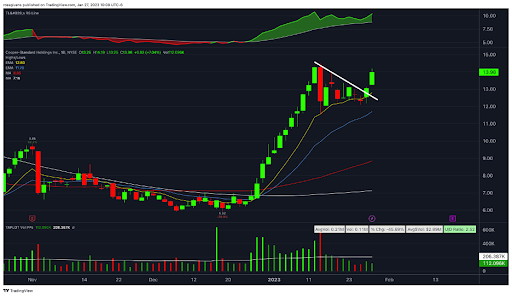
One of the cleanest charts I’ve seen is CPS.

Notice the huge, steady accumulation from late December through mid-January – 13 trading days in a row of higher highs and lower lows.

This is a clear sign of institutional accumulation.

After a brief pullback to its 10-day EMA, the stock is again turning higher.

This looks like the start of a big uptrend in copper.

Best wishes for your trading,

Ross Givens

Editor, Stealth Trades
Weekly Update: S&P 500 Was Down but No Danger Signs Yet

Good evening, and welcome to this week’s edition of Stealth Trades!

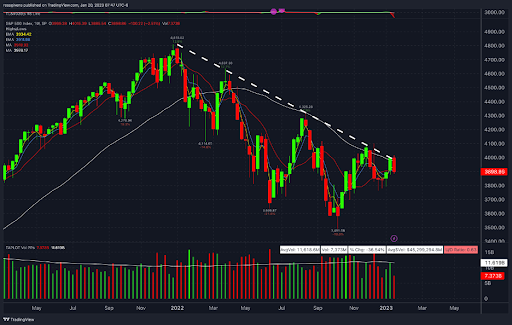
As of Friday morning, the S&P 500 was down roughly 2.4% for the week.

Volume, however, was light, so I don’t see any serious danger yet.

Pullbacks are natural, and forming a bottom is a process of backing and filling near the lows which often forms a rounded bottom pattern.

I remain bullish on stocks and believe we are at the early stages of a new bull market.

Instead, I am using this short-term weakness to identify stocks holding up well that can be bought on pullbacks to key support and moving averages.

Below are a few of the stocks on my radar right now:

United Rentals (URI)

United Rentals is a commercial leasing stock. Industrials and heavy equipment names are one of the leading areas over the last several months, and URI is a top name.

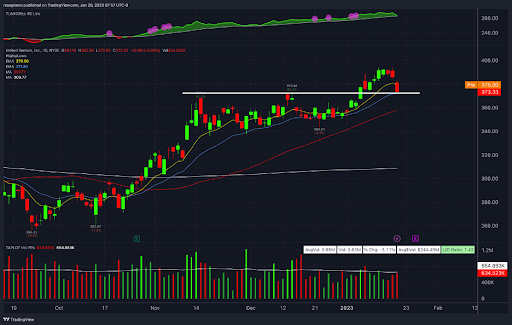
The stock formed a textbook breakout pattern with a shallowing base and resistance near $374.

It was off to a good start but pulled back this week on general market weakness.

Shares are currently retesting the prior breakout level as well as the 21-day moving average (blue line).

A good trending stock should hold its 21-day as URI has since mid-October, so this is a low-risk area to take a stab at this one and take a position off this support level.

Buckle (BKE)

Apparel and retail names like Buckle have also been strong for the last few months.

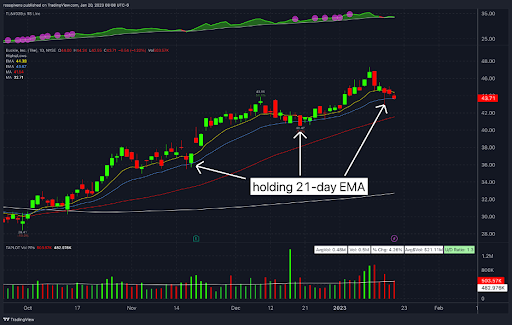
BKE has been holding its 21-day moving average beautifully throughout the entire move.

Shares have now pulled back to it once again and are sitting at the most recent breakout level.

One may consider buying here with a tight 5% stop loss to see if the trend continues.

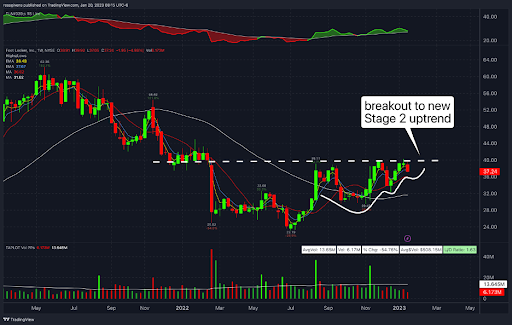
Foot Locker (FL)

One of the best-looking charts in the retail sector belongs to Foot Locker.

Above is a weekly chart to show the full picture.

Notice that FL has been in a Stage 4 decline since early 2021. Shares bottomed this Summer and have slowly formed a rounded bottom to complete a new Stage 1 base.

The stock is now consolidating in a pattern of shallowing retracements just as we like to see.

Resistance is clearly defined at $40 – a key support zone from the end of last year.

A move above this level would trigger my entry for a potential multi-month move higher.

Tactical traders may instead choose to build a smaller position here in the $35-$40 range and add on if and when the stock breaks out.

Best wishes for your trading,

Ross Givens

Editor, Stealth Trades
Weekly Update: Rare 10-day “Breakaway Momentum”

Good evening, and welcome to this week’s edition of Stealth Trades!

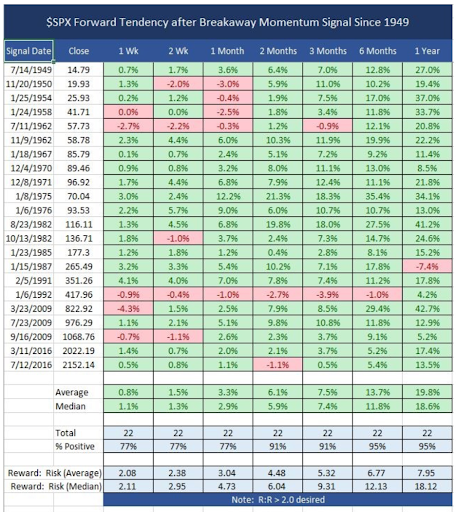
On Thursday, the stock market completed 10-day “breakaway momentum” – a feat seen only 22 times since the 1940s.

Originally studied by famed market technician Walter Deemer, breakaway momentum refers to a 10-day period where the New York Stock Exchange sees stocks advancing at double the rate stocks are declining.

The concept is known as market breadth, and it involves studying the total number of advancing versus declining issues.

Essentially, it means that a whole lot more stocks were going up than going down. This can happen for a day or two. But over a 2:1 ratio over a ten-day period is almost unheard of.

The table below shows the performance of the S&P 500 following each previous occurrence.

Based on this research, the market has a 95% chance of being higher 12 months from today for an average gain of 19.8%.

Again, this is not my research. But Deemer’s work has been instrumental in my own trading, and I have found it to be a great resource for timing the market.

Breakaway momentum, at least historically, is not found before small rallies. It appears only at the start of bull markets.

This is an incredibly bullish sign for stocks.

In light of this powerful signal, I am again focusing on long trades only this week. Here are a few high-flyers I have my eye on:

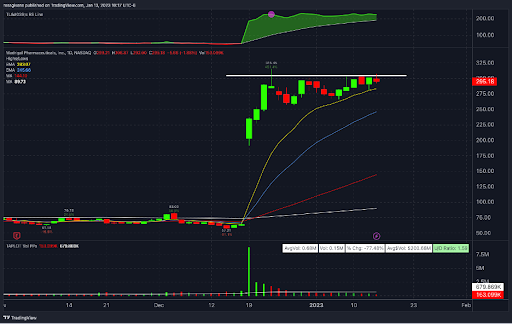
Madrigal Pharmaceuticals (MDGL)

Madrigal made a huge move in December following positive Phase 3 drug trial results.

The stock climbed 424% in just six days.

Shares are now forming a tight base with resistance near $305.

Watch for a breakout higher accompanied by a surge in volume. This could signal another leg higher.

Melco Resorts & Entertainment (MLCO)

Melco owns and operates a handful of luxury resorts, clubs and casinos.

The leisure group has been responsible for a high percentage of super performance stocks in the past, so I’m happy to see a good trending name in this sector.

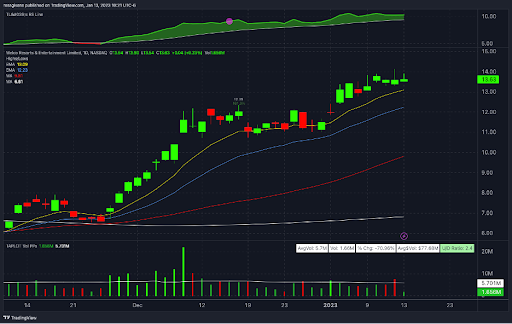
The stock broke out of a consolidation base in late November and hasn’t looked back since. Shares have been holding their 10-day EMA (yellow line) the entire time – a sign of strength for any stock.

I will consider buying on a pullback to the 10-day or a high volume move above $14 per share.

Viking Therapeutics (VKTX)

VKTX is a high-flying biotech stock.

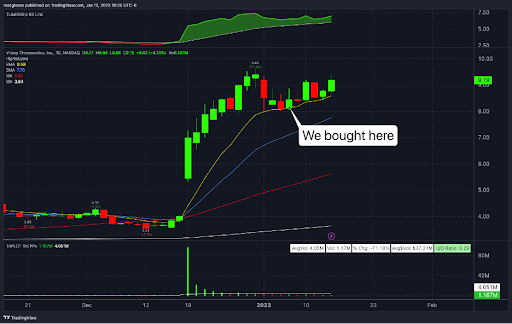
Just as we have seen with other high relative strength names, it is holding above its 10-day moving average in a clear display of power.

I issued an official buy recommendation on this stock to Stealth Trades members on January 6.

Since it is approaching previous highs, we closed out half the position for a 13% gain on the stock and 90% on the call options.

If VKTX can get into new high ground above $10 a share, we could see another strong wave higher.

Best wishes for your trading,

Ross Givens

Editor, Stealth Trades
Weekly Update: New Year… Same Story

Good evening, and welcome to this week’s edition of Stealth Trades!

Well, new year… same story.

After a hideous 2022, stocks started the year off with more selling (shocker, I know).

A small rally on Friday allowed the index to get roughly flat for the week, but it is still trading within spitting distance of new lows.

Finding winning stocks is, to say the least, difficult at the moment.

But this is always the case in a bear market.

But there are still some high-flyers to be found…

I’m talking about stocks in such tremendous uptrends, the general market has almost no bearing on their movement.

I call them honey badger stocks. You might remember the viral video from a few years back… “Honey badger don’t care!”

In the same sense, these stocks do not care whether the index is moving up or down. They move to the beat of their own drum. And catching these power moves can deliver huge profits.

Here are few of my favorite honey badgers right now:

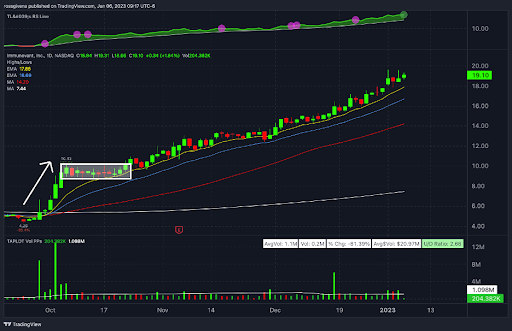
Immunovant (IMVT)

Immunovant is a biotech company developing therapies for patients living with autoimmune diseases.

This uptrend is about as pretty as it gets.

After doubling in a week in early October, the stock formed a tight consolidation and then broke out to new highs.

It has been riding its 10-day moving average (yellow line) for three months with almost no retracement.

With a stock like this, I like to buy any pullbacks to the 10-day EMA and place a stop beneath the 21-day (blue line). It keeps risk at less than 10% while still allowing me to participate in what can be a powerful move higher.

CymaBay Therapeutics (CBAY)

CBAY is another biotech stock making a huge move right now.

It is one of the small handful of breakouts that have played out as expected and followed through to the upside.

As of Friday morning, the stock is pulling back to its 10-day exponential moving average.

This is a good low-risk spot to place a long trade with a 6-7% stop.

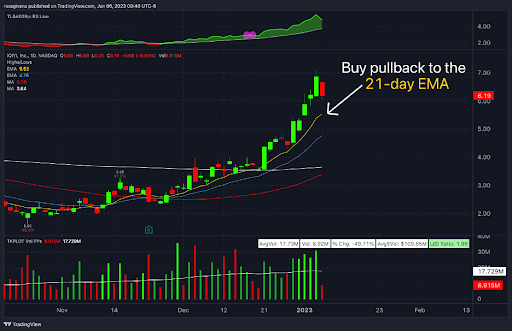
iQIYI (IQ)

IQ is a Chinese streaming service similar to Netflix.

I tend to stay away from Chinese stocks for a number of reasons, but this one is hard to ignore.

Shares are up 245% in the last two months with minimal retracement along the way.

It got a bit extended from its 10-day moving average last week, but I would consider buying on a pullback to it.

Best wishes for your trading,

Ross Givens

Editor, Stealth Trades
Weekly Update: No Santa Claus Rally This Year

Good evening, and welcome to this week’s edition of Stealth Trades!

The “Santa Claus rally” that often propels stocks at the end of the year did not make an appearance in 2022.

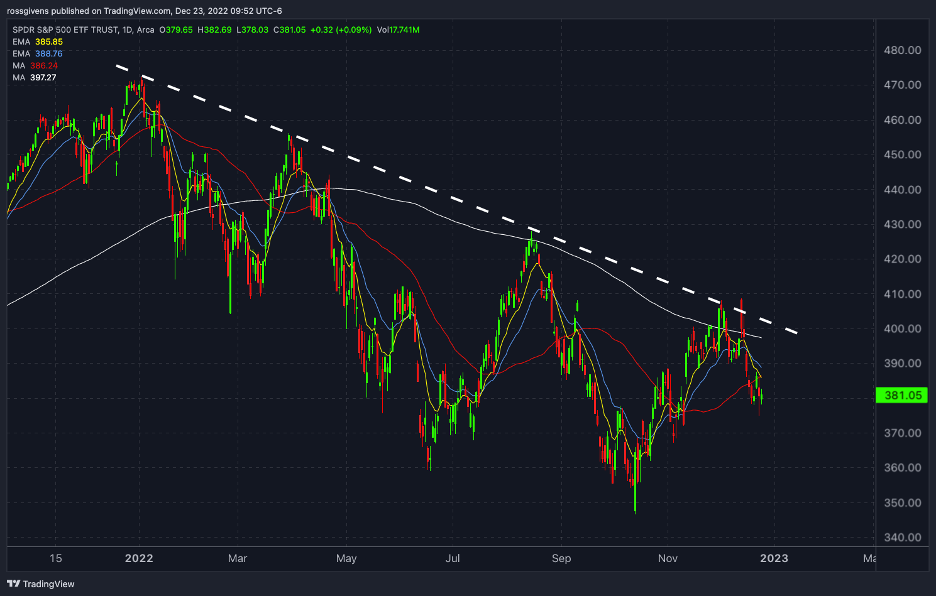
The bull market downtrend we have been talking about for months remained intact and stocks failed to bounce last week.

The S&P 500 index is not below all of its moving averages going into Christmas day.

As expected, we are seeing much better progress on short trades than longs. In fact, we just closed out a short trade on WOLF in my Alpha Stocks service for a 20.3% gain in four weeks.

This bear market will end. A new bull will show up when investors least expect it, and there will be ample opportunities for big wins on the long side.

But that time is not today.

Aggressively buying stocks when the index is in a defined downtrend, trading below its moving averages, against a backdrop of raising interest rates and slowing economic growth is asking for trouble.

Be patient. Be selective. And don’t fight the overall trend.

Right now, that trend is short.

Here are a few stocks I am watching right now:

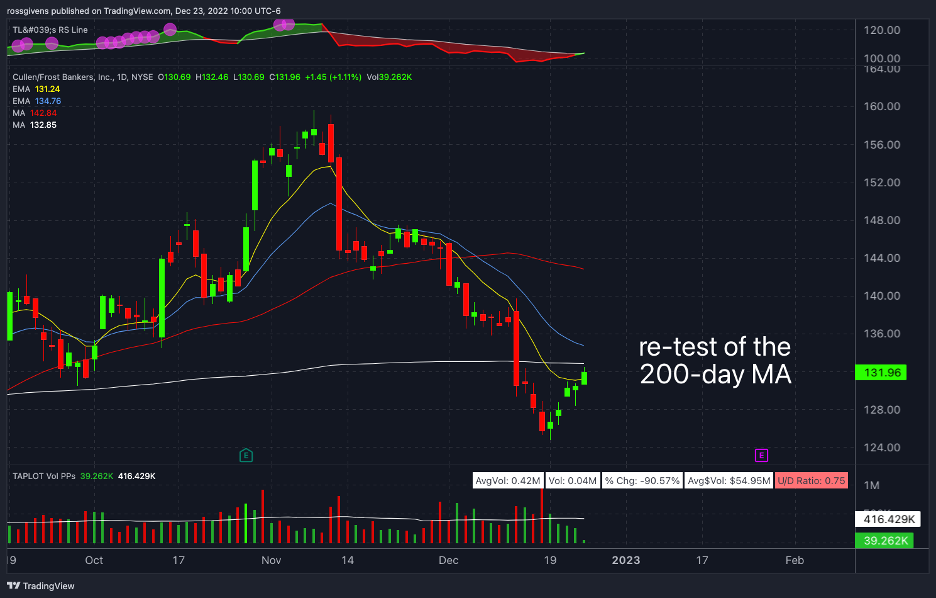
Cullen/Frost Bankers (CFR)

After climbing more than 40% from July to November, CFR is rolling over hard.

Big down days followed by 1-2 weeks of consolidation then another big down day – that has been the behavior for the last two months.

A quick look at the volume bars confirms who is in control.

Big drops occur on above-average volume contrasted by small rallies/consolidations on very low volume.

With shares now below the 200-day moving average, odds of a successful short play are even higher. And last week’s short-covering rally into the 200-day creates a low-risk entry point for a new short trade on CFR.

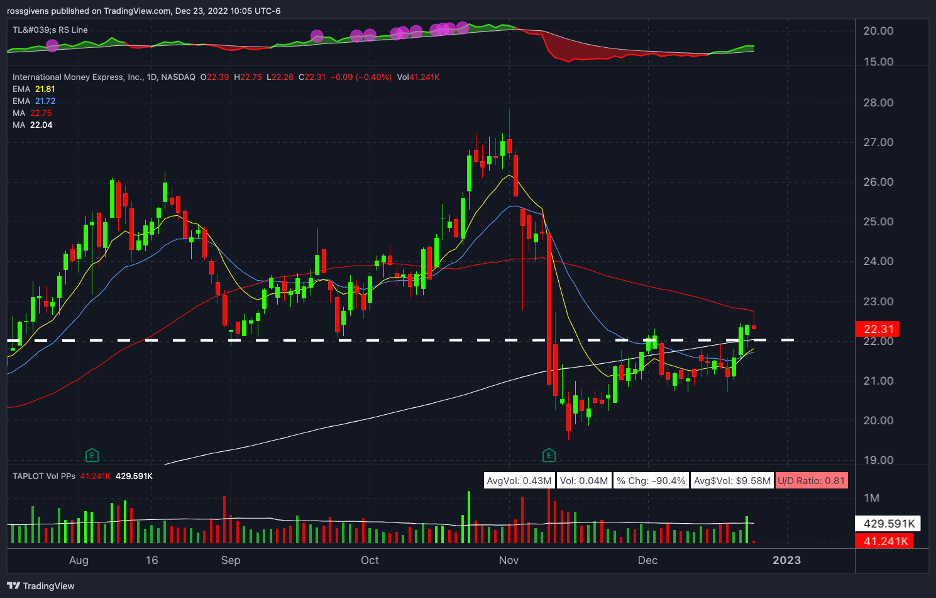
International Money Express (IMXI)

IMXI is unquestionably a short. Look at the massive selling on heavy volume that occurred in early November.

A relatively stable stock falling 30% in two weeks is a significant change in behavior, and it signals that institutions are dumping the stock in mass.

Shares have grinded higher over the last few weeks but made no significant progress.

IMXI is now trading against a previous support level which coincides with its 50 and 200-day moving averages. That is a lot of resistance to get through.

The low-risk play here is a short since you only need to risk 4-5% on the trade to see if it plays out as we expect.

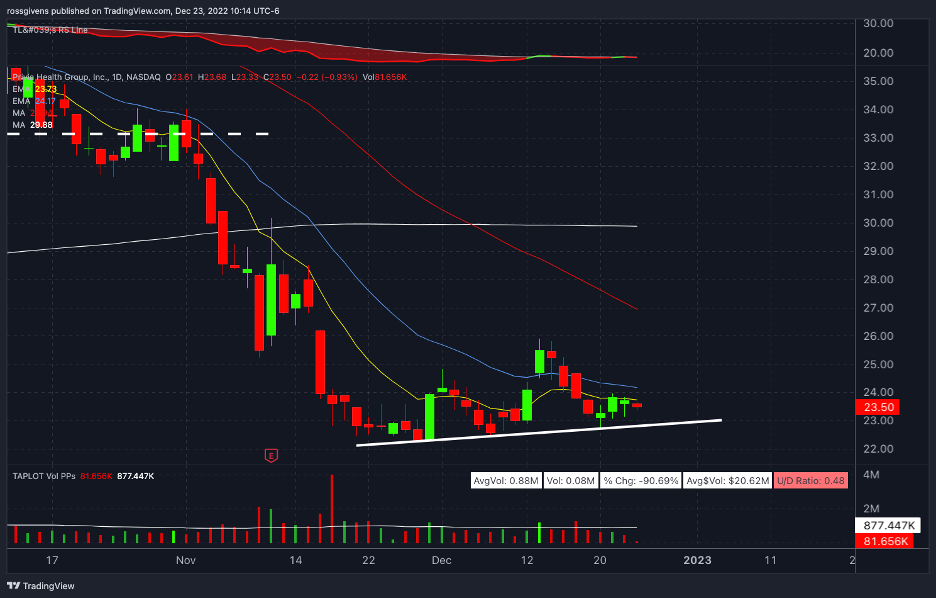
Privia Health (PRVA)

PRVA is a broken leader under heavy selling pressure.

After a 147% rally from May to August, the stock put in a double top and began rolling over.

Shares fell 48% over the next two months.

PRVA is now putting in a shelf at its lows. Notice how the move above the 21-day moving average was immediately rejected.

If the stock breaks this short-term support level, I will consider selling short for another leg lower.

Weekly Update: Struggles Persist for the S&P 500

Another week… same story.

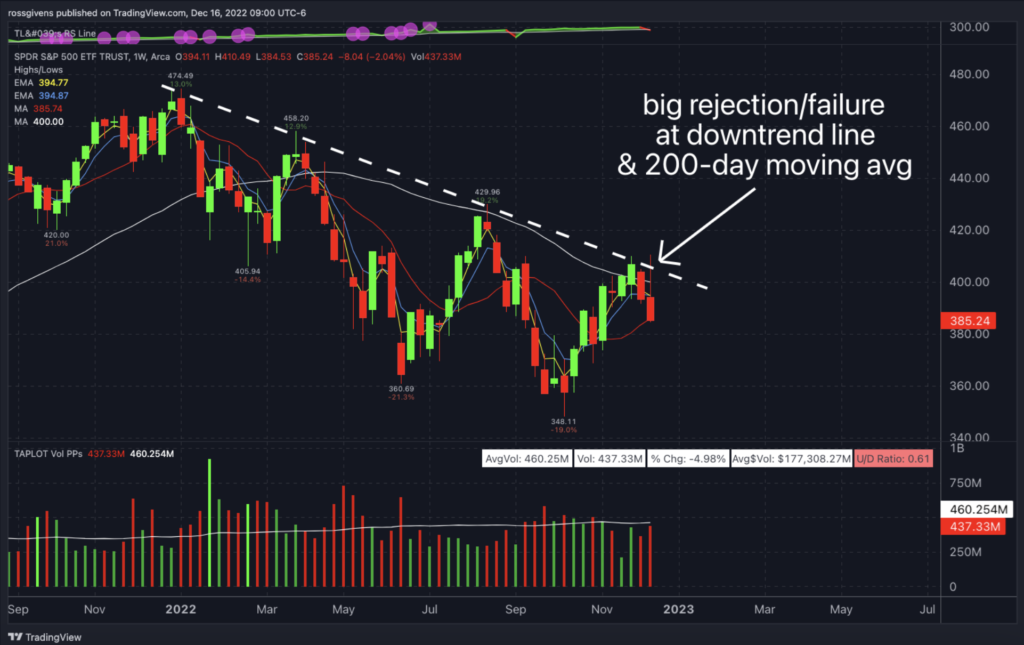
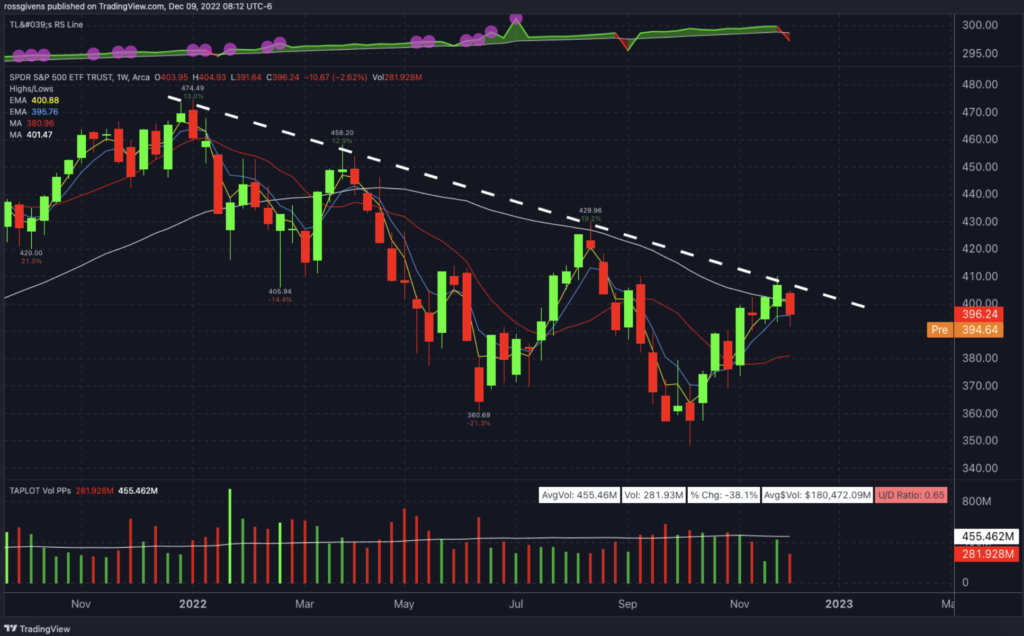
As I pointed out last Friday, the S&P 500 index was struggling at the downtrend line.

Data showing a slight weakening in inflation caused stocks to gap up on Tuesday morning before violently selling off for three straight days.

The weekly chart below shows this clearly:

In a game filled with up-to-the-second news and 7,000 investment choices, it is easy to become overwhelmed and flip opinions with every tick.

That is why the weekly chart is so important.

Step back. Look at the big picture. And trade in the direction of the overall trend.

Right now, that means short (or at least not aggressively buying anything).

Here are a few short trades I am watching now:

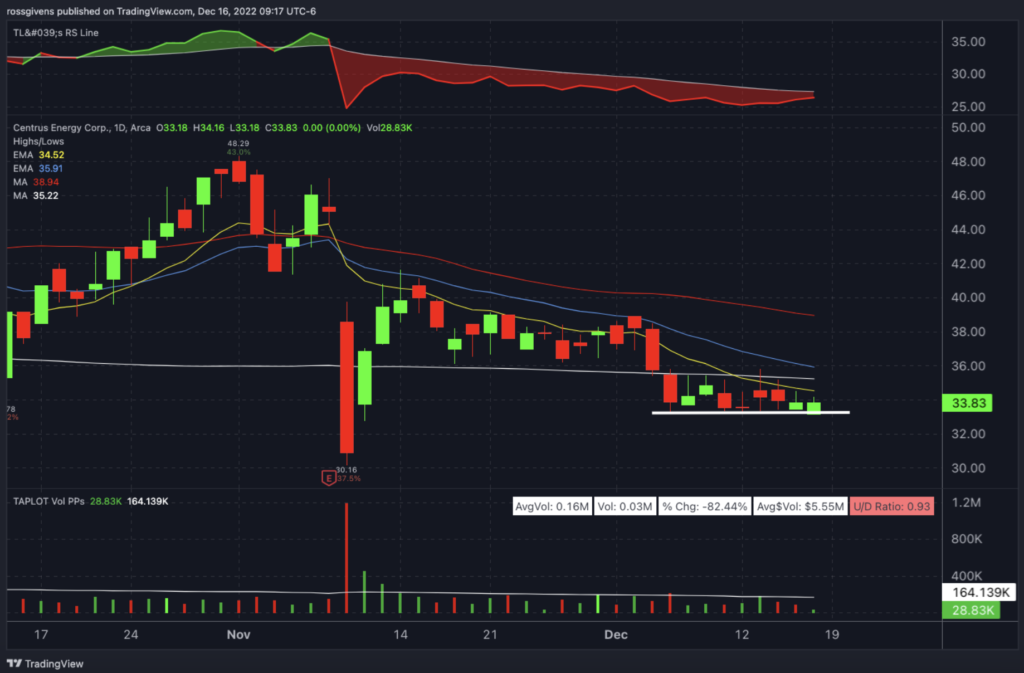
Centrus Energy (LEU)

LEU has been making lower lows and lower highs since September.

The stock fell 40% off its highs over the last 3 months and is now holding below its 200-day moving average – a crucial line in the sand for any stock.

LEU is forming a support shelf near $33. If this fails, I will consider selling this stock short for a continuation lower.

Alliance Resource Partners (ARLP)

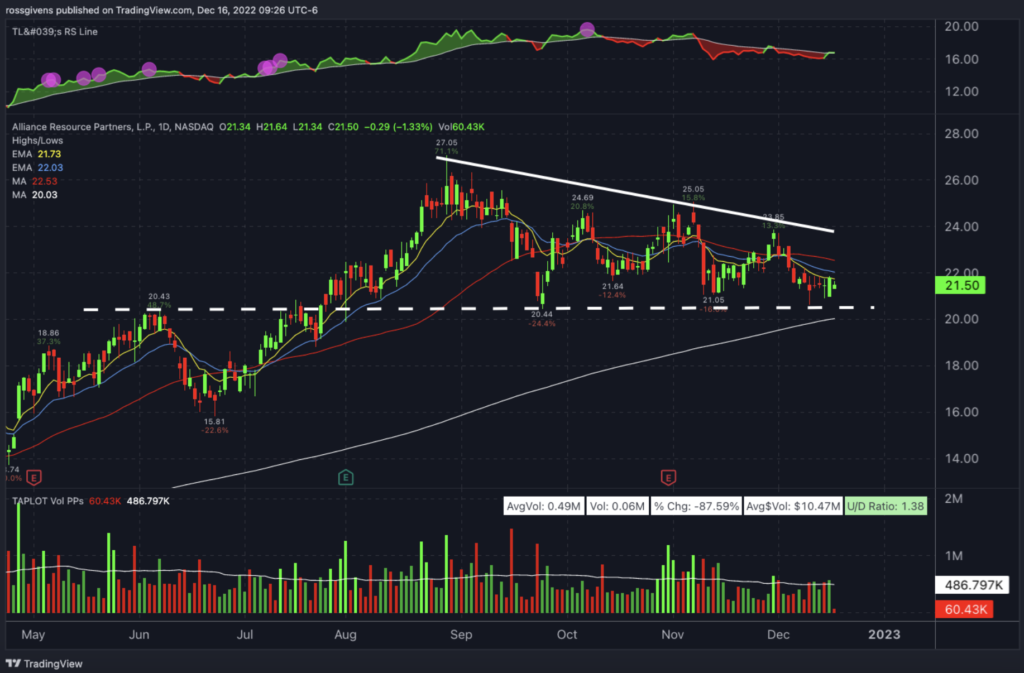
ARLP is forming a giant bear flag.

The $21 level (white dashed line on chart) is a significant one for this stock. It served as resistance before the breakout higher and then became support in the second half of the year.

Bulls are fighting to defend it here, but if that level breaks… watch out below.

Otter Tail Corporation (OTTR)

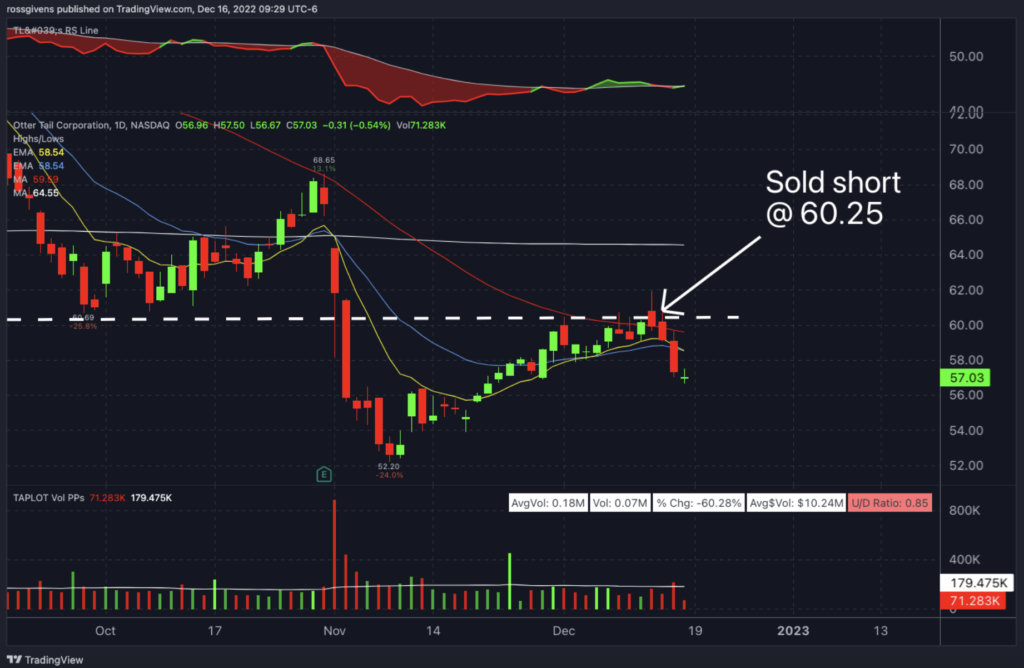
This is another textbook example of support becoming resistance.

When there is heavy selling like we saw in OTTR in early November, institutions are showing their hand. They are dumping the stock and possibly even selling it short.

From that point, the only question is where to get in.

I like to sell short on a re-test of previous support like we had here in OTTR.

DISCLOSURE: I am short OTTR from 60.25.

Best wishes for your trading, 

Weekly Update: Stocks Continue to Struggle

Stocks continue to struggle at the down trend line.

The confluence of this trend line and the 200-day moving average make for obvious resistance, so it is not surprising at all that we lost ground last week.

As I pointed out last week, interest rates and actions by the Federal Reserve (even guesses about those actions) are the driving force behind stock prices right now.

On Thursday, stocks rallied because jobless claims INCREASED.

The reason?

Traders think a weaker economy might cause the Fed to slow the pace of rate hikes.

The whole thing is counterintuitive and speaks to the difficulty of today’s environment for investors.

If you’re new to trading, don’t worry… things will get better. There will be a new bull market starting any day, and there will be a lot of money to be made when that happens.

In the meantime, just try not to do anything stupid. Remember, cash is a position. And sometimes the best trade is not to take one at all.

I took a couple new positions in my personal account this week in 2 stocks showing a lot of strength. The details are below:

DexCom (DXCM)

DexCom makes a revolutionary insulin monitoring device for diabetes patients that requires no finger pricks. It attaches to the skin and tracks insulin levels every hour throughout the day.

Exciting medical tech like this has been behind some of the biggest stock market winners in history.

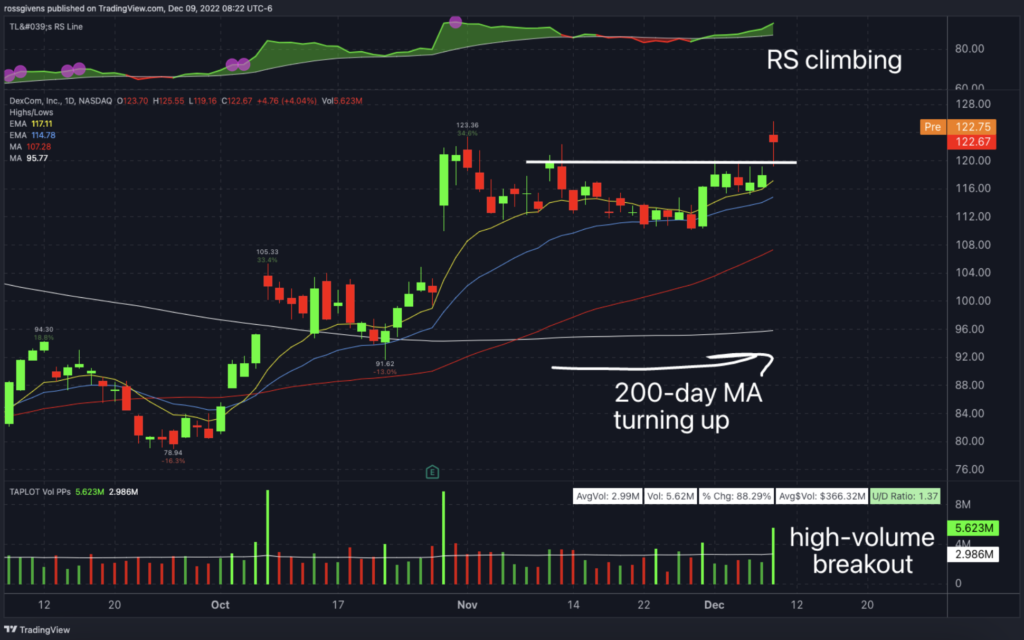
The chart looks exceptional.

Relative strength is climbing…

Price broke out to new highs on above-average volume…

And the 200-day moving average is beginning to turn up – which could signal the beginning of a new Stage 2 uptrend.

Insulet Corporation (PODD)

PODD is another medical technology stock showing high relative strength.

After a 52% surge off the October lows, PODD held its ground and only pulled back 10% from its highs.

This is a good sign of strength and shows that shareholders are not yet selling.

The stock drifted down from its $320 high on decreasing volume before surging back at the start of the month.

On stocks like this, I will sometimes begin building a position here in the low end of its range and add on if the stock breaks out to new highs.

I am long from 301.50.

Lantheus Holdings (LNTH)

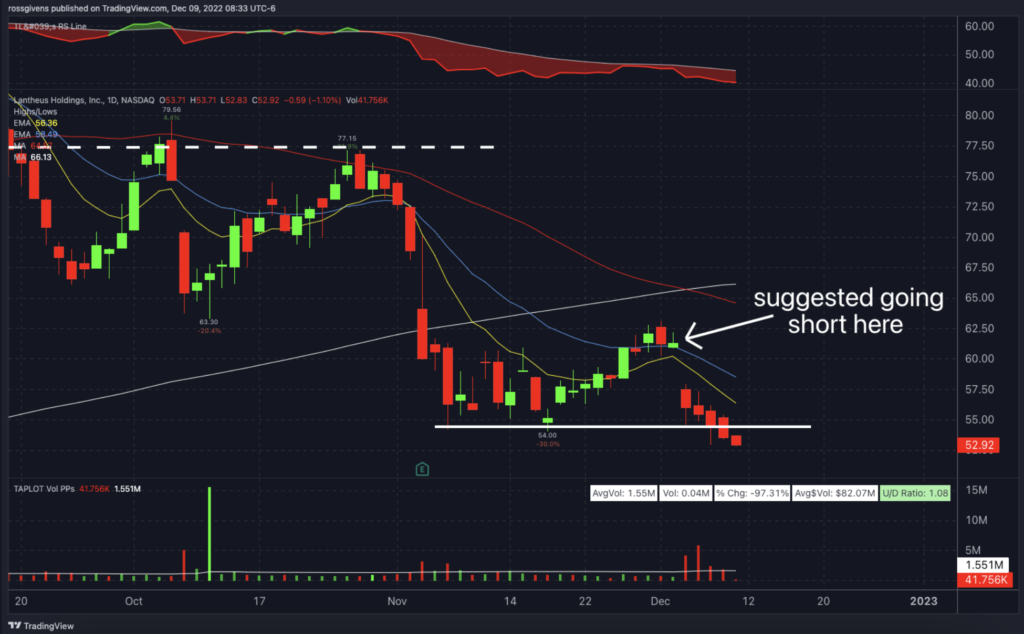
I put LNTH on the watchlist last week as a short, and the trade played out about as well as we could have hoped.

Shares fell roughly 14% this week on heavy selling volume.

If you took the trade, consider taking partial profits here and bringing your stop down to $58 to lock in additional gains.

If you don’t have a position, this break of the $54 support level could be another good place to take a short entry.

Best wishes for your trading, 

Weekly Update: The Number One Driver of Stock Prices

The number one driver of stock prices right now is the Federal Reserve and expectations of where they will set interest rates.

Stocks made a powerful move higher on Wednesday after Fed Chairman Jerome Powell indicated they may begin slowing the pace of rate hikes as early as December.

Personally, I could care less what the man has to say. Powell is the reason we are in this mess in the first place.

He ran the printing presses at max capacity in 2020, printing trillions of dollars in stimulus funny money. That, and that alone, is the reason for today’s historic inflation.

Now, in a complete 180, he is raising interest rates faster than any time in history in order to tame the very inflation he created.

Let’s not forget that this is the man who claimed inflation would be “transitory” (a fancy word for temporary) and the economy would not enter a recession (we are in one).

Powell has been wrong on every prediction so far, and his actions were responsible for both over-inflating stocks in 2020 and 2021 and crushing them in 2022.

The least he could do is keep his mouth shut and not stir up even more volatility.

But regardless of my feelings about the little weasel, he has been clear about the Fed’s current mission – tame inflation by any means necessary. That means rate hike after rate hike to engineer a recession until inflation comes down to his 2% goal.

In my opinion, Wall Street overreacted on Wednesday and turned prematurely optimistic based on a single comment about possibly slowing rate hikes.

Wall Street is betting on Powell to pivot… to change his stance and lower rates to help the economy. Powell will not pivot. He is an extremist. And I believe there is more pain to come.

The S&P 500 has now rallied 15% from its October lows, but the 200-day moving average is likely to hold stocks back.

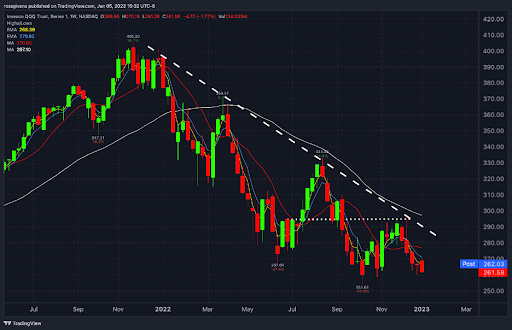
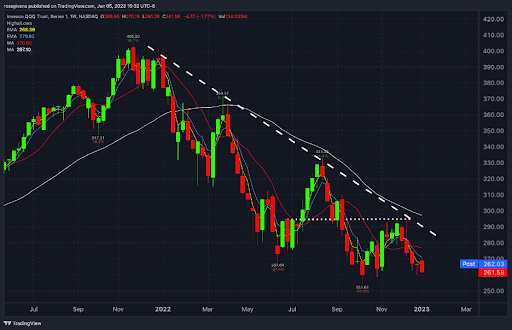
The Nasdaq is also facing heavy resistance:

This remains a stock picker’s market. Throwing a dart at a board would have turned over winners in 2021, but this year has proved more difficult than most.

I encourage traders to stick to low-risk, high-probability trades and nail down profits when you have them.

The easy days will return. In fact, I expect the market to bottom in the next three months. But until then, it is best to play things tight.

Here are a few trades I am watching right now:

Lantheus Holdings (LNTH)

LNTH is what I call a “broken leader.” This is a stock that once led the market but has now rolled over and begun its decline.

We made money shorting this stock near $77 back in October.

I would consider getting short again in the $62-$65 area with the 50- and 200-day moving averages above likely to act as resistance.

Centrus Energy (LEU)

LEU has been unable to rally, even with the aggressive buying that took place last week.

There is a shelf of support near $36 along with the 200-day moving average.

If the stock breaks below here, especially on heavy volume, I will consider selling short.

Enphase Energy (ENPH)

ENPH is a solar stock that has been a market leader all year.

We picked up a huge win on this one back in July when it emerged from a breakout pattern.

Today, ENPH is breaking out again from an almost identical pattern.

Consider a long in ENPH with a tight stop near $303.

Market Update: The Line in the Sand

Editor’s Note: US markets close early at 1 p.m. ET today, and the Traders Agency offices are closed all day.

It was a short trading week with the Thanksgiving holiday on Thursday.

And I plan to keep this update short as well because I know many of you are still busy spending time with family and friends.

As expected, not much happened in the market this week.

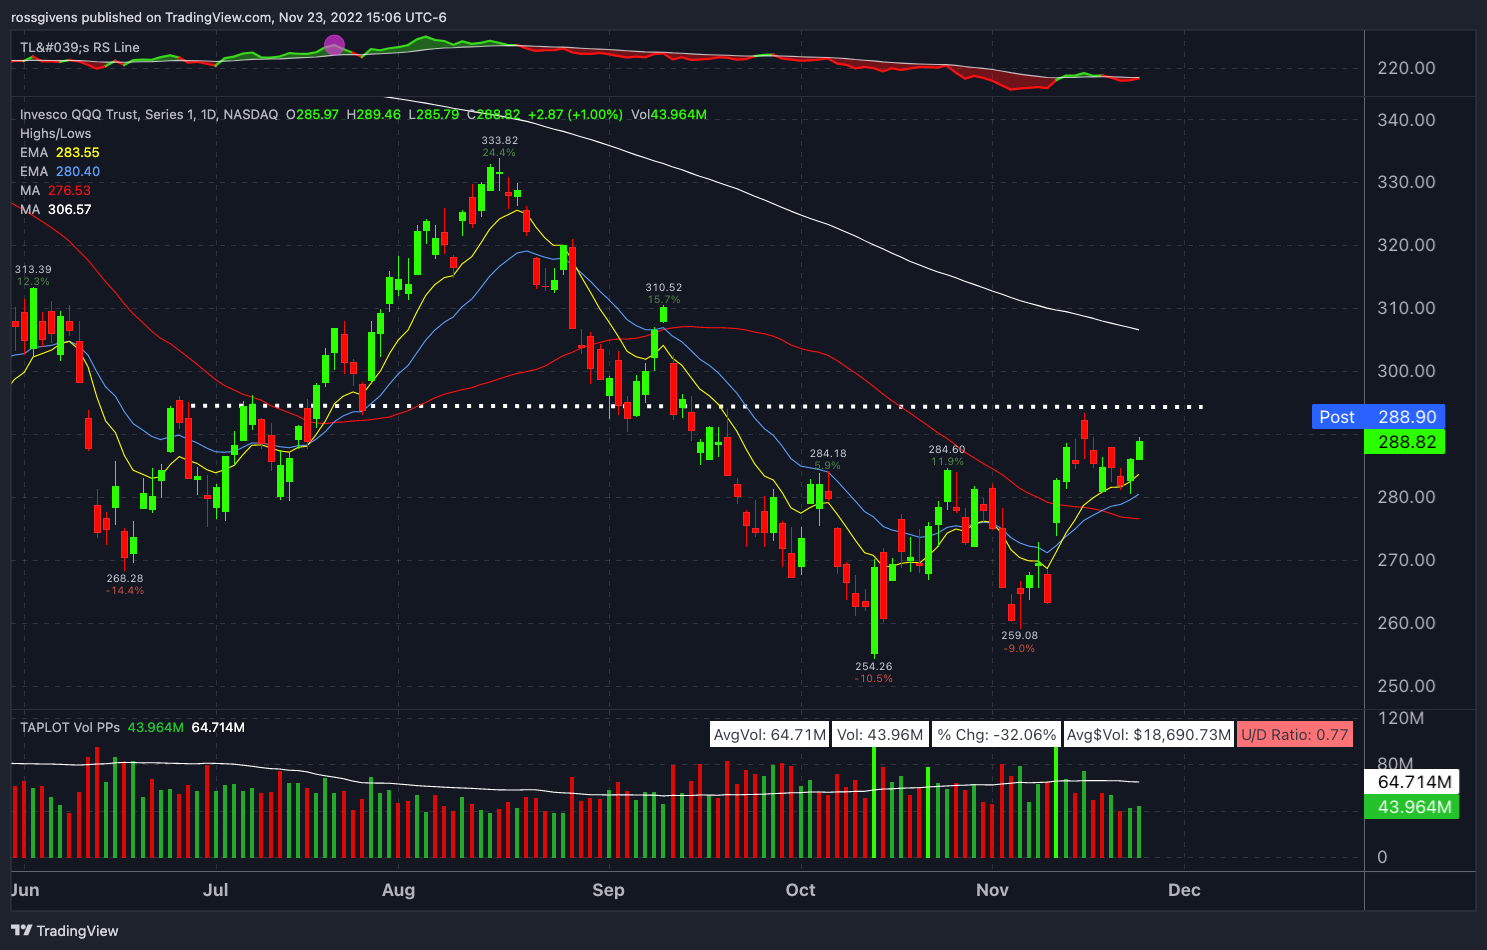
We made it through midterms and earnings season without too much disruption, but the Nasdaq 100 is now facing a key resistance level…

Daily Chart of Invesco QQQ Trust (QQQ) – Source: TradingView

The white dotted line on the chart above shows the “line in the sand” for the Nasdaq. This area has proven itself as notable resistance from below and support above.

Of the three major indexes, the Nasdaq is unquestionably the weakest. Tech stocks, which have led the market for most of the last 12 years, are lagging by a noticeable margin.

A breakout higher in the tech sector would be a strong signal that the selling may have finally peaked.

Stealth Trades Watchlist

Each of the names I put on last week’s Watchlist are still in play and remain on the Watchlist for this coming week.

Flex Ltd. (FLEX) and Enphase Energy, Inc. (ENPH) are both inching higher from clean base patterns. And Denbury Inc. (DEN) is trying to hold its ground.

I’ll have a new Watchlist for you on Friday, Dec. 2, and we’ll will dive deeper into what’s on my radar in Monday’s live Stealth Trades session at 3 p.m. ET.

Click here to view the full Watchlist!

But remember that not all of the stocks on our Watchlist are actionable…

When it’s time to make an official recommendation for our Trade Tracker, I’ll let you know on our Alerts page right here!

Massive 50% Savings Right Now

Looking for the BEST Black Friday deals that DON’T require driving through crazy traffic and fighting your way through over-crowded malls?

Look no further than Traders Agency’s Black Friday Buying Spree… 

Where you can DOUBLE your buying power and take 50% OFF all of my premium alert services!

That’s right… 

NOW is your chance to claim a seat inside any of my premium programs at HALF the normal rate… 

Which means you can go ahead and claim TWO for the price of ONE with this limited-time deal.

Don’t miss your shot… 

Click here now to claim 50% off and double your buying power during Traders Agency’s Black Friday Buying Spree!

Live Coaching Session

I hope you’ll join me on Monday, Dec. 28, for our next live Stealth Trades session at 3:00 p.m. ET…

We’ll cover all of our new stocks on the Watchlist as well as the rest of the stocks inside Stealth Trades.

You need to attend this session to get the most from your subscription!

In the meantime, you can watch the replay of our latest Stealth Trades session right here.

Best wishes for your trading,

Ross Givens

Editor, Stealth Trades
P.S. Click here now to claim TWO for the price of ONE with this limited-time deal.

Weekly Update: Stocks Stall at 200-Day Moving Average

Stocks went nowhere this week.

After a huge move the week before, the indexes stalled. 

As expected, the S&P found resistance at its 200-day moving average.

Daily Chart of SPDR S&P 500 ETF Trust (SPY) with 200-Day Moving Average – Source: TradingView

I also don’t expect to see much movement this coming week.

US markets are closed all day on Thursday for the Thanksgiving holiday, and they will close early at 1 p.m. ET on Friday. 

Volume is usually relatively low surrounding the Thanksgiving holiday. 

Unless Putin fires missiles or Biden does something crazy, it will likely be a short, quiet week in the market.

The Big Picture

Looking at the big picture, I am still not convinced the market has bottomed.

The Federal Reserve is expected to raise interest rates another 50 basis points (0.5%) at its next meeting.

That is only slightly better than the previously unprecedented 75-basis-point hikes we’ve seen lately. 

The Fed also remains committed to aggressively unloading its $8 trillion balance sheet on the market, which will be a huge headwind for investors.

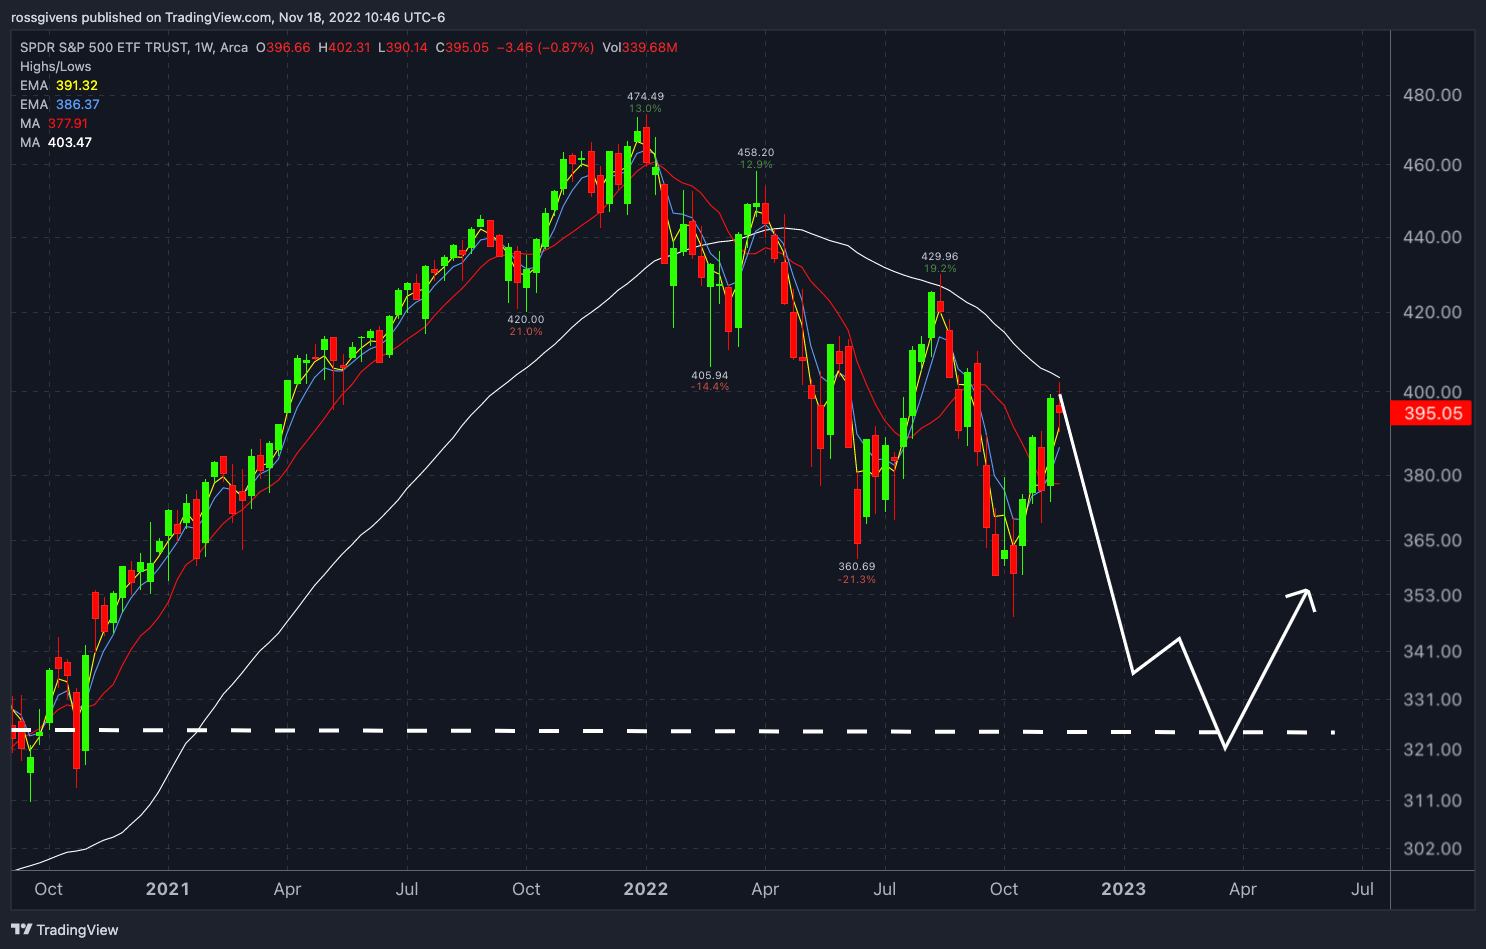
Personally, this is what I expect to see…

Weekly Chart of SPDR S&P 500 ETF Trust (SPY) with Price Projection – Source: TradingView

We will see how things play out, but I believe we could see another 15%-20% leg down in the index before reaching a bottom.

There are still some stocks showing strength, though, with some sectors outperforming the rest. 

Stealth Trades Watchlist

Click here to view this week’s full Watchlist!

But remember that not all of the stocks on our Watchlist are actionable…

When it’s time to make an official recommendation for our Trade Tracker, I’ll let you know on our Alerts page right here!

Insiders Lead the Way

Now, if you’ve ever wondered how I developed a proven track record of trading along the insiders like corporate CEOs, CFOs, executives and board members…

Do yourself a favor and check out my latest Insider Effect presentation!

Corporate insiders are always buying or selling shares in the companies they operate. These folks have a footing of knowledge that Main Street investors simply do not.

I talked more about this in my latest presentation, which you can watch at your convenience right here.

I covered my strategy for trading alongside corporate insiders and generating potentially massive gains as a result.

Just click here to learn more about my Insider Effect strategy and see what you could be missing out on…

Live Coaching Session

I hope you’ll join me on Monday, Nov. 21, for our next live Stealth Trades session at 3:00 p.m. ET…

We’ll cover all of our new stocks on the Watchlist as well as the rest of the stocks inside Stealth Trades.

You need to attend this session to get the most from your subscription!

In the meantime, you can watch the replay of our latest Stealth Trades session right here.

Best wishes for your trading,

Ross Givens

Editor, Stealth Trades
P.S. Click here to watch my latest presentation and learn more about my Insider Effect strategy!