Weekly Update: How to Trade Bitcoin
Good evening, and welcome to this week’s edition of Stealth Trades!
All eyes were on crypto this week as Bitcoin hit the elusive $100k target.
President Elect Trump’s pro-crypto stance, which initially seemed like a political vote grab, is causing billions of investment dollars to flood into the cryptocurrency market.
Crypto stocks have been the top-performing group in the market over the last one, two and three-month periods.
The obvious names like crypto miners Hut 8 (HUT), MARA Holdings (MARA) and Riot Platforms (RIOT) have made big strides. So have crypto brokers like Coinbase (COIN), Robinhood (HOOD).
But the most liquidity is going to Bitcoin itself, which now has a market capitalization of $2 trillion. Only three companies – Apple, Nvidia and Microsoft – are worth more.
For those interested in dipping your hand in Bitcoin, I have found that it trades in a very technical manner. Consolidations are typically clean, breakouts lead to sustained trends higher, and it tends to follow the same 4 Stage Cycle found in growth stocks.
Below is a weekly chart of Bitcoin on which I have marked up each of the 4 stages. If you are not familiar with this process, join me in our Live weekly Stealth Trades sessions every Monday at 4pm ET where I walk members through it.

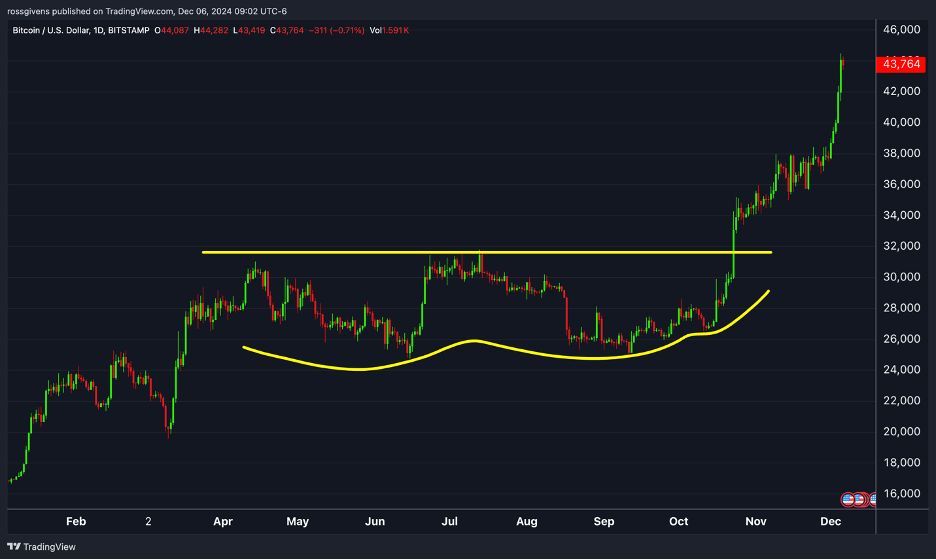
As I mentioned, BTC also trades in a very technical manner. Below is a daily chart highlighting the shallowing compression pattern it put in from March to November.

This is a proven pattern that often leads to big, fast moves like what we have seen from Bitcoin over the last couple weeks.
In fact, it could be setting up for another move higher (see chart below):

Symbolic prices like $100, $500, or in this case $100k are psychologically significant to traders. “I’ll sell it if it gets to $1,000.”
Simple? Yes. But it’s true. We almost always see near-term resistance at these big levels since traders often take profits and slow momentum. That is exactly what we are seeing today in Bitcoin.
But the shallowing pullbacks I have highlighted in yellow on the chart show dwindling supply as coins consolidate from weak hands into strong. Limited supply is one of the key contributors to a stock’s movement since buyer demand can more easily push the price higher.
We saw a similar pattern when it broke out above $30k in 2023:
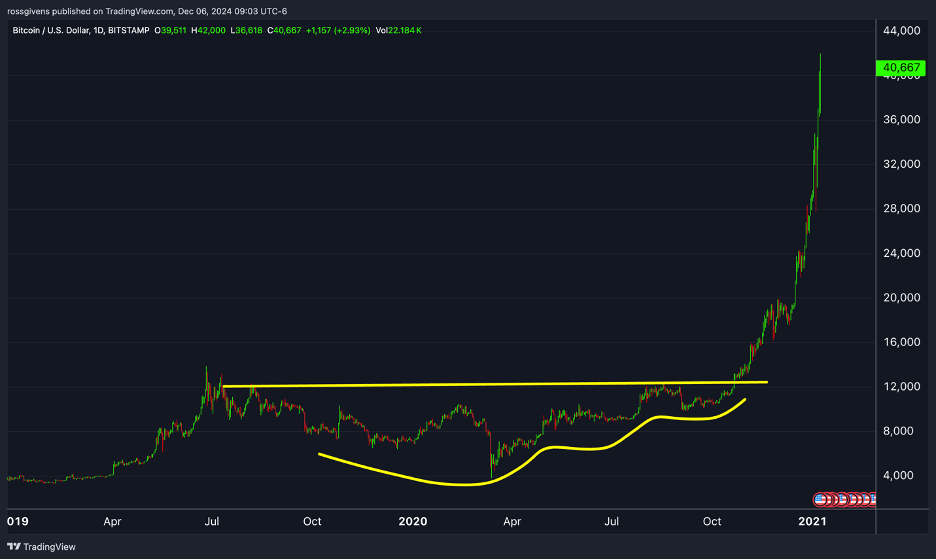
And $12k back in late 2020:
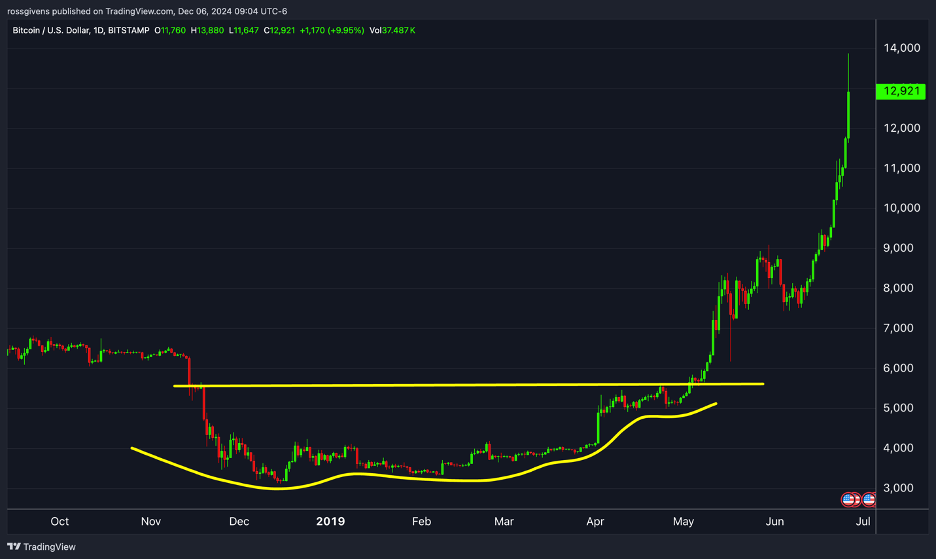
We saw it again coming off the low 2019:
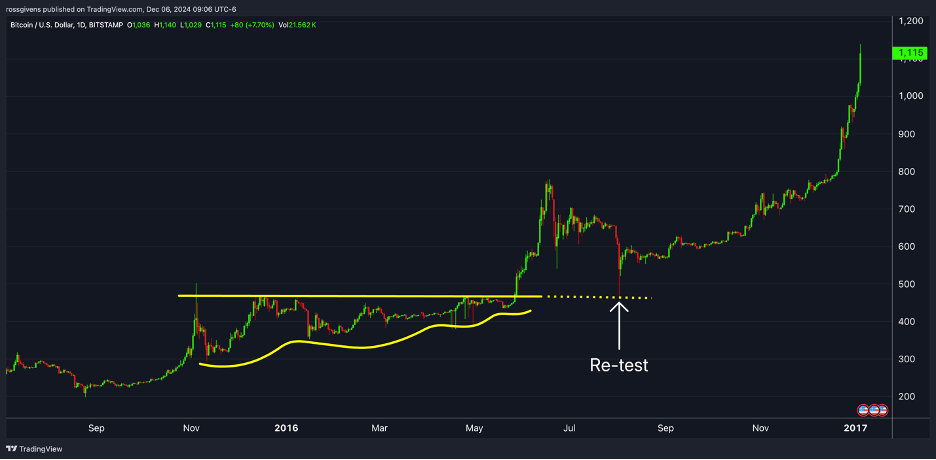
It has even appeared in early-stage breakouts as far back as 2016:
There is no need to re-invent the wheel. Whether it’s Bitcoin, Nvidia stock, or the price of feeder cattle, look to the market to tell you when to buy.
We have no informational edge over Wall Street. And I won’t pretend to be smarter than the rest. You must learn to interpret price and volume… to identify these low-risk, high-reward entry points where supply and demand dynamics give you a statistical edge.
That is how traders make money.
Best wishes for your trading,